| Param | Original file | Final file |
|---|---|---|
| Filename | modeM0/AS1C03_012T01_9000001642_11256cztM0_level2.evt | modeM0/AS1C03_012T01_9000001642_11256cztM0_level2_quad_clean.evt |
| Size (bytes) | 634,357,440 | 79,257,600 |
| Size | 605.0 MB | 75.6 MB |
| Events in quadrant A | 3,928,843 | 506,880 |
| Events in quadrant B | 3,831,504 | 516,396 |
| Events in quadrant C | 2,999,205 | 508,804 |
| Events in quadrant D | 8,031,232 | 433,645 |
| Mode SS | |||
|---|---|---|---|
| Quadrant | BADHDUFLAG | Total packets | Discarded packets |
| A | 0 | 126 | 0 |
| B | 0 | 126 | 0 |
| C | 0 | 126 | 0 |
| D | 0 | 126 | 0 |
| Mode M9 | |||
|---|---|---|---|
| Quadrant | BADHDUFLAG | Total packets | Discarded packets |
| A | 0 | 11 | 0 |
| B | 0 | 11 | 0 |
| C | 0 | 11 | 0 |
| D | 0 | 11 | 0 |
| Mode M0 | |||
|---|---|---|---|
| Quadrant | BADHDUFLAG | Total packets | Discarded packets |
| A | 0 | 15593 | 2 |
| B | 0 | 15313 | 1 |
| C | 0 | 13001 | 1 |
| D | 0 | 28148 | 1 |
| Quadrant | Total seconds | Saturated seconds | Saturation percentage |
|---|---|---|---|
| A | 6217 | 213 | 3.426090% |
| B | 6217 | 200 | 3.216986% |
| C | 6217 | 42 | 0.675567% |
| D | 6217 | 1852 | 29.789287% |
Noise dominated data is calculated using 1-second bins in cleaned event files. If a bin has >2000 counts, and if more than 50% of those come from <1% of pixels, then it is considered to be noise-dominated and hence unusable.
| Quadrant | # 1 sec bins | Bins with >0 counts | Bins with >2000 counts | High rate bins dominated by noise | Noise dominated (total time) | Noise dominated (detector-on time) | Marked lightcurve |
|---|---|---|---|---|---|---|---|
| A | 7292 | 6218 | 145 | 145 | 1.99% | 2.33% | 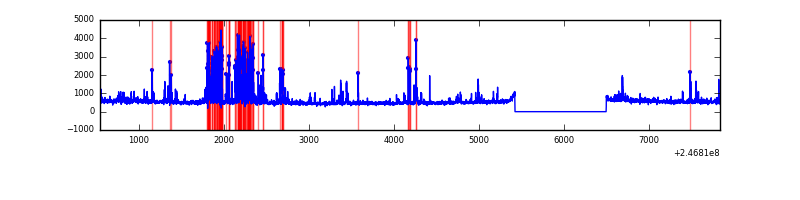 |
| B | 7292 | 6218 | 90 | 90 | 1.23% | 1.45% | 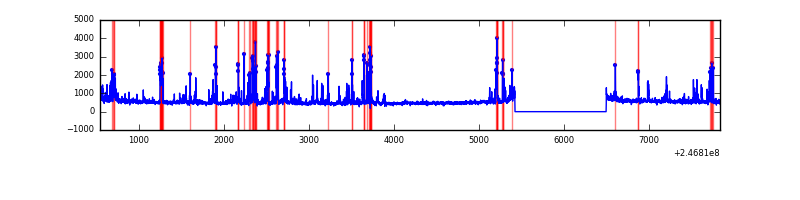 |
| C | 7292 | 6218 | 15 | 15 | 0.21% | 0.24% |  |
| D | 7292 | 6218 | 1481 | 1481 | 20.31% | 23.82% | 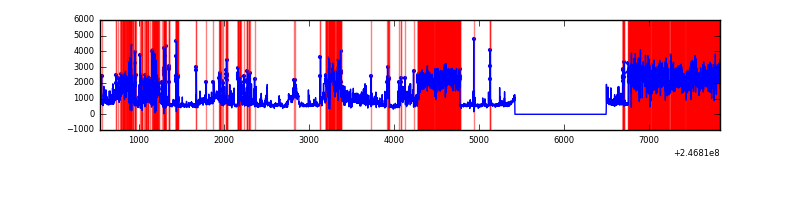 |
Top three noisy pixels from each quadrant. If the there are fewer than three noisy pixels in the level2.evt file, extra rows are filled as -1
| Pixel properties | Quadrant properties | ||||||
|---|---|---|---|---|---|---|---|
| Quadrant | DetID | PixID | Counts | Sigma | Mean | Median | Sigma |
| A | 14 | 238 | 564072 | 3594.99 | 760 | 746 | 156.7 |
| A | 8 | 5 | 282749 | 1799.67 | 760 | 746 | 156.7 |
| A | 8 | 15 | 76748 | 485.02 | 760 | 746 | 156.7 |
| B | 4 | 239 | 554143 | 3825.77 | 765 | 750 | 144.6 |
| B | 11 | 51 | 132578 | 911.37 | 765 | 750 | 144.6 |
| B | 15 | 204 | 59458 | 405.87 | 765 | 750 | 144.6 |
| C | 9 | 204 | 84228 | 483.59 | 747 | 754 | 172.6 |
| C | 13 | 61 | 5517 | 27.59 | 747 | 754 | 172.6 |
| C | 7 | 238 | 1961 | 6.99 | 747 | 754 | 172.6 |
| D | 13 | 104 | 2177570 | 13998.15 | 650 | 635 | 155.5 |
| D | 13 | 152 | 2112488 | 13579.66 | 650 | 635 | 155.5 |
| D | 8 | 195 | 426550 | 2738.72 | 650 | 635 | 155.5 |
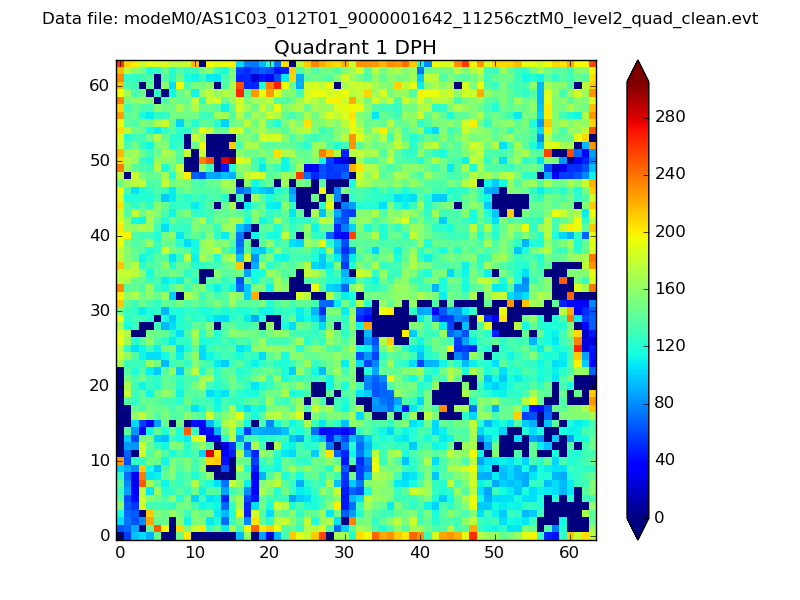
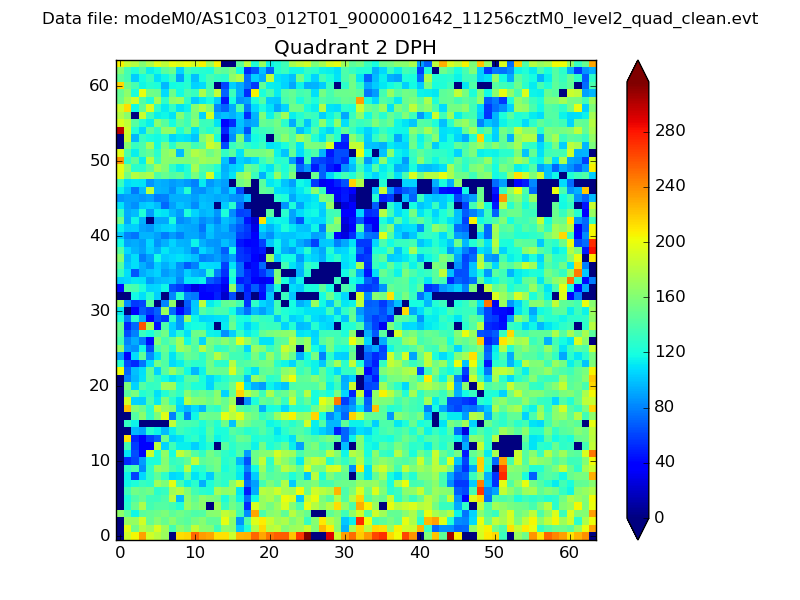
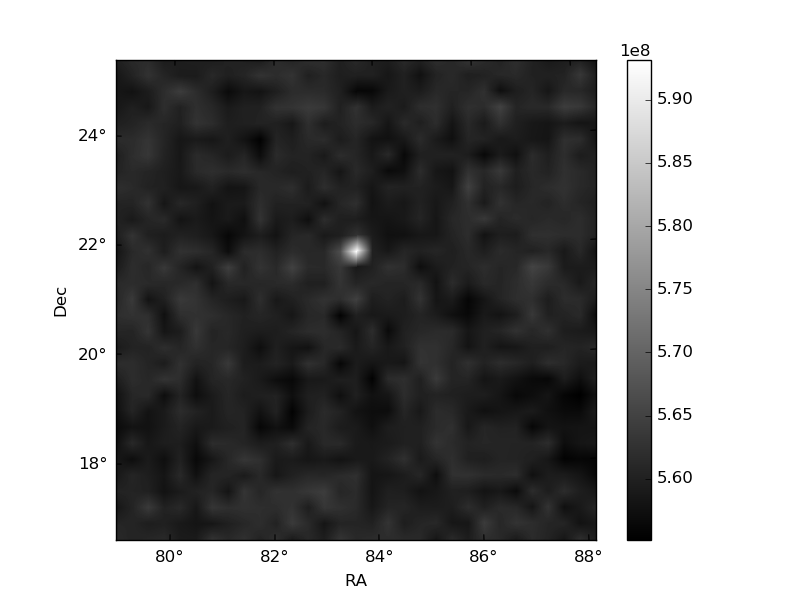
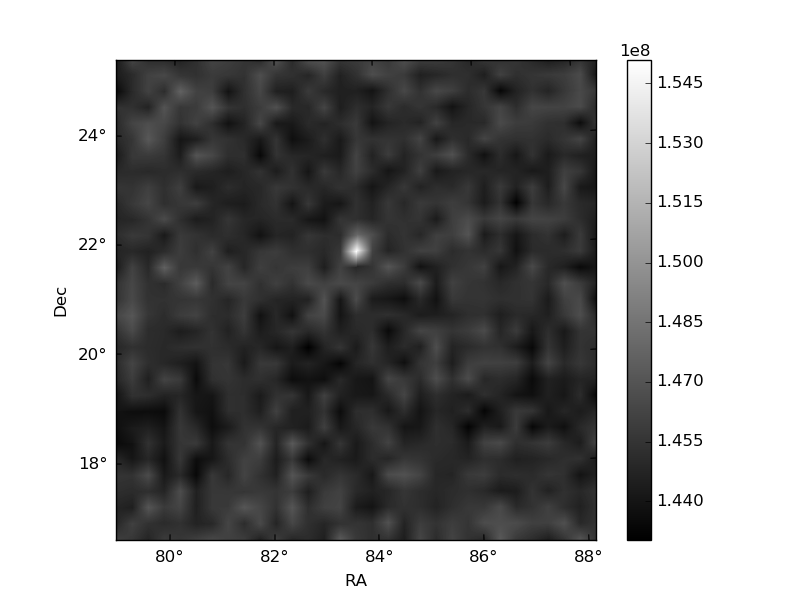
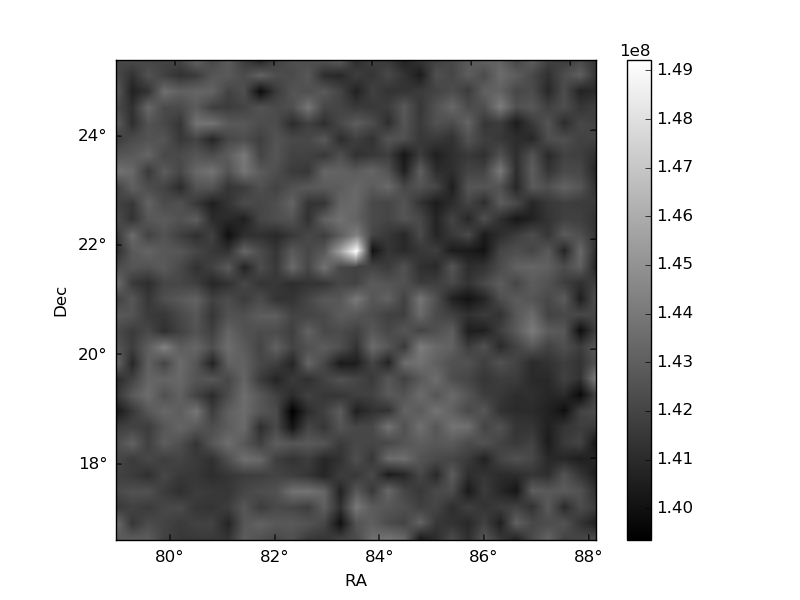
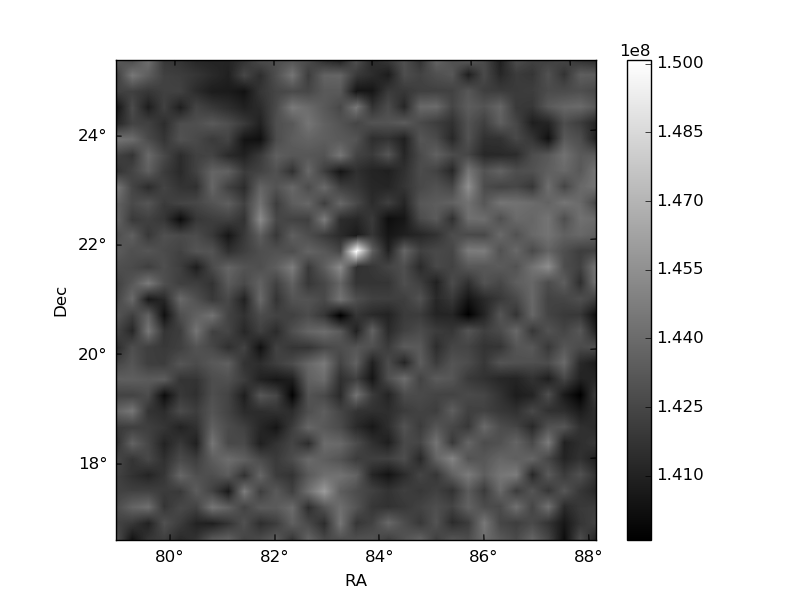
Histogram calculated using DETX and DETY for each event in the final _common_clean file
| Quadrant A | 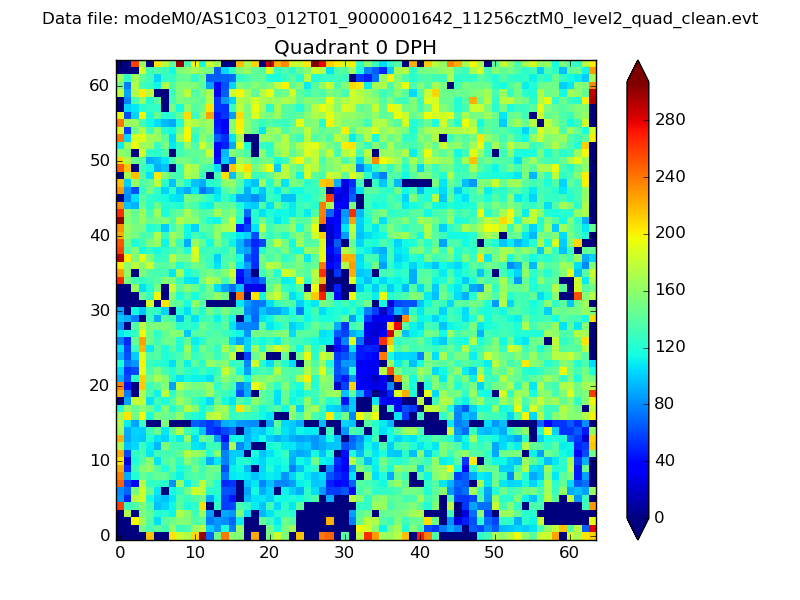 |
 |
Quadrant B |
|---|---|---|---|
| Quadrant D | 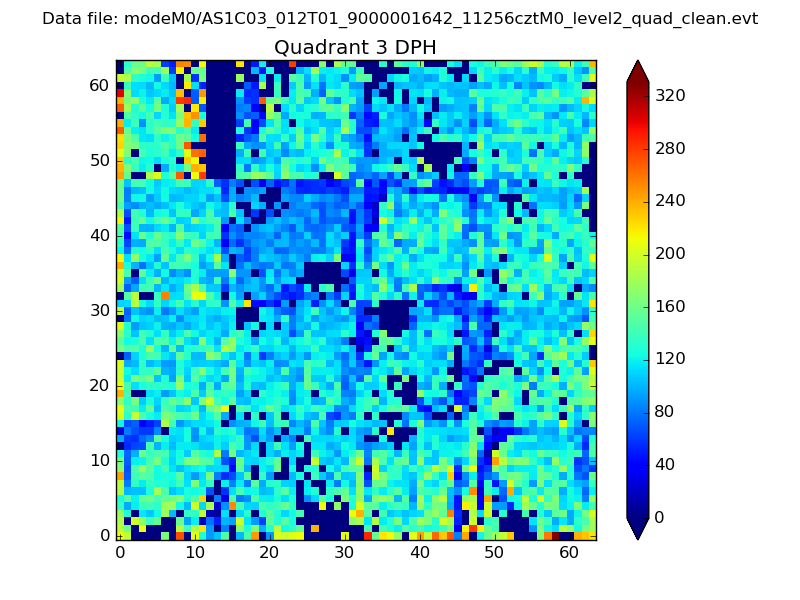 |
 |
Quadrant C |
| Plot type | Count rate plots | Images |
|---|---|---|
| Comparison with Poisson distribution Blue bars denote a histogram of data divided into 1 sec bins. Red curve is a Poisson curve with rate = median count rate of data. |
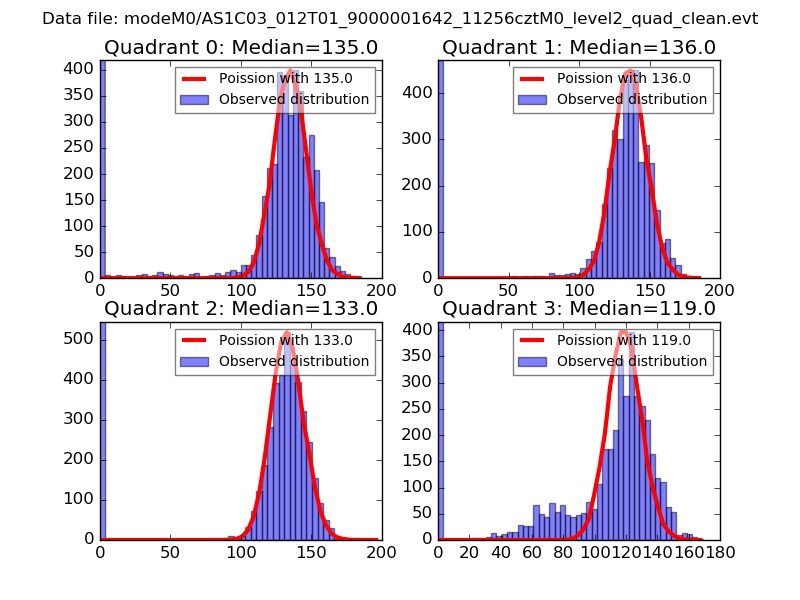 |
 |
| Quadrant-wise count rates Data is divided into 100 sec bins |
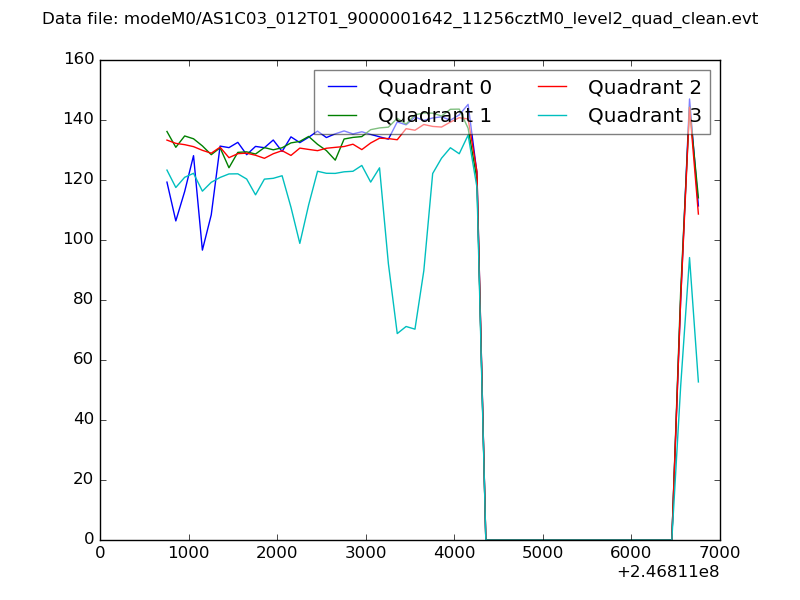 |
|
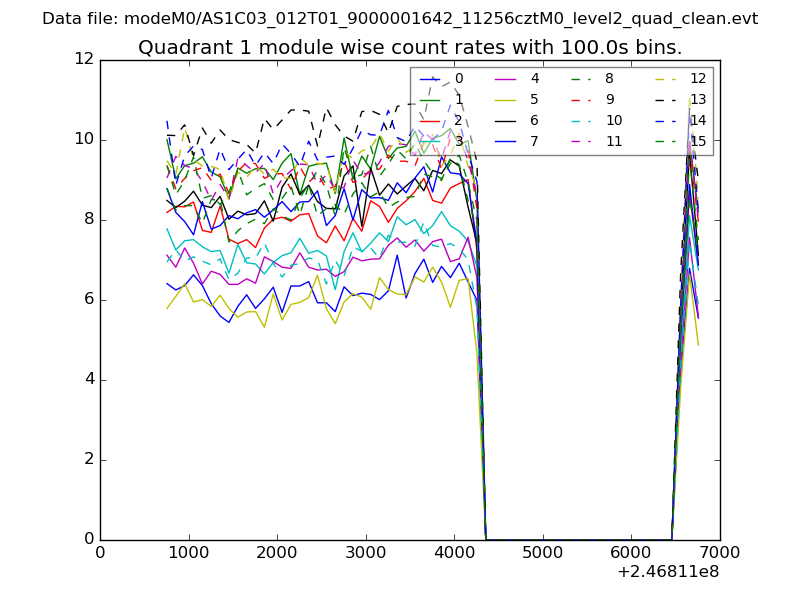
| Module-wise count rates for Quadrant A Data is divided into 100 sec bins |
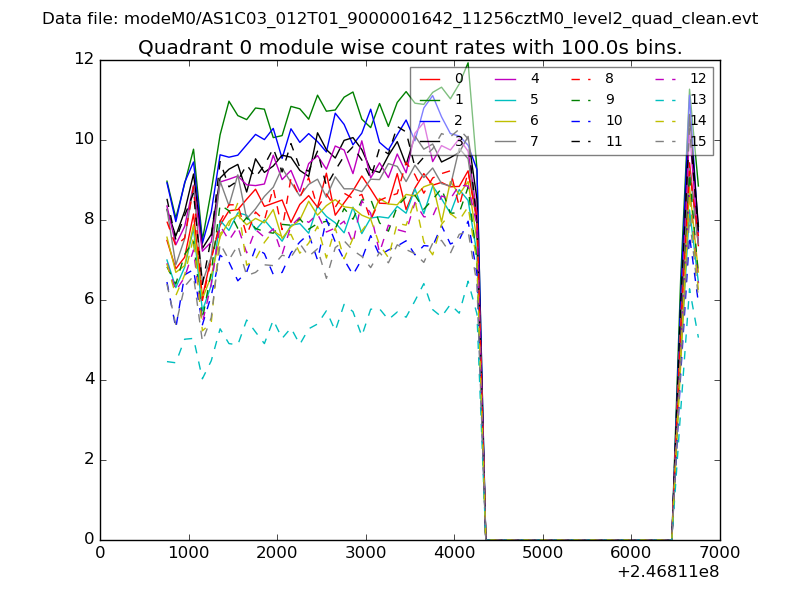 |
 |
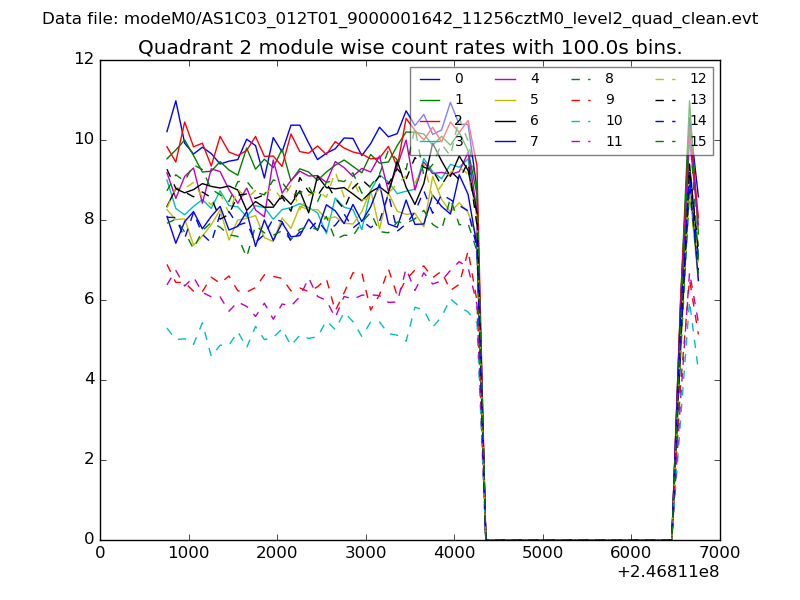
| Module-wise count rates for Quadrant B Data is divided into 100 sec bins |
 |
 |
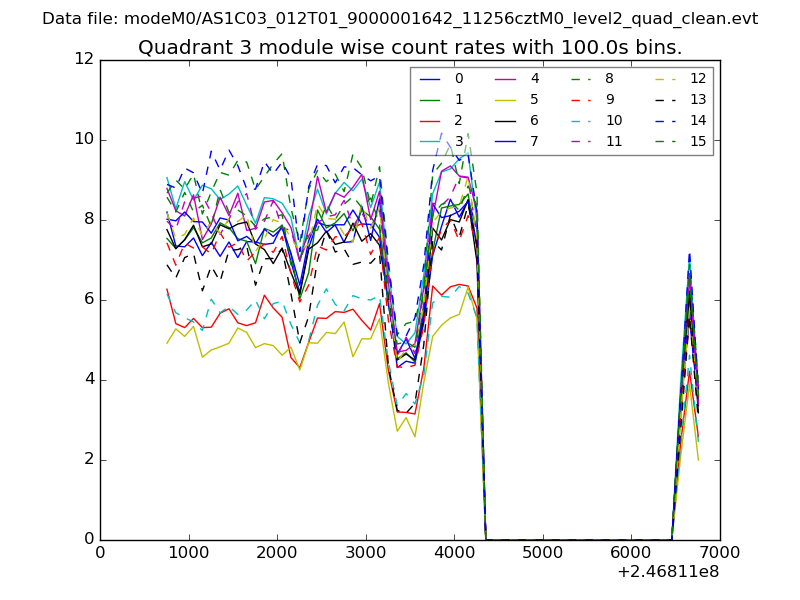
| Module-wise count rates for Quadrant C Data is divided into 100 sec bins |
 |
 |
| Module-wise count rates for Quadrant D Data is divided into 100 sec bins |
 |
 |
| Parameter | Plot |
|---|---|
| CZT HV Monitor | 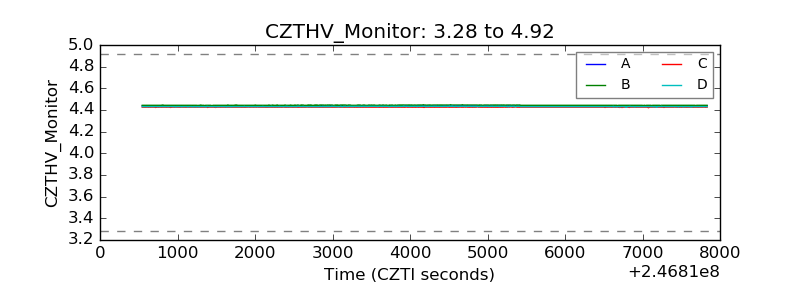 |
| D_VDD | 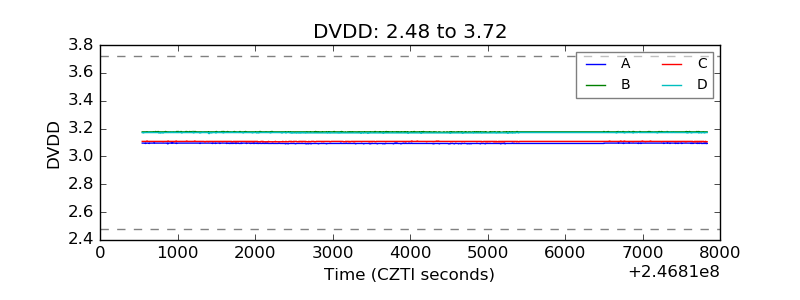 |
| Temperature 1 | 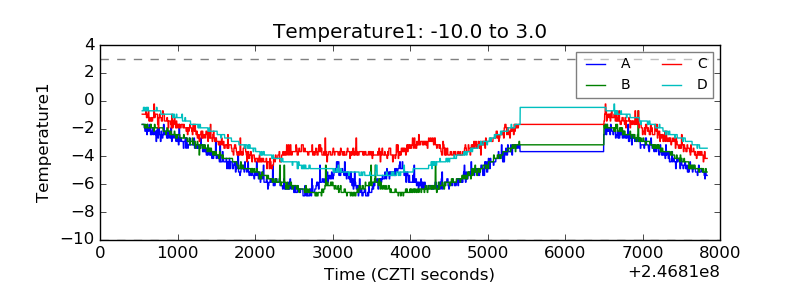 |
| Veto HV Monitor | 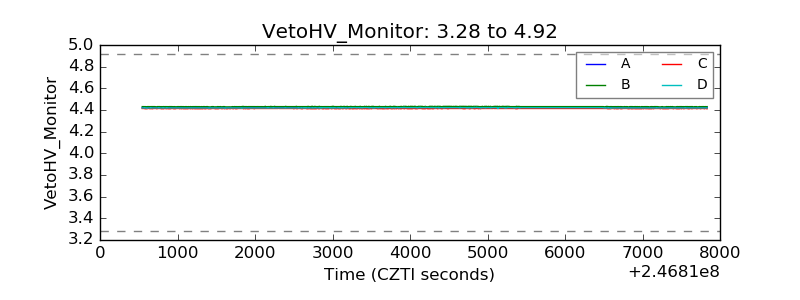 |
| Veto LLD | 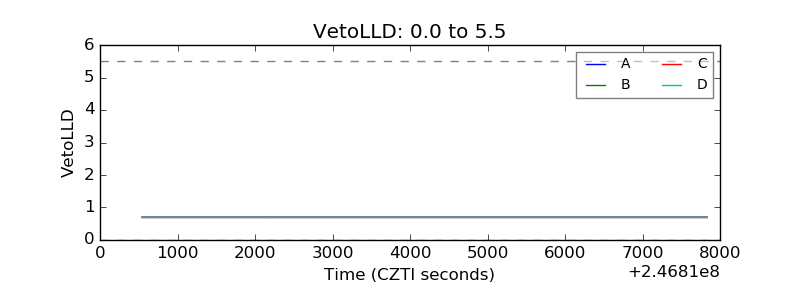 |
| Alpha Counter | 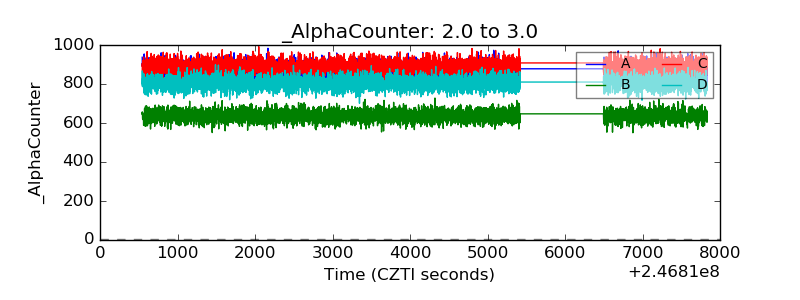 |
| _CPM_Rate | 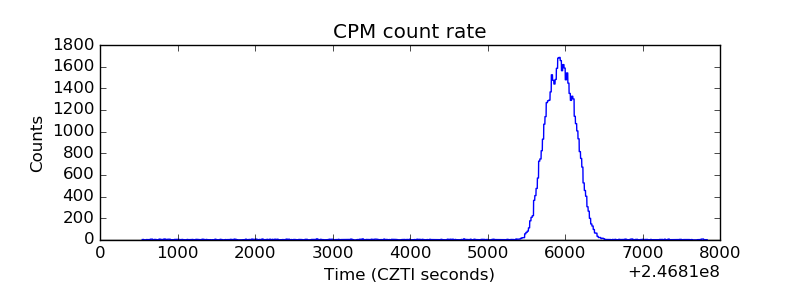 |
| CZT Counter | 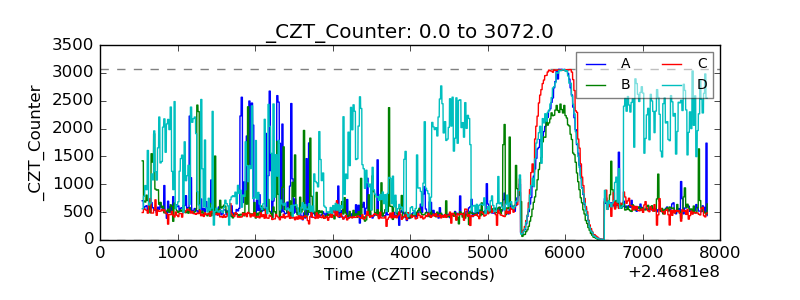 |
| +2.5 Volts monitor |  |
| +5 Volts monitor |  |
| _ROLL_ROT | 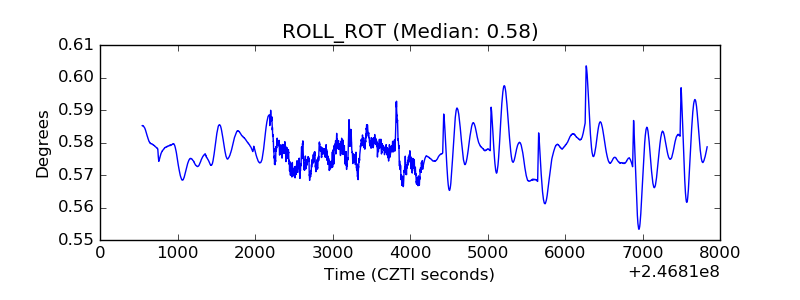 |
| _Roll_DEC | 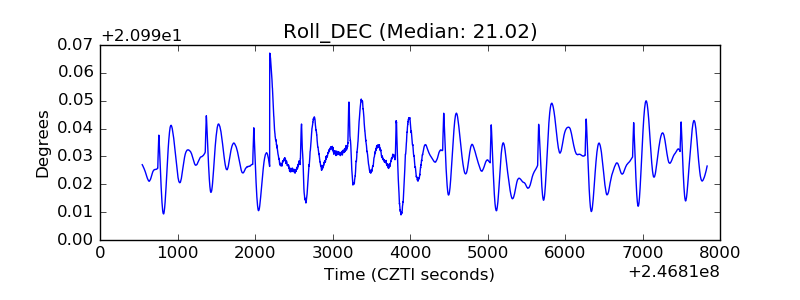 |
| _Roll_RA | 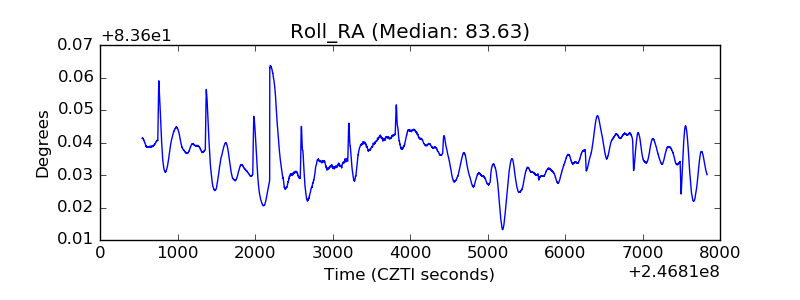 |
| Veto Counter | 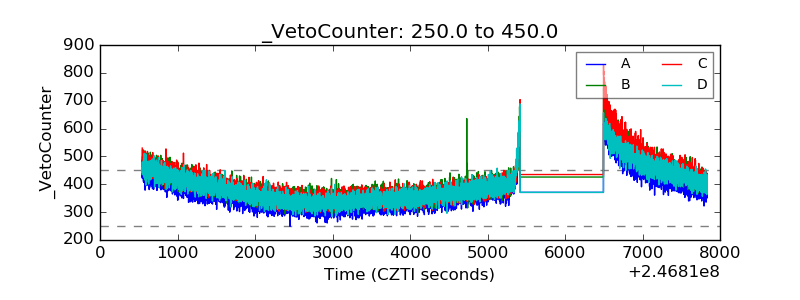 |