| Param | Original file | Final file |
|---|---|---|
| Filename | modeM0/AS1C03_012T01_9000001642_11260cztM0_level2.evt | modeM0/AS1C03_012T01_9000001642_11260cztM0_level2_quad_clean.evt |
| Size (bytes) | 601,580,160 | 108,106,560 |
| Size | 573.7 MB | 103.1 MB |
| Events in quadrant A | 5,139,992 | 704,505 |
| Events in quadrant B | 4,308,188 | 741,288 |
| Events in quadrant C | 3,327,997 | 719,714 |
| Events in quadrant D | 5,005,337 | 657,588 |
| Mode SS | |||
|---|---|---|---|
| Quadrant | BADHDUFLAG | Total packets | Discarded packets |
| A | 0 | 134 | 0 |
| B | 0 | 134 | 0 |
| C | 0 | 134 | 0 |
| D | 0 | 134 | 0 |
| Mode M9 | |||
|---|---|---|---|
| Quadrant | BADHDUFLAG | Total packets | Discarded packets |
| A | 0 | 25 | 0 |
| B | 0 | 25 | 0 |
| C | 0 | 25 | 0 |
| D | 0 | 25 | 0 |
| Mode M0 | |||
|---|---|---|---|
| Quadrant | BADHDUFLAG | Total packets | Discarded packets |
| A | 0 | 19796 | 3 |
| B | 0 | 17179 | 2 |
| C | 0 | 13991 | 2 |
| D | 0 | 19523 | 2 |
| Quadrant | Total seconds | Saturated seconds | Saturation percentage |
|---|---|---|---|
| A | 6463 | 444 | 6.869875% |
| B | 6463 | 280 | 4.332353% |
| C | 6463 | 38 | 0.587962% |
| D | 6463 | 316 | 4.889370% |
Noise dominated data is calculated using 1-second bins in cleaned event files. If a bin has >2000 counts, and if more than 50% of those come from <1% of pixels, then it is considered to be noise-dominated and hence unusable.
| Quadrant | # 1 sec bins | Bins with >0 counts | Bins with >2000 counts | High rate bins dominated by noise | Noise dominated (total time) | Noise dominated (detector-on time) | Marked lightcurve |
|---|---|---|---|---|---|---|---|
| A | 9028 | 6464 | 239 | 239 | 2.65% | 3.70% | 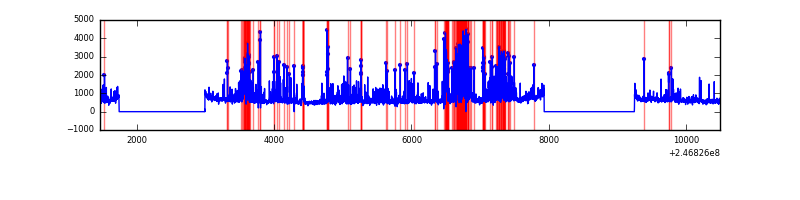 |
| B | 9028 | 6465 | 115 | 115 | 1.27% | 1.78% | 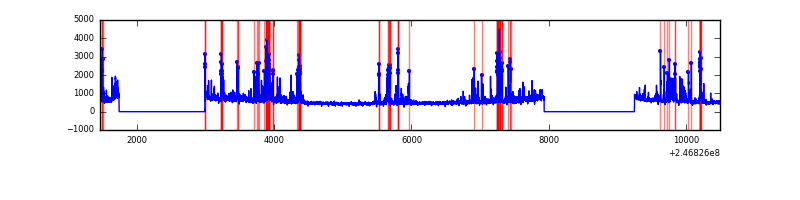 |
| C | 9028 | 6465 | 20 | 20 | 0.22% | 0.31% | 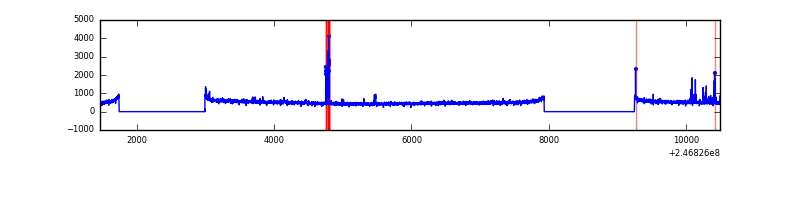 |
| D | 9028 | 6465 | 213 | 213 | 2.36% | 3.29% | 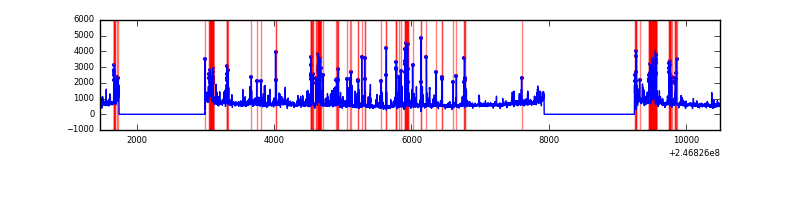 |
Top three noisy pixels from each quadrant. If the there are fewer than three noisy pixels in the level2.evt file, extra rows are filled as -1
| Pixel properties | Quadrant properties | ||||||
|---|---|---|---|---|---|---|---|
| Quadrant | DetID | PixID | Counts | Sigma | Mean | Median | Sigma |
| A | 8 | 5 | 979824 | 5910.19 | 818 | 807 | 165.6 |
| A | 14 | 238 | 558830 | 3368.71 | 818 | 807 | 165.6 |
| A | 1 | 162 | 83217 | 497.5 | 818 | 807 | 165.6 |
| B | 4 | 239 | 778829 | 4974.39 | 842 | 825 | 156.4 |
| B | 11 | 51 | 118226 | 750.64 | 842 | 825 | 156.4 |
| B | 15 | 204 | 34434 | 214.89 | 842 | 825 | 156.4 |
| C | 9 | 204 | 80070 | 419.06 | 821 | 830 | 189.1 |
| C | 5 | 239 | 33218 | 171.28 | 821 | 830 | 189.1 |
| C | 12 | 4 | 11384 | 55.81 | 821 | 830 | 189.1 |
| D | 8 | 195 | 719248 | 3834.37 | 791 | 774 | 187.4 |
| D | 10 | 199 | 241639 | 1285.45 | 791 | 774 | 187.4 |
| D | 13 | 249 | 231248 | 1230.0 | 791 | 774 | 187.4 |
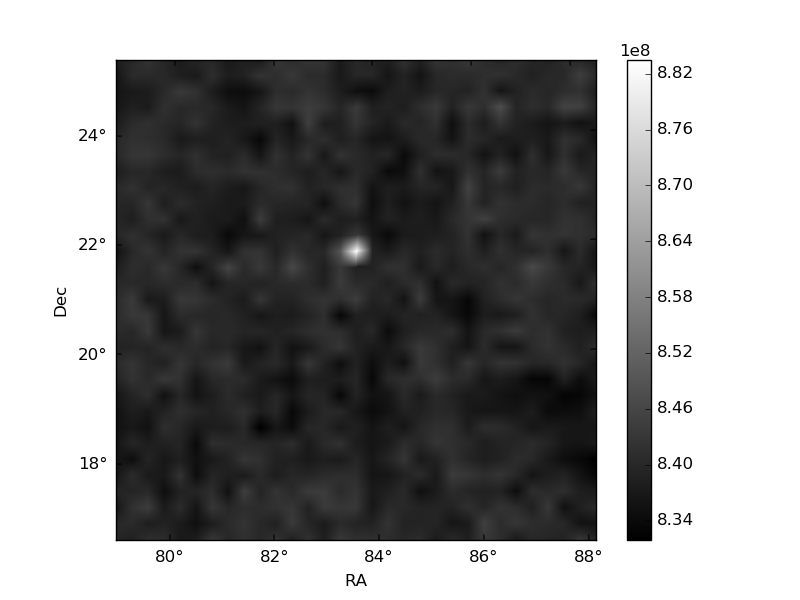
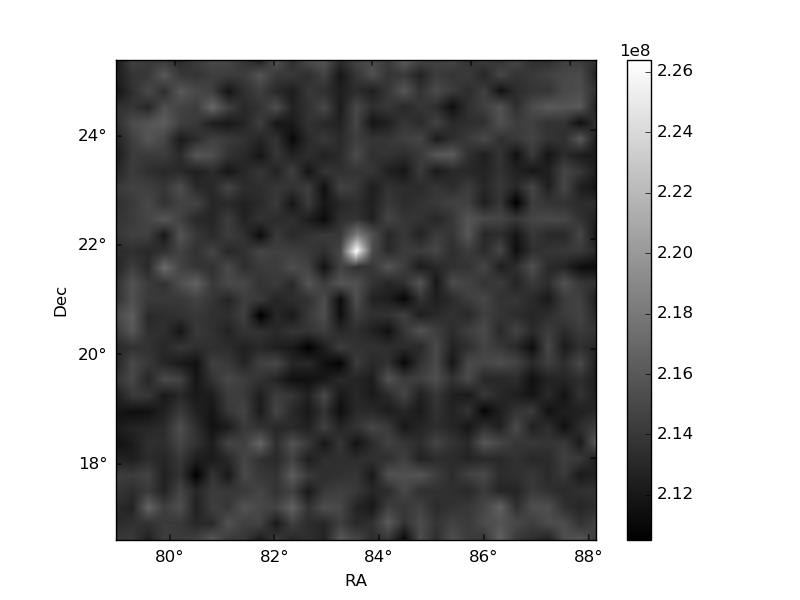
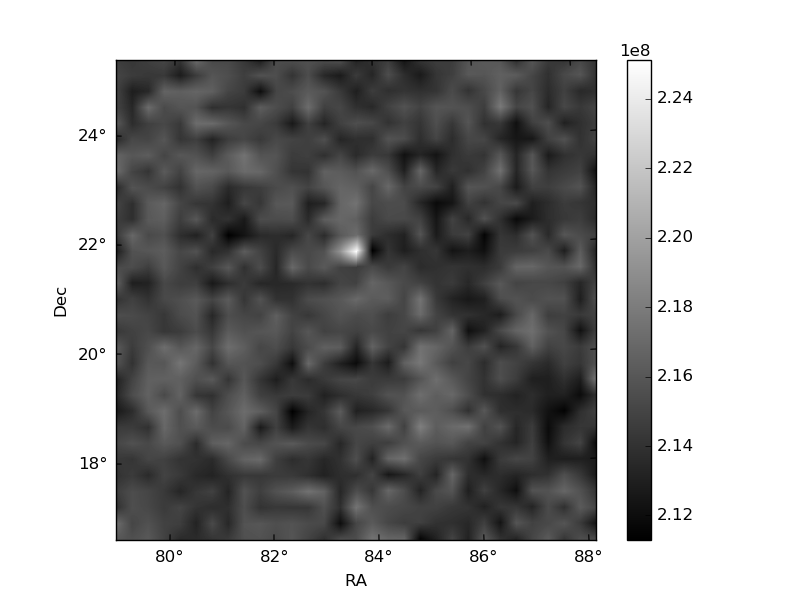
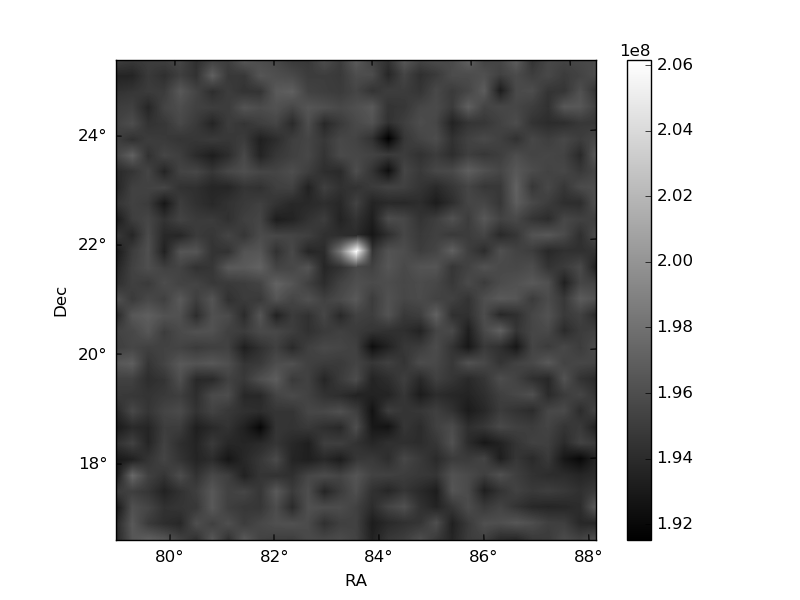
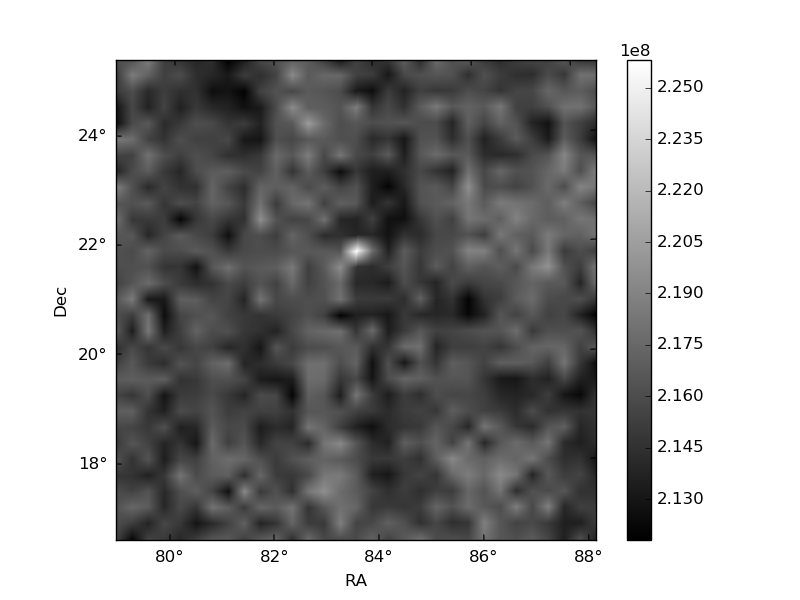
Histogram calculated using DETX and DETY for each event in the final _common_clean file
| Quadrant A | 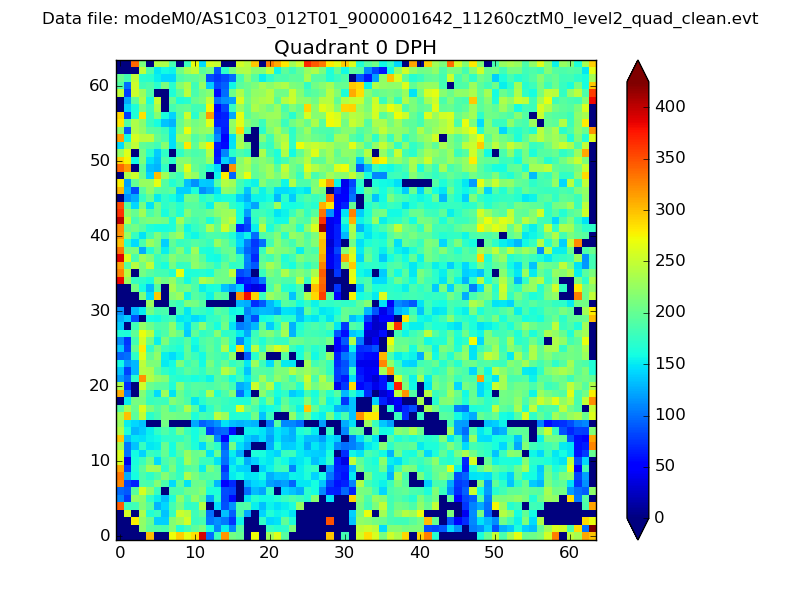 |
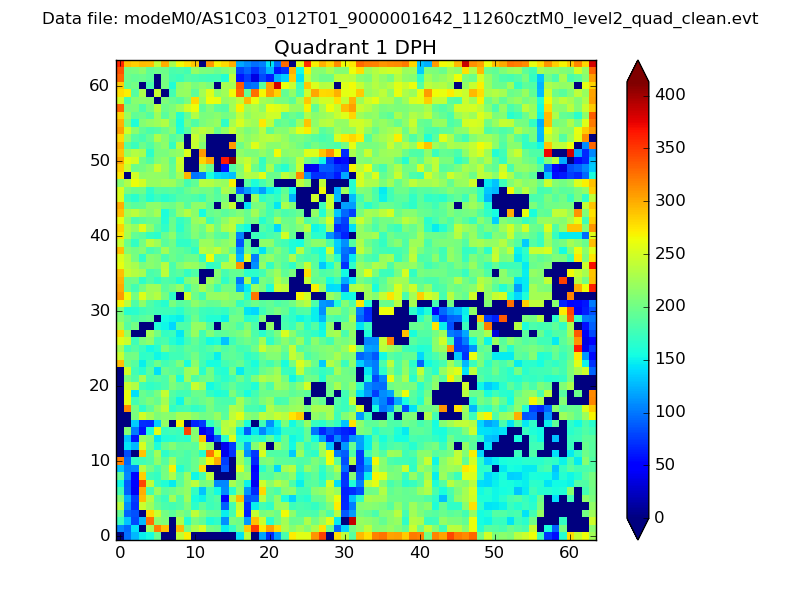 |
Quadrant B |
|---|---|---|---|
| Quadrant D | 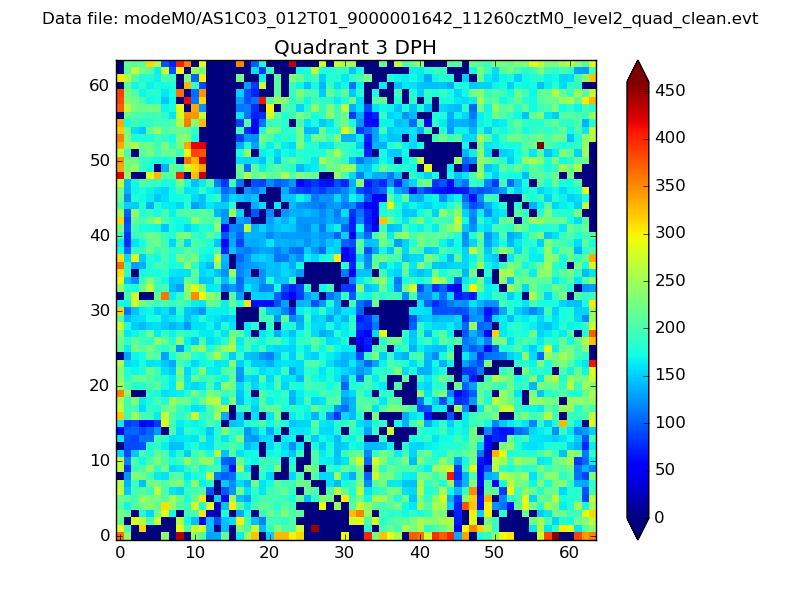 |
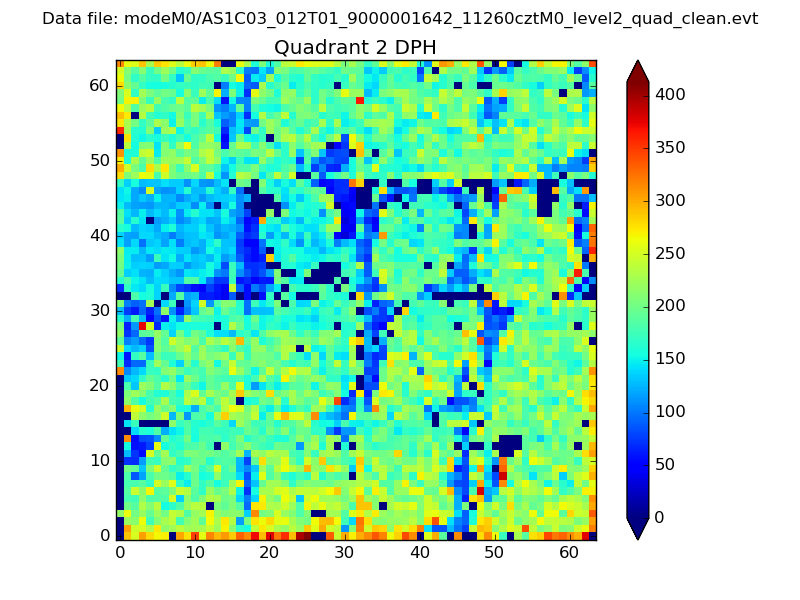 |
Quadrant C |
| Plot type | Count rate plots | Images |
|---|---|---|
| Comparison with Poisson distribution Blue bars denote a histogram of data divided into 1 sec bins. Red curve is a Poisson curve with rate = median count rate of data. |
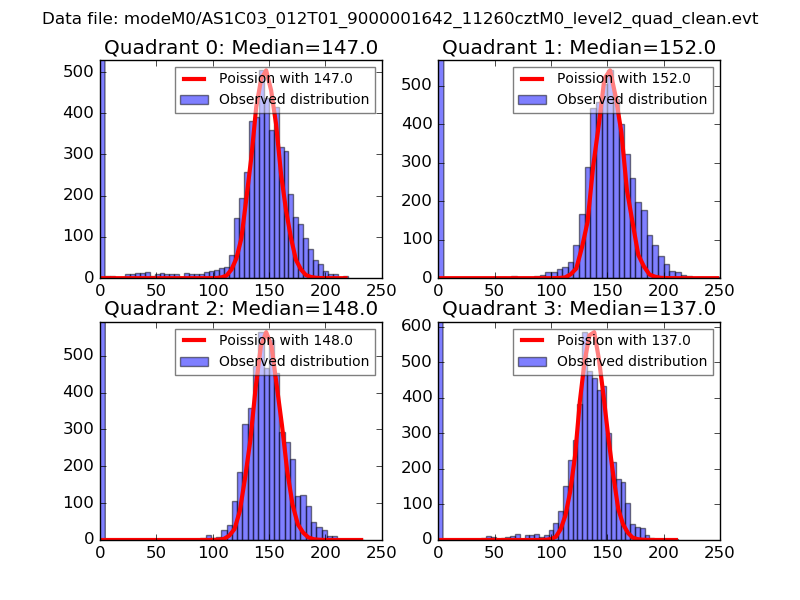 |
 |
| Quadrant-wise count rates Data is divided into 100 sec bins |
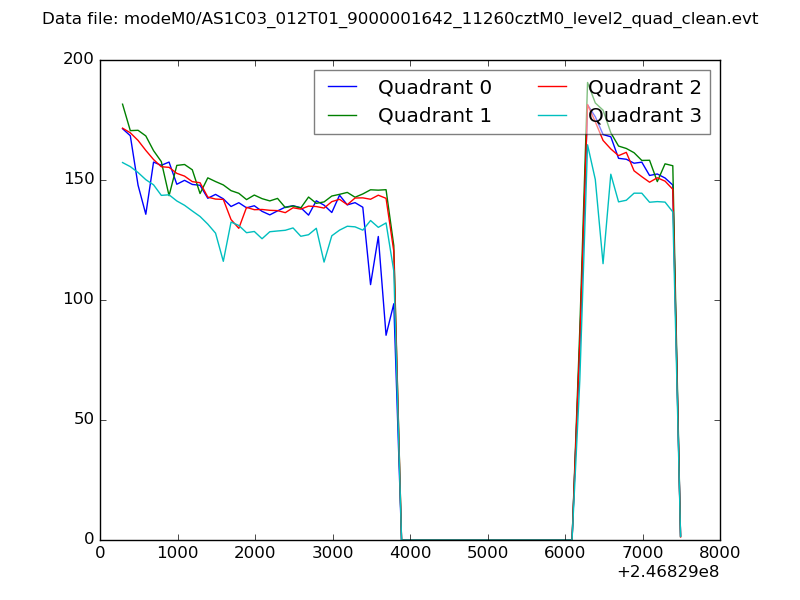 |
|
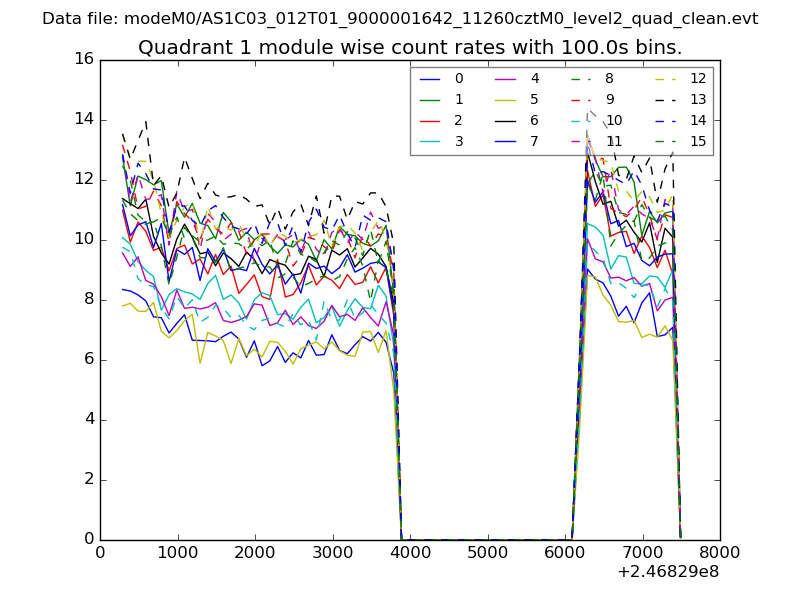
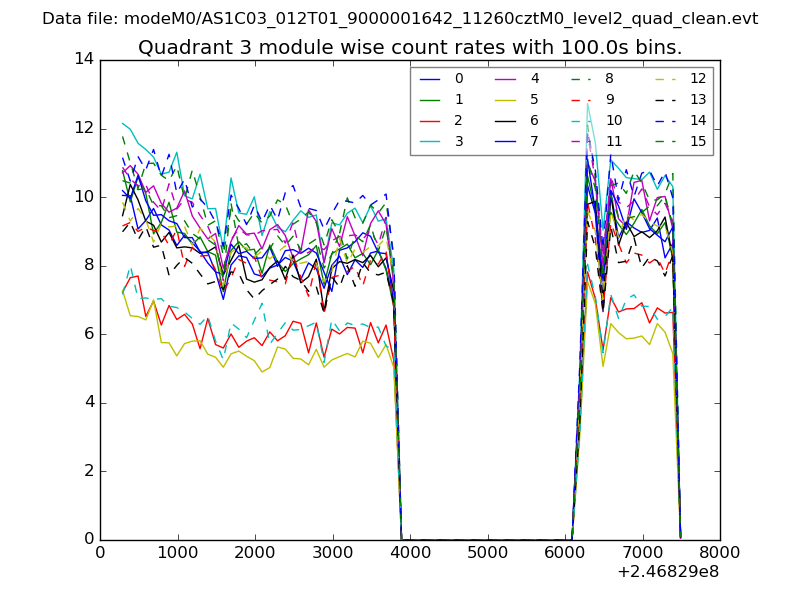
| Module-wise count rates for Quadrant A Data is divided into 100 sec bins |
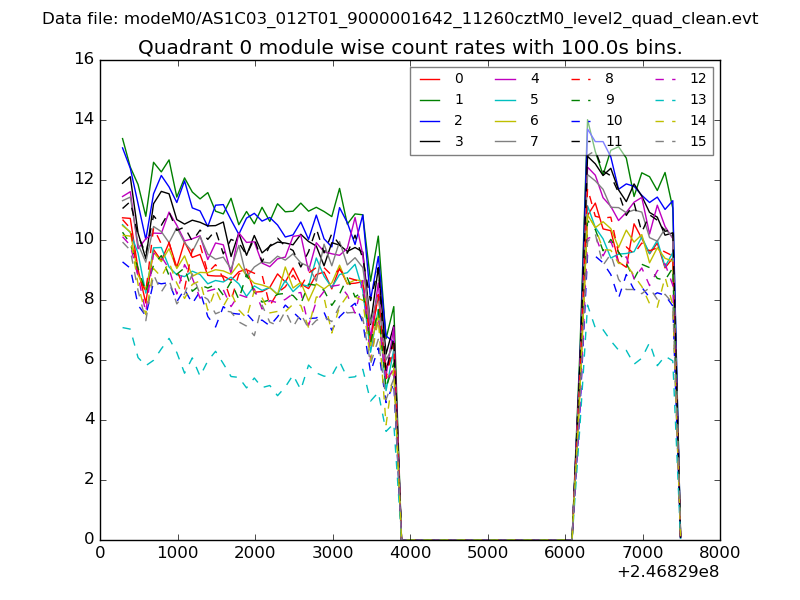 |
 |
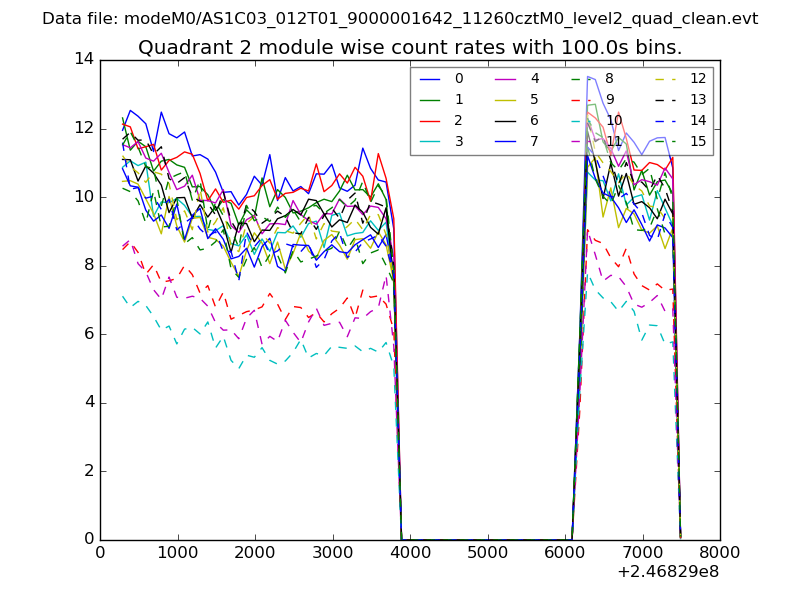
| Module-wise count rates for Quadrant B Data is divided into 100 sec bins |
 |
 |
| Module-wise count rates for Quadrant C Data is divided into 100 sec bins |
 |
 |
| Module-wise count rates for Quadrant D Data is divided into 100 sec bins |
 |
 |
| Parameter | Plot |
|---|---|
| CZT HV Monitor | 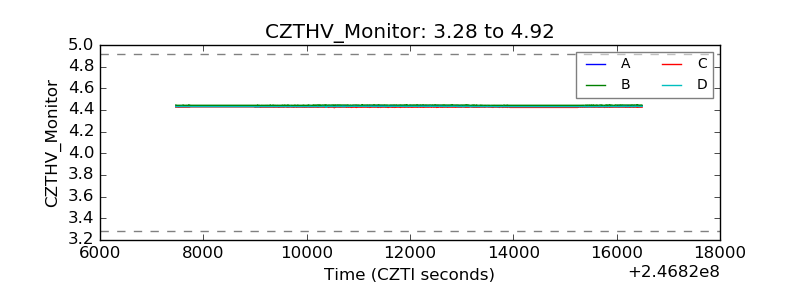 |
| D_VDD | 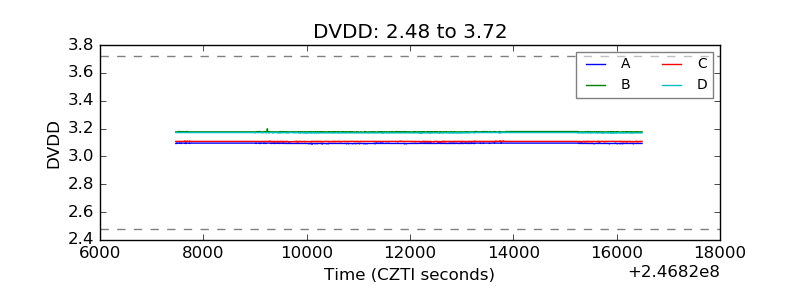 |
| Temperature 1 | 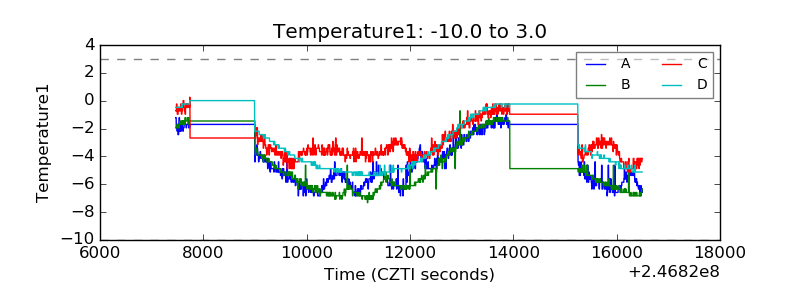 |
| Veto HV Monitor | 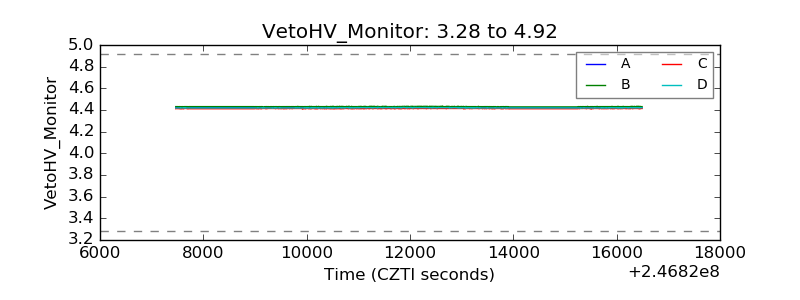 |
| Veto LLD | 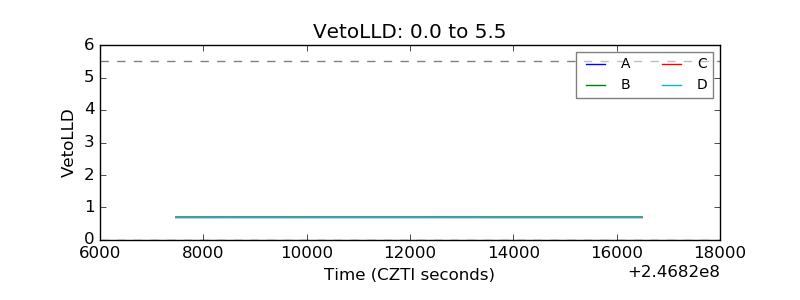 |
| Alpha Counter | 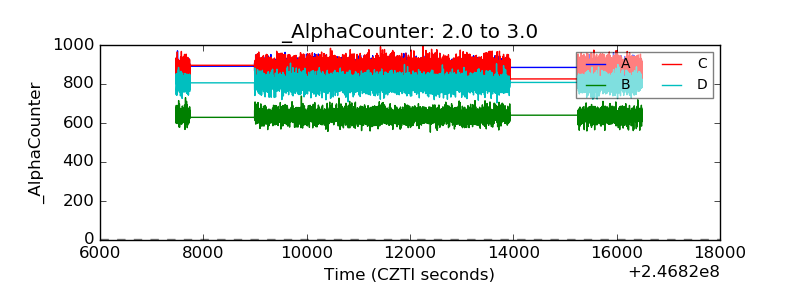 |
| _CPM_Rate | 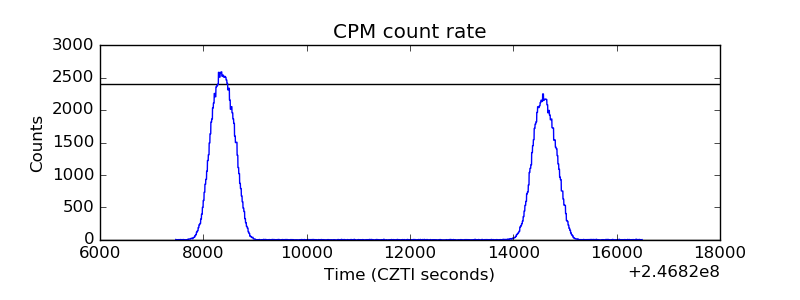 |
| CZT Counter | 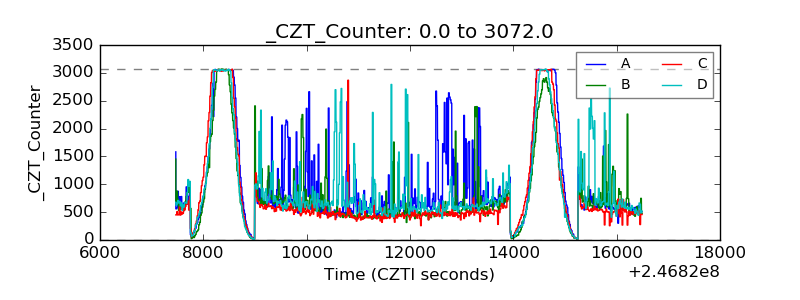 |
| +2.5 Volts monitor | 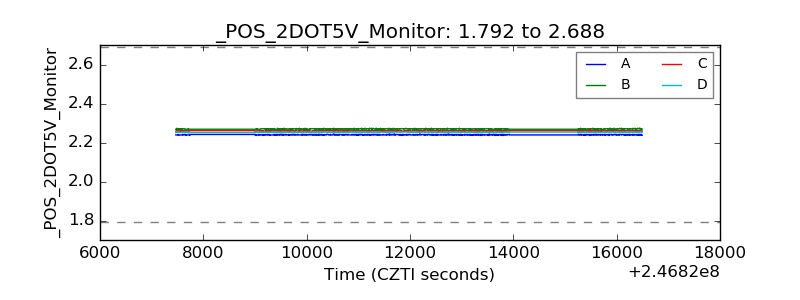 |
| +5 Volts monitor |  |
| _ROLL_ROT | 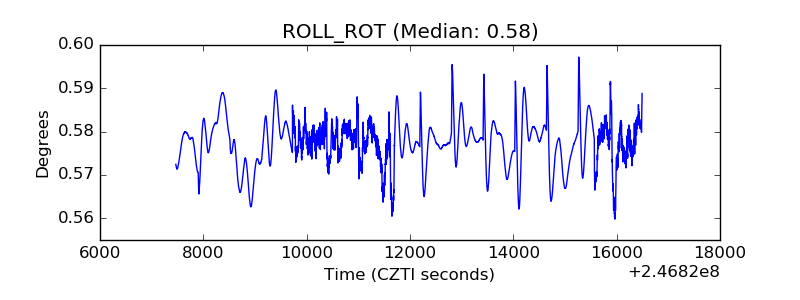 |
| _Roll_DEC | 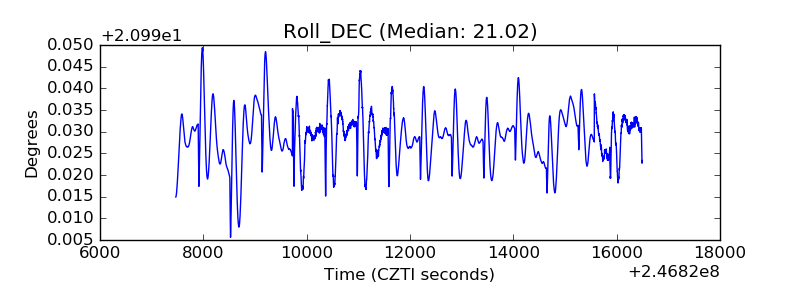 |
| _Roll_RA | 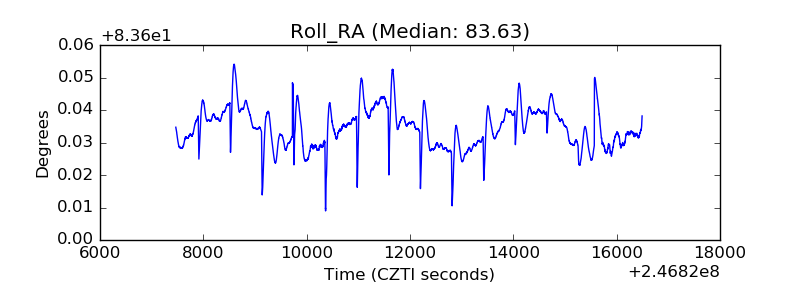 |
| Veto Counter | 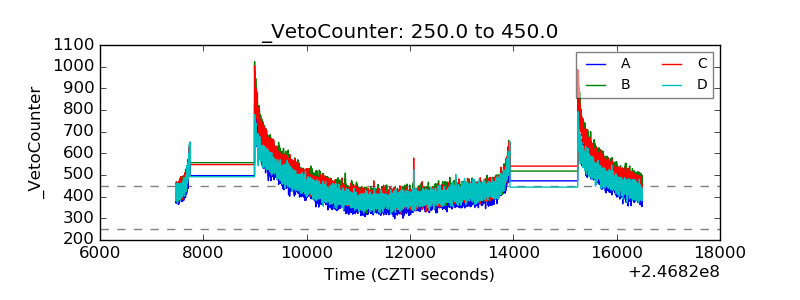 |