| Param | Original file | Final file |
|---|---|---|
| Filename | modeM0/AS1C03_012T01_9000001642_11262cztM0_level2.evt | modeM0/AS1C03_012T01_9000001642_11262cztM0_level2_quad_clean.evt |
| Size (bytes) | 507,522,240 | 96,888,960 |
| Size | 484.0 MB | 92.4 MB |
| Events in quadrant A | 3,933,510 | 644,807 |
| Events in quadrant B | 3,797,520 | 664,535 |
| Events in quadrant C | 2,888,680 | 639,381 |
| Events in quadrant D | 4,358,153 | 580,727 |
| Mode SS | |||
|---|---|---|---|
| Quadrant | BADHDUFLAG | Total packets | Discarded packets |
| A | 0 | 118 | 0 |
| B | 0 | 118 | 0 |
| C | 0 | 118 | 0 |
| D | 0 | 118 | 0 |
| Mode M9 | |||
|---|---|---|---|
| Quadrant | BADHDUFLAG | Total packets | Discarded packets |
| A | 0 | 22 | 0 |
| B | 0 | 22 | 0 |
| C | 0 | 22 | 0 |
| D | 0 | 23 | 0 |
| Mode M0 | |||
|---|---|---|---|
| Quadrant | BADHDUFLAG | Total packets | Discarded packets |
| A | 0 | 15494 | 2 |
| B | 0 | 15095 | 2 |
| C | 0 | 12287 | 2 |
| D | 0 | 16794 | 2 |
| Quadrant | Total seconds | Saturated seconds | Saturation percentage |
|---|---|---|---|
| A | 5789 | 150 | 2.591121% |
| B | 5789 | 243 | 4.197616% |
| C | 5789 | 19 | 0.328209% |
| D | 5789 | 271 | 4.681292% |
Noise dominated data is calculated using 1-second bins in cleaned event files. If a bin has >2000 counts, and if more than 50% of those come from <1% of pixels, then it is considered to be noise-dominated and hence unusable.
| Quadrant | # 1 sec bins | Bins with >0 counts | Bins with >2000 counts | High rate bins dominated by noise | Noise dominated (total time) | Noise dominated (detector-on time) | Marked lightcurve |
|---|---|---|---|---|---|---|---|
| A | 7084 | 5790 | 86 | 86 | 1.21% | 1.49% | 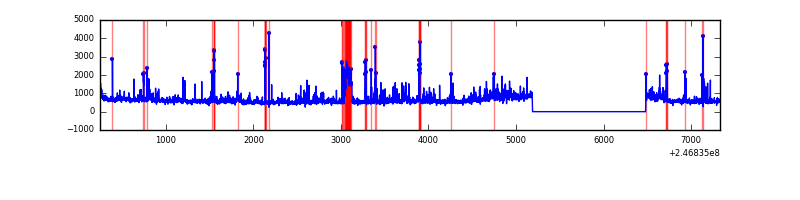 |
| B | 7084 | 5790 | 89 | 89 | 1.26% | 1.54% | 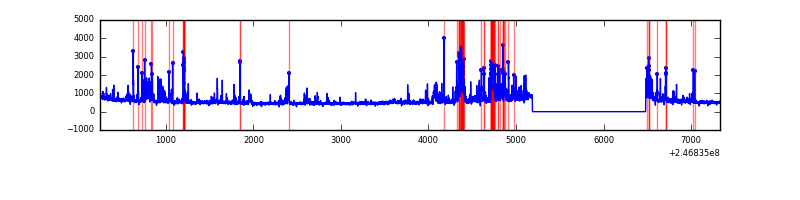 |
| C | 7084 | 5790 | 5 | 5 | 0.07% | 0.09% | 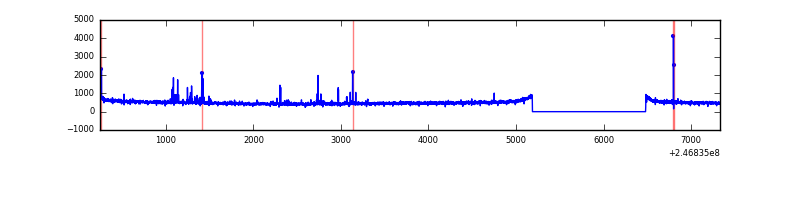 |
| D | 7084 | 5790 | 193 | 193 | 2.72% | 3.33% | 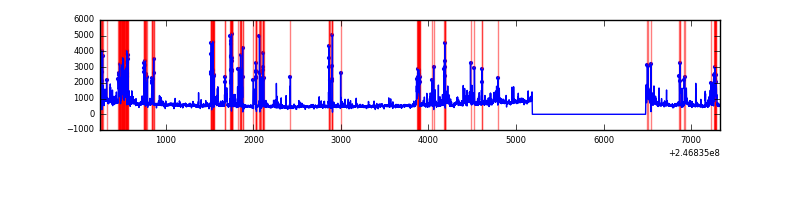 |
Top three noisy pixels from each quadrant. If the there are fewer than three noisy pixels in the level2.evt file, extra rows are filled as -1
| Pixel properties | Quadrant properties | ||||||
|---|---|---|---|---|---|---|---|
| Quadrant | DetID | PixID | Counts | Sigma | Mean | Median | Sigma |
| A | 8 | 5 | 357896 | 2396.99 | 735 | 724 | 149.0 |
| A | 13 | 251 | 324876 | 2175.39 | 735 | 724 | 149.0 |
| A | 14 | 238 | 207793 | 1389.65 | 735 | 724 | 149.0 |
| B | 4 | 239 | 721748 | 5219.63 | 740 | 726 | 138.1 |
| B | 15 | 204 | 64505 | 461.71 | 740 | 726 | 138.1 |
| B | 11 | 51 | 62490 | 447.12 | 740 | 726 | 138.1 |
| C | 5 | 239 | 66694 | 399.02 | 719 | 728 | 165.3 |
| C | 9 | 204 | 10064 | 56.47 | 719 | 728 | 165.3 |
| C | 12 | 4 | 8582 | 47.51 | 719 | 728 | 165.3 |
| D | 8 | 195 | 576209 | 3478.21 | 692 | 677 | 165.5 |
| D | 10 | 253 | 324011 | 1954.06 | 692 | 677 | 165.5 |
| D | 12 | 157 | 181234 | 1091.19 | 692 | 677 | 165.5 |
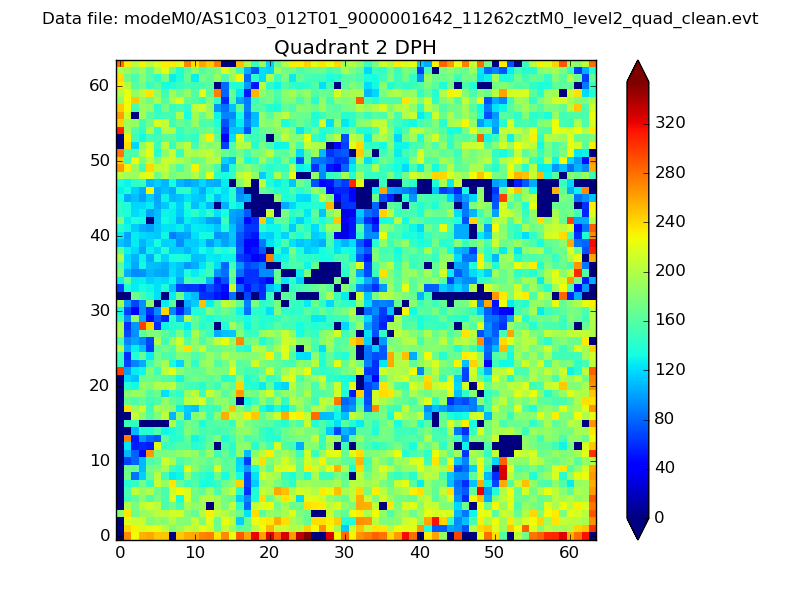
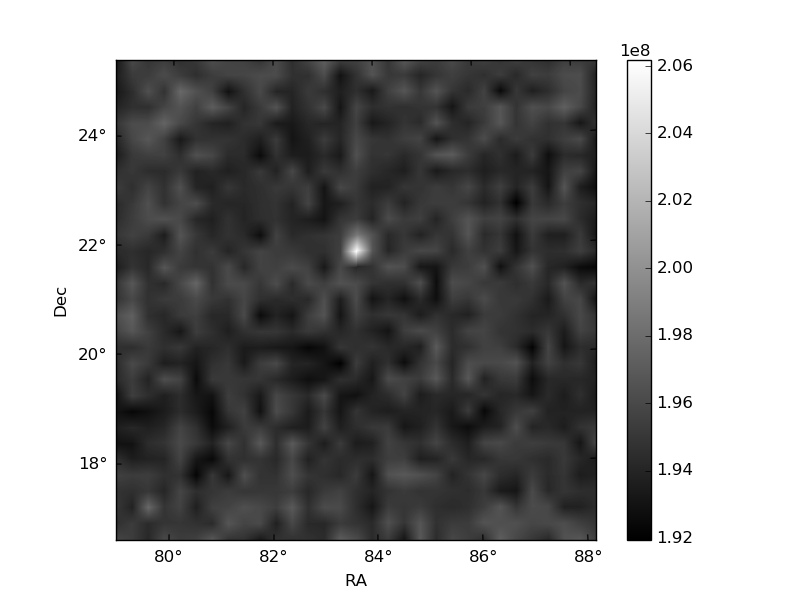
Histogram calculated using DETX and DETY for each event in the final _common_clean file
| Quadrant A | 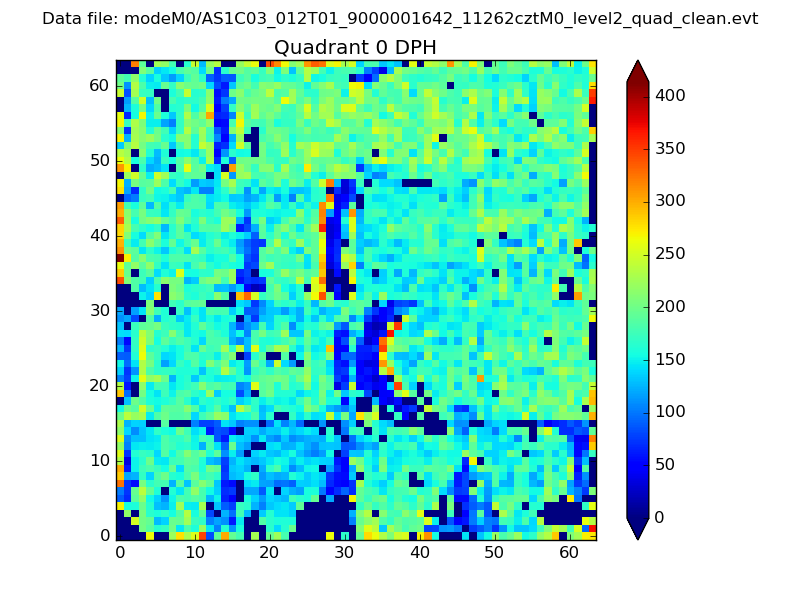 |
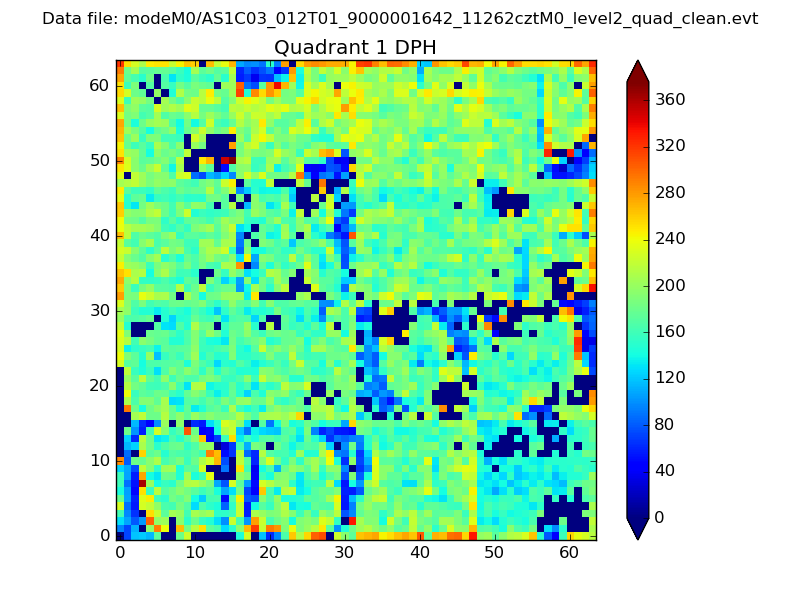 |
Quadrant B |
|---|---|---|---|
| Quadrant D | 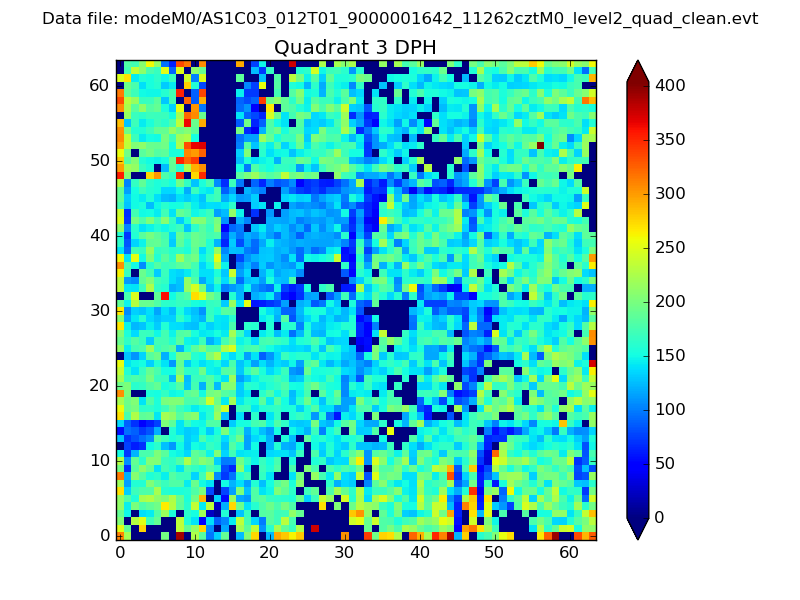 |
 |
Quadrant C |
| Plot type | Count rate plots | Images |
|---|---|---|
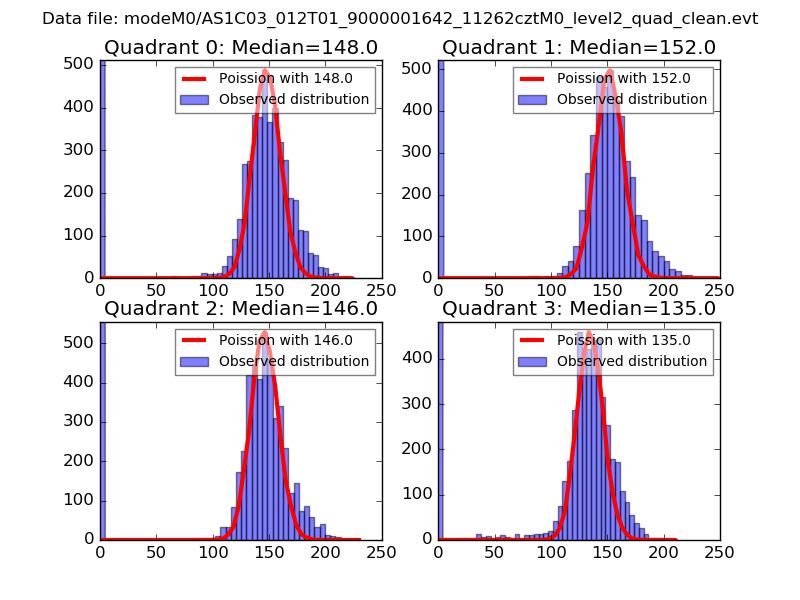
| Comparison with Poisson distribution Blue bars denote a histogram of data divided into 1 sec bins. Red curve is a Poisson curve with rate = median count rate of data. |
 |
 |
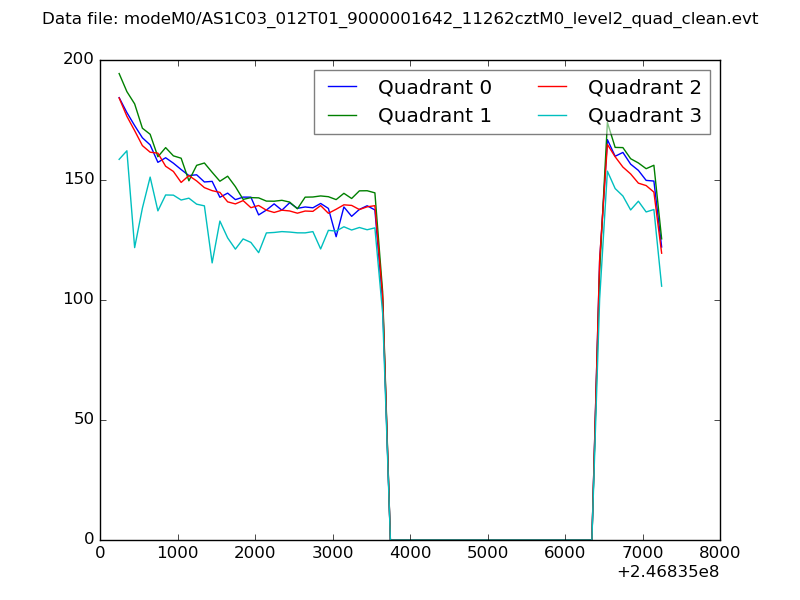
| Quadrant-wise count rates Data is divided into 100 sec bins |
 |
|
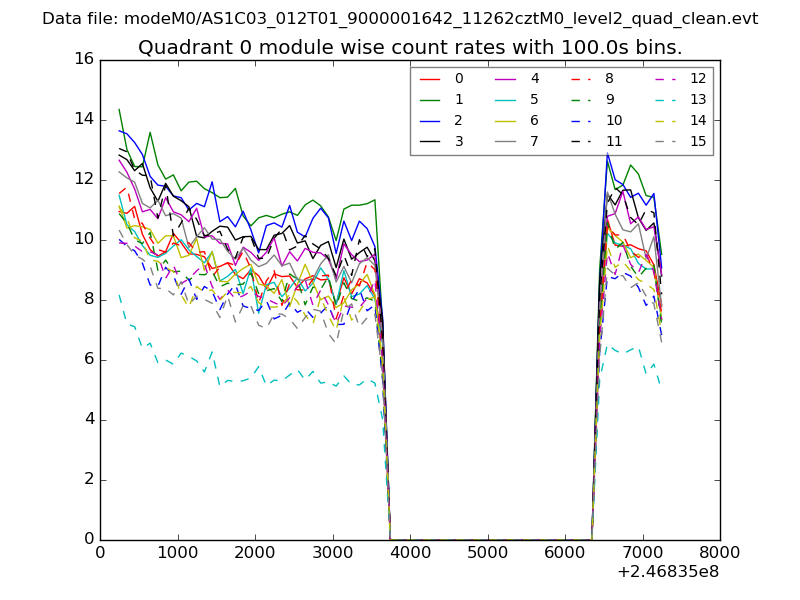
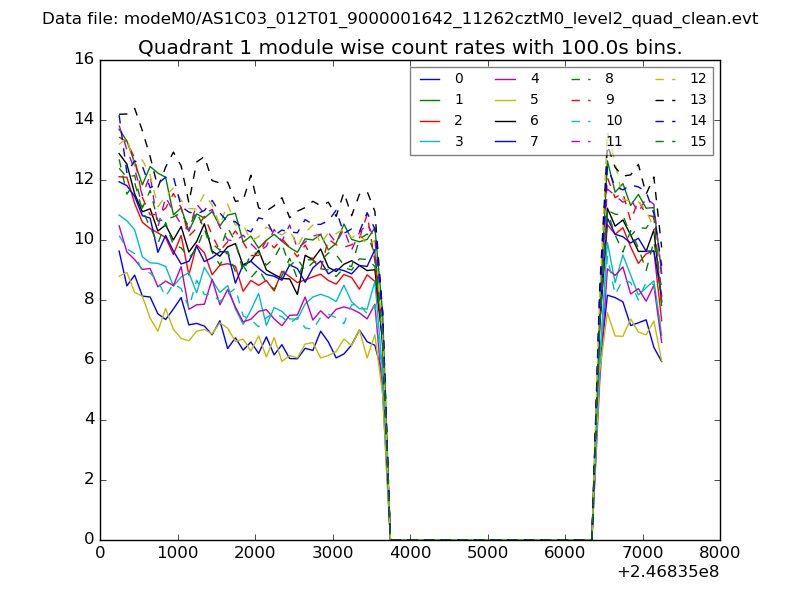
| Module-wise count rates for Quadrant A Data is divided into 100 sec bins |
 |
 |
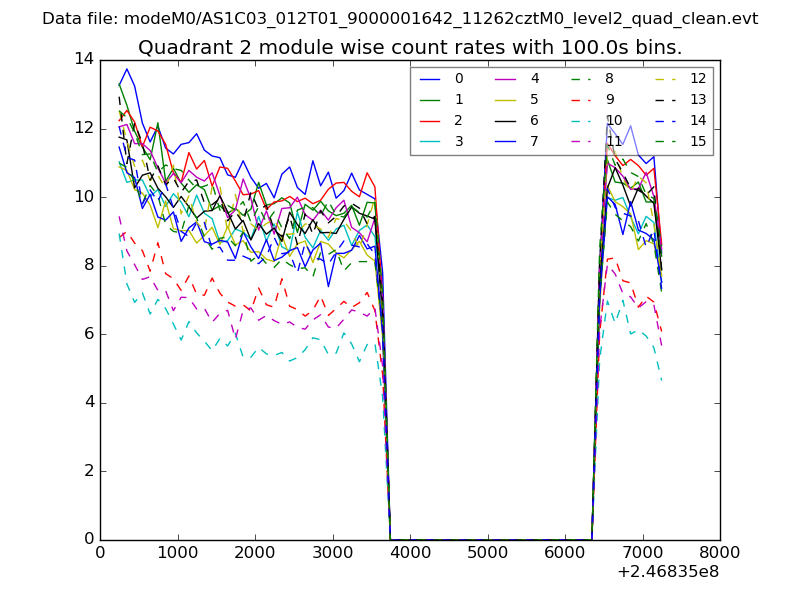
| Module-wise count rates for Quadrant B Data is divided into 100 sec bins |
 |
 |
| Module-wise count rates for Quadrant C Data is divided into 100 sec bins |
 |
 |
| Module-wise count rates for Quadrant D Data is divided into 100 sec bins |
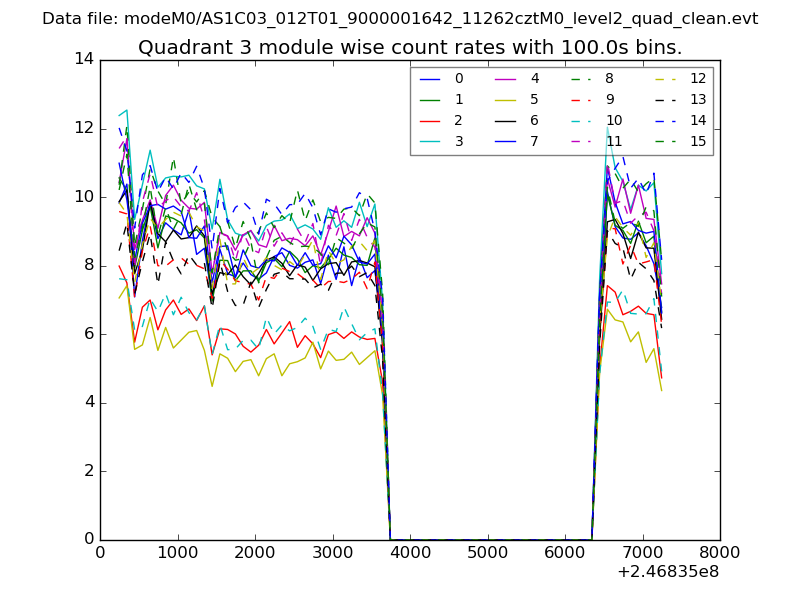 |
 |
| Parameter | Plot |
|---|---|
| CZT HV Monitor | 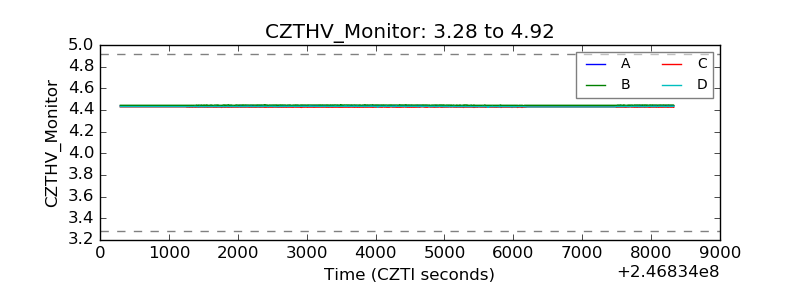 |
| D_VDD | 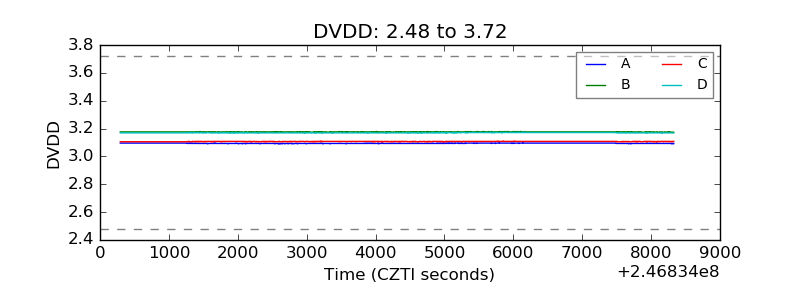 |
| Temperature 1 | 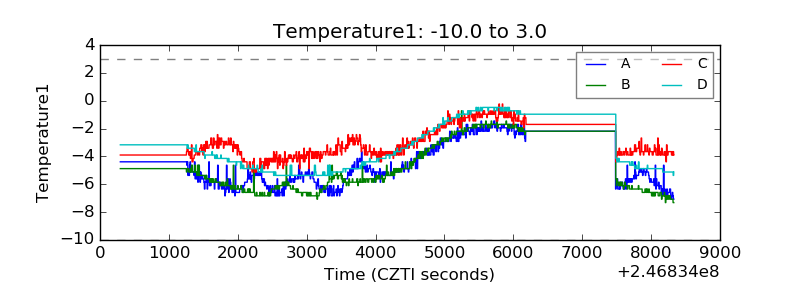 |
| Veto HV Monitor | 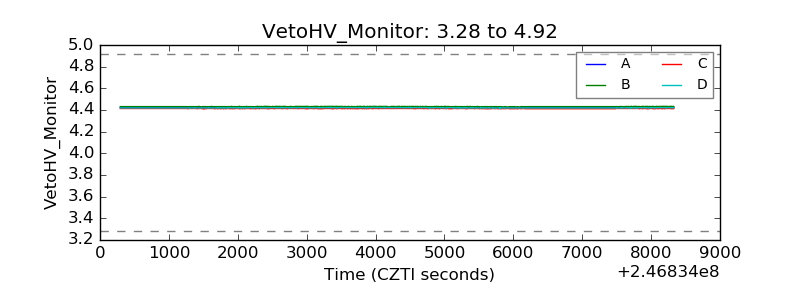 |
| Veto LLD | 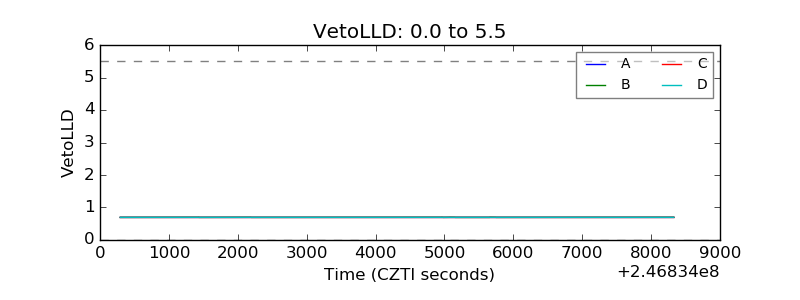 |
| Alpha Counter | 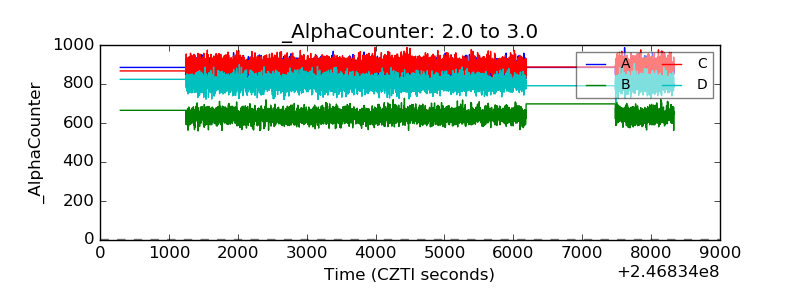 |
| _CPM_Rate | 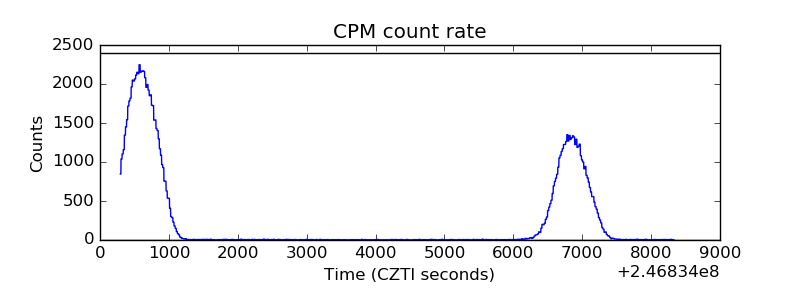 |
| CZT Counter | 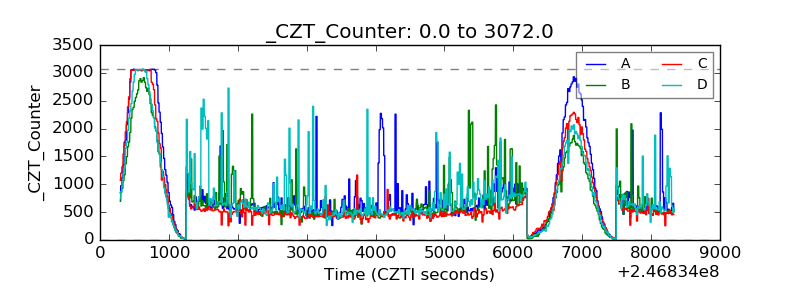 |
| +2.5 Volts monitor |  |
| +5 Volts monitor |  |
| _ROLL_ROT | 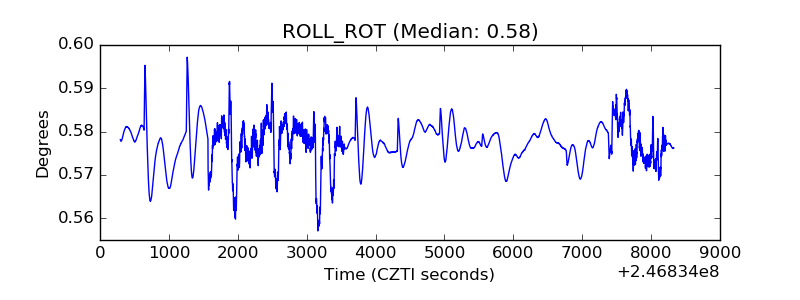 |
| _Roll_DEC | 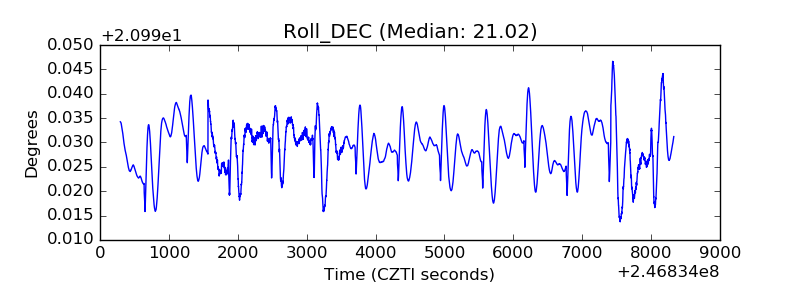 |
| _Roll_RA |  |
| Veto Counter | 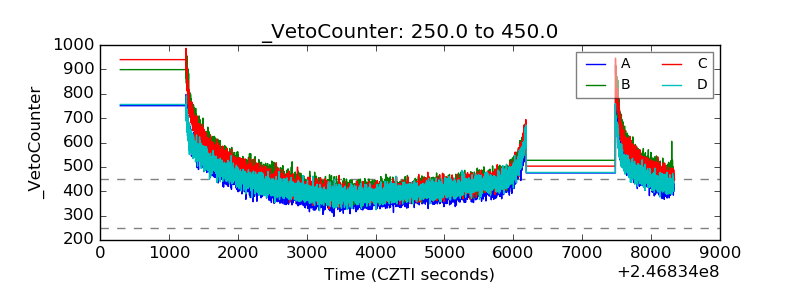 |