| Param | Original file | Final file |
|---|---|---|
| Filename | modeM0/AS1A04_044T01_9000001648cztM0_level2.fits | modeM0/AS1A04_044T01_9000001648cztM0_level2_quad_clean.evt |
| Size (bytes) | 617,123,520 | 617,209,920 |
| Size | 588.5 MB | 588.6 MB |
| Events in quadrant A | 3,673,364 | 3,674,755 |
| Events in quadrant B | 3,608,908 | 3,862,788 |
| Events in quadrant C | 3,785,794 | 3,618,568 |
| Events in quadrant D | 2,987,844 | 2,909,674 |
| Mode SS | |||
|---|---|---|---|
| Quadrant | BADHDUFLAG | Total packets | Discarded packets |
| A | 0 | 1374 | 0 |
| B | 0 | 1374 | 0 |
| C | 0 | 1374 | 0 |
| D | 0 | 1374 | 0 |
| Mode M9 | |||
|---|---|---|---|
| Quadrant | BADHDUFLAG | Total packets | Discarded packets |
| A | 0 | 109 | 0 |
| B | 0 | 109 | 0 |
| C | 0 | 109 | 0 |
| D | 0 | 109 | 0 |
| Mode M0 | |||
|---|---|---|---|
| Quadrant | BADHDUFLAG | Total packets | Discarded packets |
| A | 0 | 198447 | 0 |
| B | 0 | 186402 | 0 |
| C | 0 | 138271 | 0 |
| D | 0 | 237457 | 0 |
| Quadrant | Total seconds | Saturated seconds | Saturation percentage |
|---|---|---|---|
| A | 67448 | 5035 | 7.465010% |
| B | 67448 | 5131 | 7.607342% |
| C | 67448 | 444 | 0.658285% |
| D | 67448 | 8853 | 13.125667% |
Noise dominated data is calculated using 1-second bins in cleaned event files. If a bin has >2000 counts, and if more than 50% of those come from <1% of pixels, then it is considered to be noise-dominated and hence unusable.
| Quadrant | # 1 sec bins | Bins with >0 counts | Bins with >2000 counts | High rate bins dominated by noise | Noise dominated (total time) | Noise dominated (detector-on time) | Marked lightcurve |
|---|---|---|---|---|---|---|---|
| A | 78368 | 67382 | 0 | 0 | 0.00% | 0.00% |  |
| B | 78368 | 67443 | 0 | 0 | 0.00% | 0.00% |  |
| C | 78368 | 67448 | 0 | 0 | 0.00% | 0.00% |  |
| D | 78368 | 66895 | 0 | 0 | 0.00% | 0.00% |  |
Top three noisy pixels from each quadrant. If the there are fewer than three noisy pixels in the level2.evt file, extra rows are filled as -1
| Pixel properties | Quadrant properties | ||||||
|---|---|---|---|---|---|---|---|
| Quadrant | DetID | PixID | Counts | Sigma | Mean | Median | Sigma |
| A | 0 | 29 | 3488 | 10.61 | 957 | 892 | 244.7 |
| A | 7 | 110 | 3085 | 8.96 | 957 | 892 | 244.7 |
| A | 9 | 19 | 2703 | 7.4 | 957 | 892 | 244.7 |
| B | 2 | 9 | 3149 | 11.87 | 950 | 902 | 189.3 |
| B | 14 | 254 | 2404 | 7.93 | 950 | 902 | 189.3 |
| B | 5 | 225 | 2349 | 7.64 | 950 | 902 | 189.3 |
| C | 1 | 80 | 2800 | 7.13 | 999 | 926 | 262.8 |
| C | 1 | 81 | 2742 | 6.91 | 999 | 926 | 262.8 |
| C | 12 | 241 | 2623 | 6.46 | 999 | 926 | 262.8 |
| D | 3 | 14 | 2194 | 6.2 | 852 | 773 | 229.1 |
| D | 6 | 231 | 2170 | 6.1 | 852 | 773 | 229.1 |
| D | 7 | 5 | 2141 | 5.97 | 852 | 773 | 229.1 |
Histogram calculated using DETX and DETY for each event in the final _common_clean file
| Quadrant A | 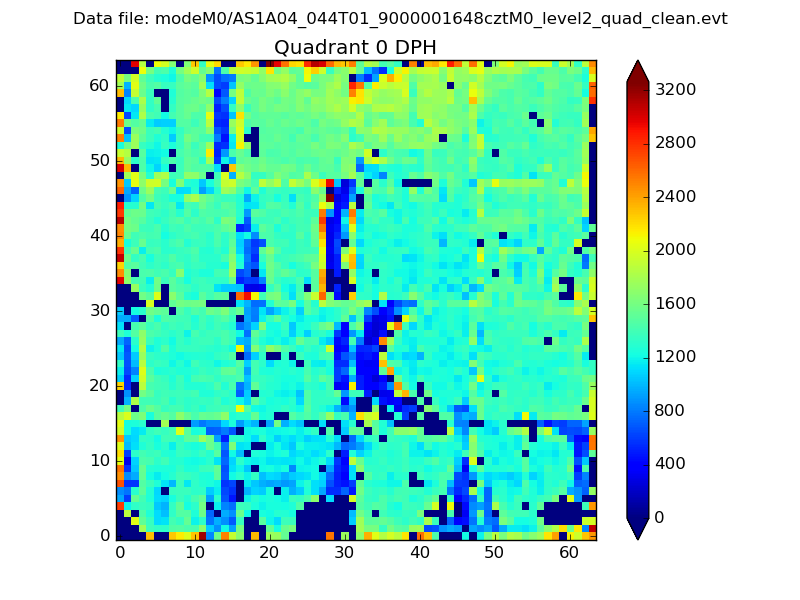 |
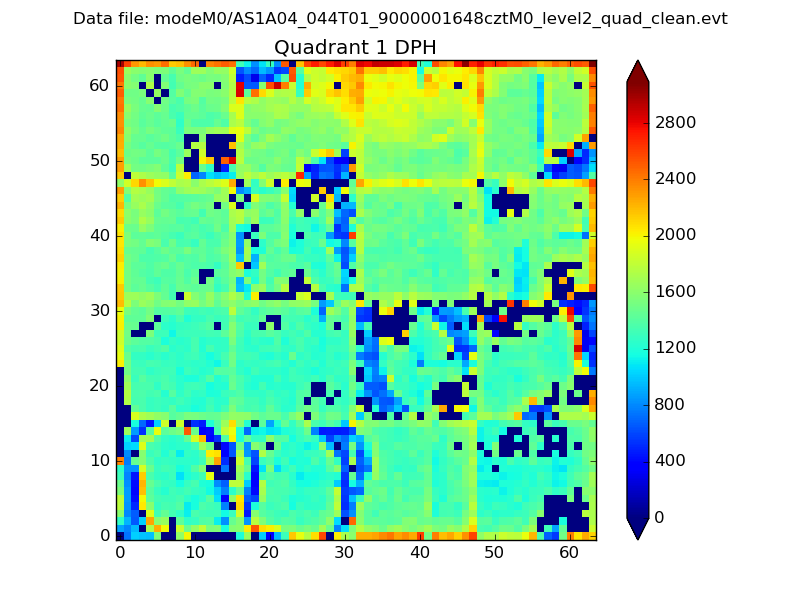 |
Quadrant B |
|---|---|---|---|
| Quadrant D |  |
 |
Quadrant C |
| Plot type | Count rate plots | Images |
|---|---|---|
| Comparison with Poisson distribution Blue bars denote a histogram of data divided into 1 sec bins. Red curve is a Poisson curve with rate = median count rate of data. |
 |
 |
| Quadrant-wise count rates Data is divided into 100 sec bins |
 |
|
| Module-wise count rates for Quadrant A Data is divided into 100 sec bins |
 |
 |
| Module-wise count rates for Quadrant B Data is divided into 100 sec bins |
 |
 |
| Module-wise count rates for Quadrant C Data is divided into 100 sec bins |
 |
 |
| Module-wise count rates for Quadrant D Data is divided into 100 sec bins |
 |
 |
| Parameter | Plot |
|---|---|
| CZT HV Monitor |  |
| D_VDD |  |
| Temperature 1 |  |
| Veto HV Monitor |  |
| Veto LLD |  |
| Alpha Counter |  |
| _CPM_Rate |  |
| CZT Counter |  |
| +2.5 Volts monitor |  |
| +5 Volts monitor |  |
| _ROLL_ROT |  |
| _Roll_DEC |  |
| _Roll_RA |  |
| Veto Counter |  |