| Param | Original file | Final file |
|---|---|---|
| Filename | modeM0/AS1A04_044T01_9000001648_11270cztM0_level2.evt | modeM0/AS1A04_044T01_9000001648_11270cztM0_level2_quad_clean.evt |
| Size (bytes) | 2,026,123,200 | 242,766,720 |
| Size | 1.9 GB | 231.5 MB |
| Events in quadrant A | 17,160,135 | 1,468,201 |
| Events in quadrant B | 14,053,639 | 1,548,003 |
| Events in quadrant C | 9,825,699 | 1,488,806 |
| Events in quadrant D | 18,851,948 | 1,343,102 |
| Mode SS | |||
|---|---|---|---|
| Quadrant | BADHDUFLAG | Total packets | Discarded packets |
| A | 0 | 446 | 0 |
| B | 0 | 446 | 0 |
| C | 0 | 446 | 0 |
| D | 0 | 446 | 0 |
| Mode M9 | |||
|---|---|---|---|
| Quadrant | BADHDUFLAG | Total packets | Discarded packets |
| A | 0 | 29 | 0 |
| B | 0 | 29 | 0 |
| C | 0 | 29 | 0 |
| D | 0 | 29 | 0 |
| Mode M0 | |||
|---|---|---|---|
| Quadrant | BADHDUFLAG | Total packets | Discarded packets |
| A | 0 | 65750 | 5 |
| B | 0 | 56191 | 4 |
| C | 0 | 44526 | 4 |
| D | 0 | 70803 | 4 |
| Quadrant | Total seconds | Saturated seconds | Saturation percentage |
|---|---|---|---|
| A | 21835 | 1534 | 7.025418% |
| B | 21835 | 1195 | 5.472865% |
| C | 21835 | 171 | 0.783146% |
| D | 21835 | 1910 | 8.747424% |
Noise dominated data is calculated using 1-second bins in cleaned event files. If a bin has >2000 counts, and if more than 50% of those come from <1% of pixels, then it is considered to be noise-dominated and hence unusable.
| Quadrant | # 1 sec bins | Bins with >0 counts | Bins with >2000 counts | High rate bins dominated by noise | Noise dominated (total time) | Noise dominated (detector-on time) | Marked lightcurve |
|---|---|---|---|---|---|---|---|
| A | 24755 | 21838 | 825 | 825 | 3.33% | 3.78% | 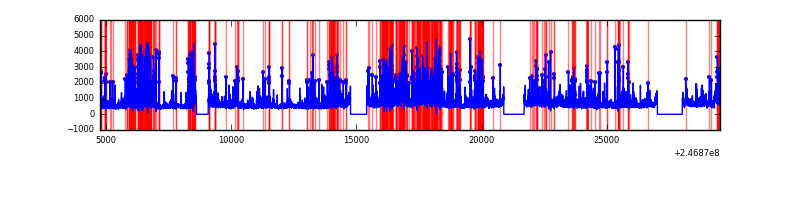 |
| B | 24755 | 21838 | 565 | 565 | 2.28% | 2.59% | 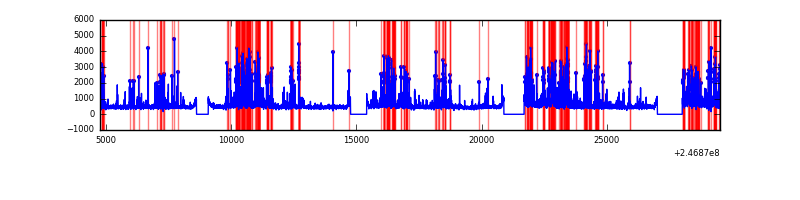 |
| C | 24755 | 21838 | 0 | 0 | 0.00% | 0.00% | 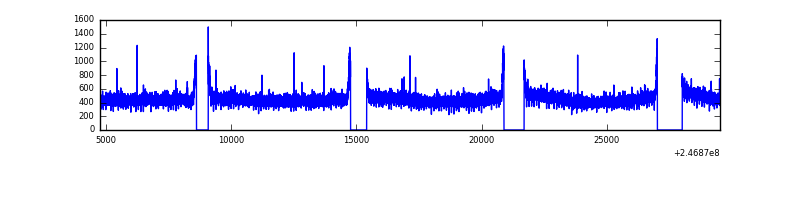 |
| D | 24755 | 21836 | 1385 | 1385 | 5.59% | 6.34% | 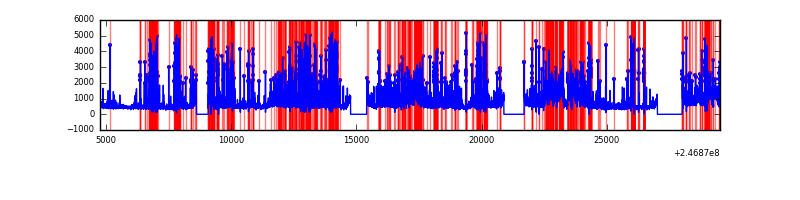 |
Top three noisy pixels from each quadrant. If the there are fewer than three noisy pixels in the level2.evt file, extra rows are filled as -1
| Pixel properties | Quadrant properties | ||||||
|---|---|---|---|---|---|---|---|
| Quadrant | DetID | PixID | Counts | Sigma | Mean | Median | Sigma |
| A | 8 | 5 | 3187929 | 6216.1 | 2517 | 2458 | 512.5 |
| A | 13 | 251 | 1767223 | 3443.74 | 2517 | 2458 | 512.5 |
| A | 14 | 238 | 1261794 | 2457.45 | 2517 | 2458 | 512.5 |
| B | 4 | 239 | 2454097 | 5013.94 | 2558 | 2496 | 489.0 |
| B | 3 | 64 | 1037817 | 2117.41 | 2558 | 2496 | 489.0 |
| B | 11 | 51 | 206083 | 416.37 | 2558 | 2496 | 489.0 |
| C | 13 | 61 | 18544 | 27.34 | 2516 | 2530 | 585.8 |
| C | 9 | 204 | 9841 | 12.48 | 2516 | 2530 | 585.8 |
| C | 14 | 234 | 7060 | 7.73 | 2516 | 2530 | 585.8 |
| D | 1 | 52 | 2741828 | 4684.9 | 2409 | 2336 | 584.7 |
| D | 10 | 253 | 2639151 | 4509.31 | 2409 | 2336 | 584.7 |
| D | 12 | 157 | 1125501 | 1920.76 | 2409 | 2336 | 584.7 |
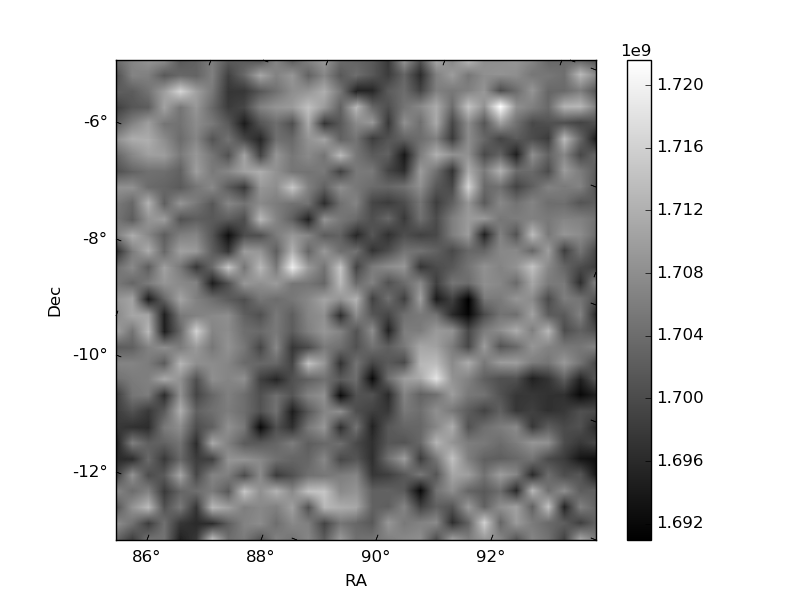
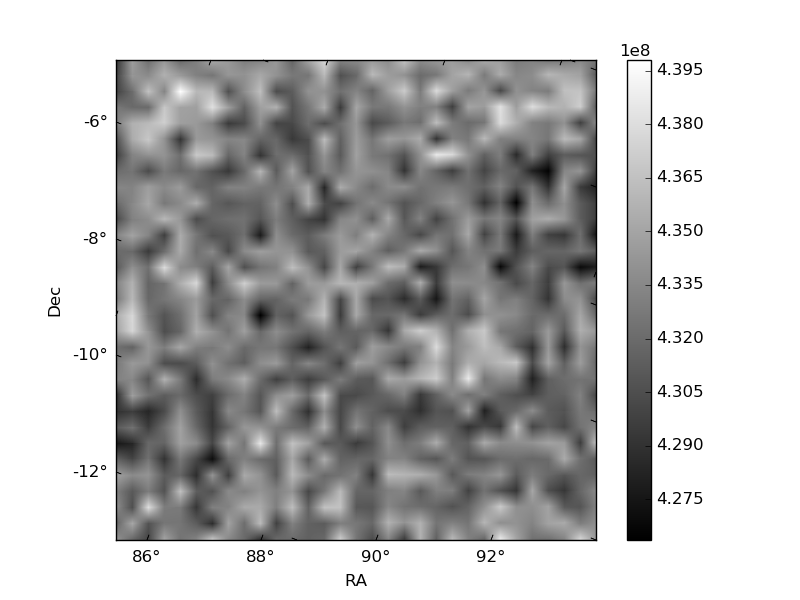
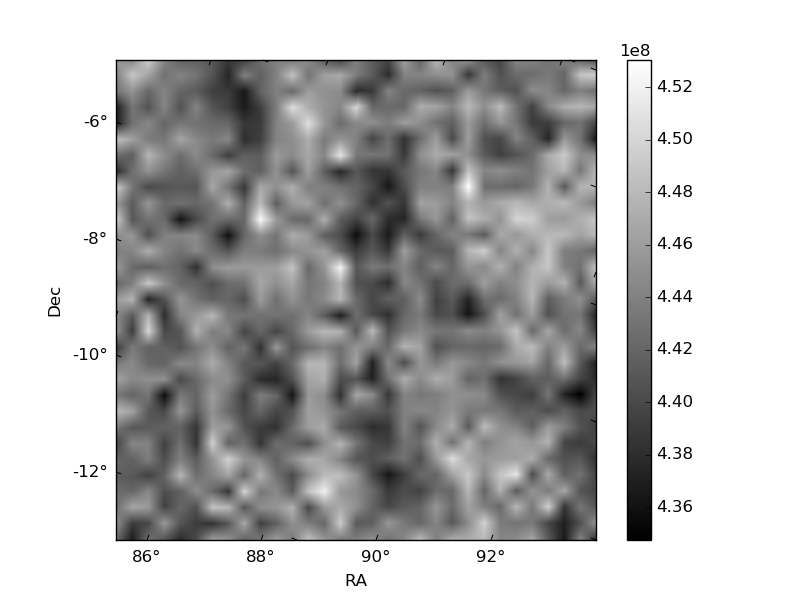
Histogram calculated using DETX and DETY for each event in the final _common_clean file
| Quadrant A | 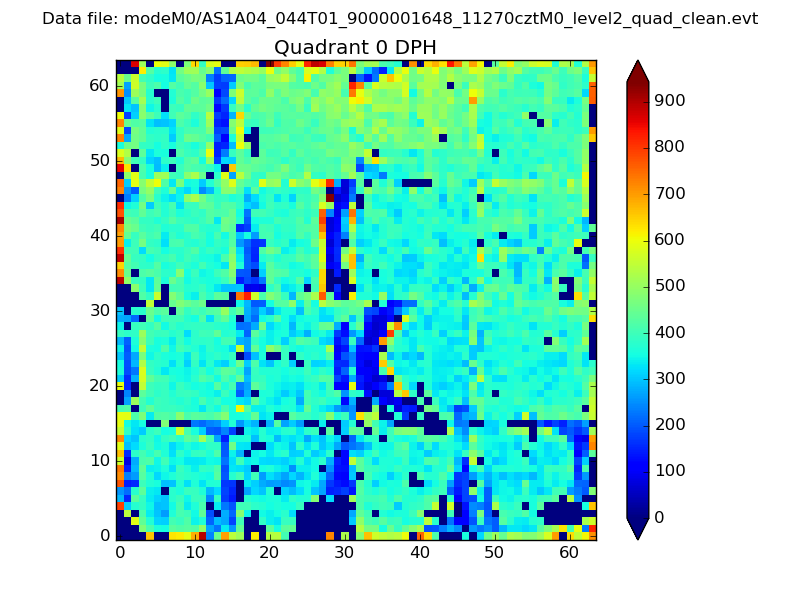 |
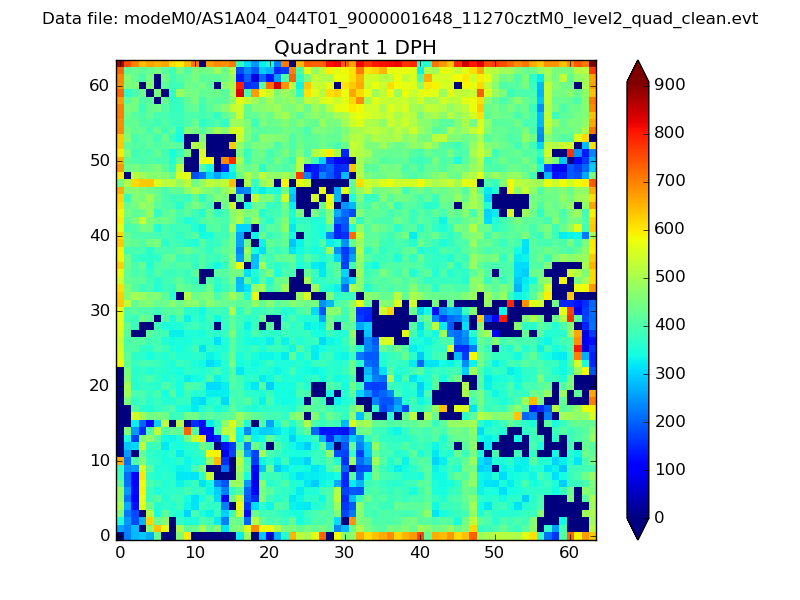 |
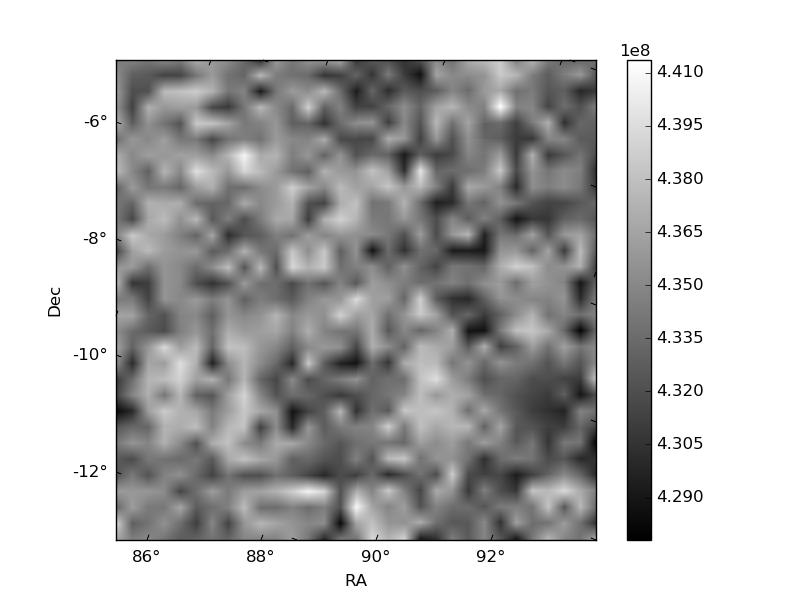
Quadrant B |
|---|---|---|---|
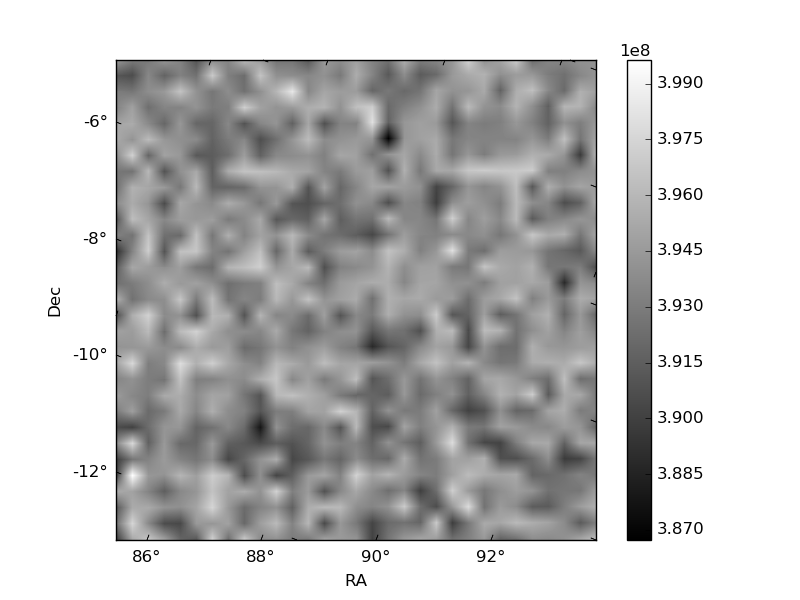
| Quadrant D | 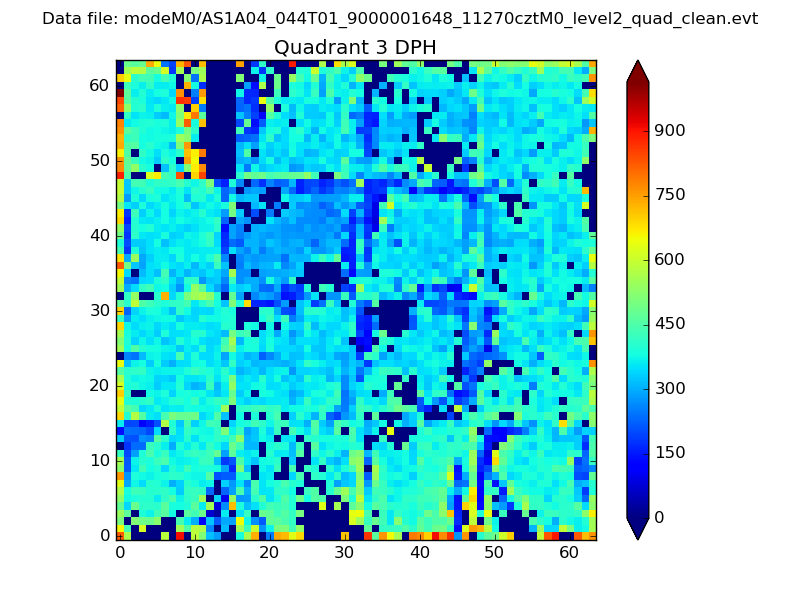 |
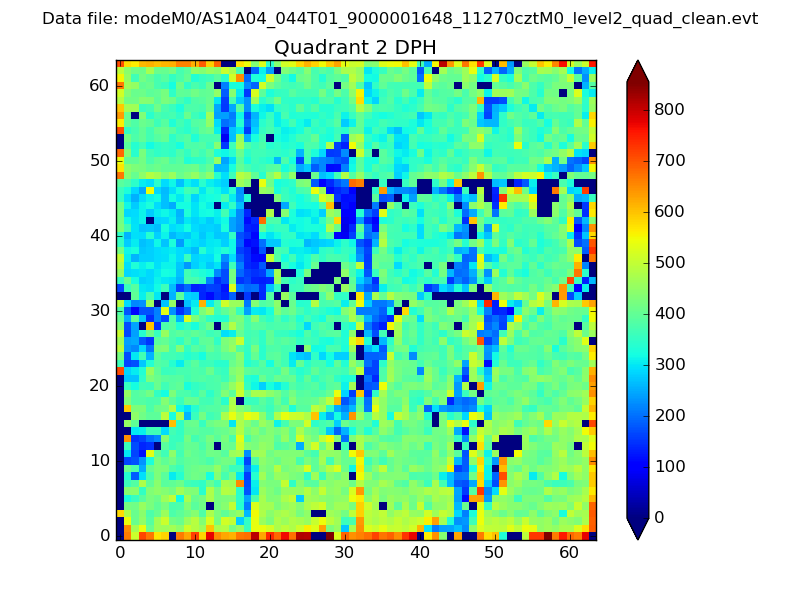 |
Quadrant C |
| Plot type | Count rate plots | Images |
|---|---|---|
| Comparison with Poisson distribution Blue bars denote a histogram of data divided into 1 sec bins. Red curve is a Poisson curve with rate = median count rate of data. |
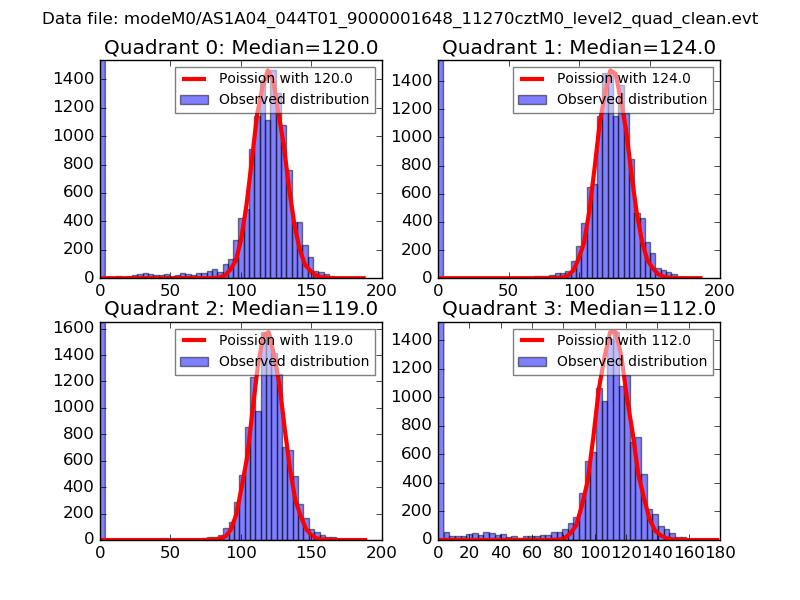 |
 |
| Quadrant-wise count rates Data is divided into 100 sec bins |
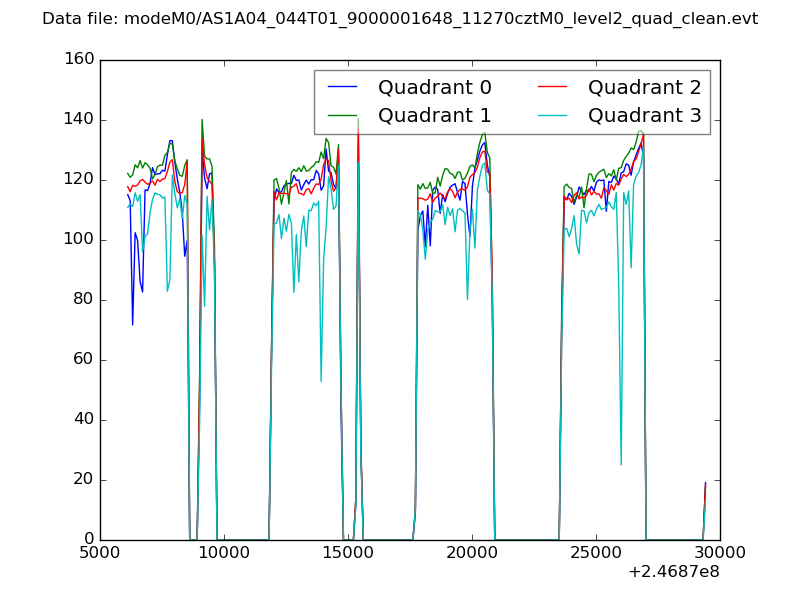 |
|
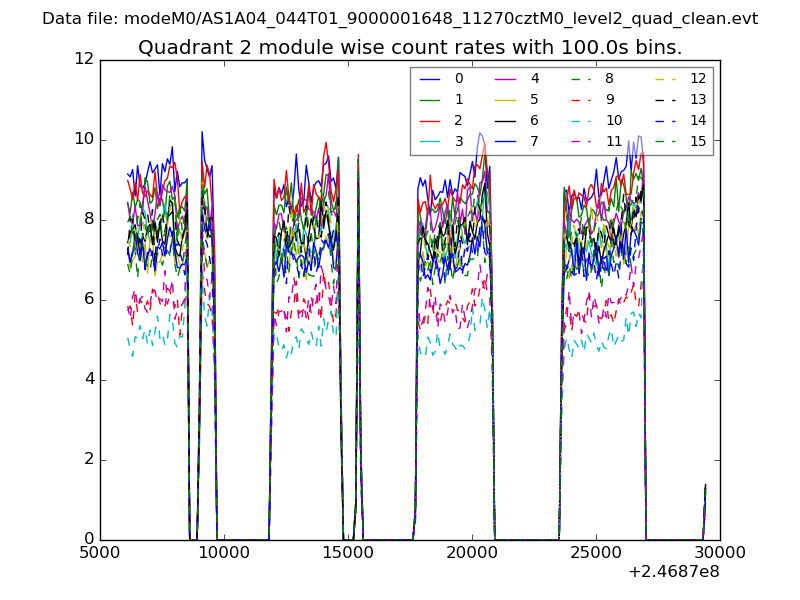
| Module-wise count rates for Quadrant A Data is divided into 100 sec bins |
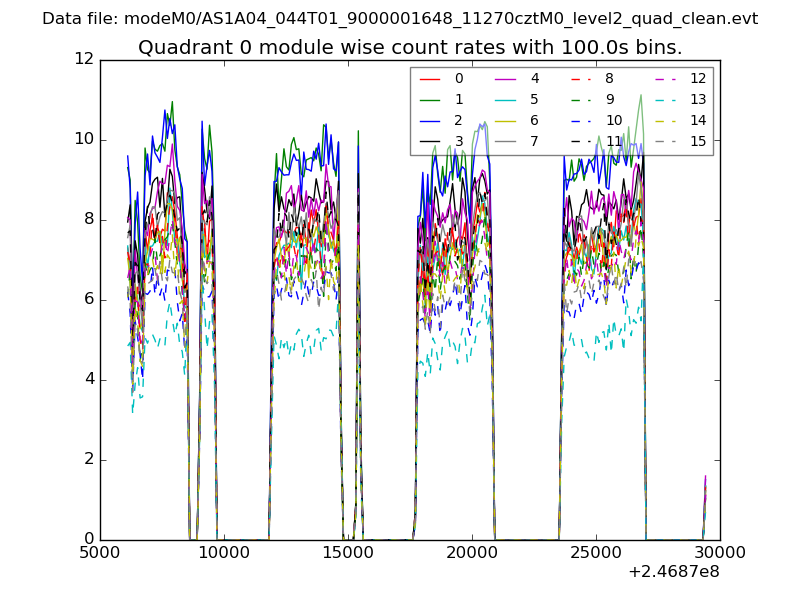 |
 |
| Module-wise count rates for Quadrant B Data is divided into 100 sec bins |
 |
 |
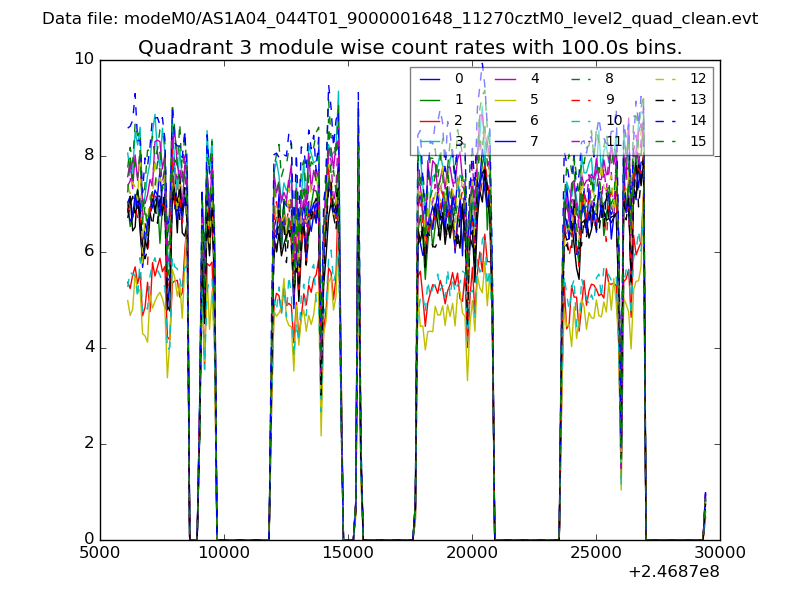
| Module-wise count rates for Quadrant C Data is divided into 100 sec bins |
 |
 |
| Module-wise count rates for Quadrant D Data is divided into 100 sec bins |
 |
 |
| Parameter | Plot |
|---|---|
| CZT HV Monitor | 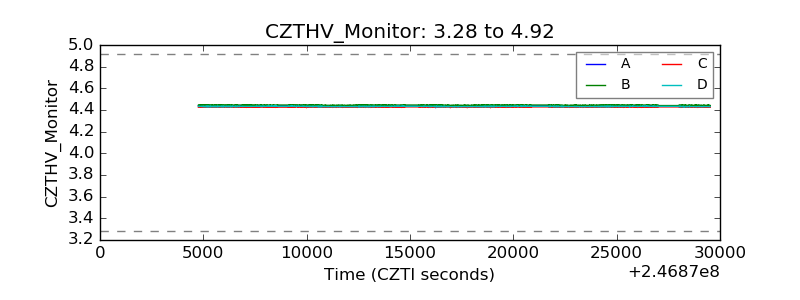 |
| D_VDD | 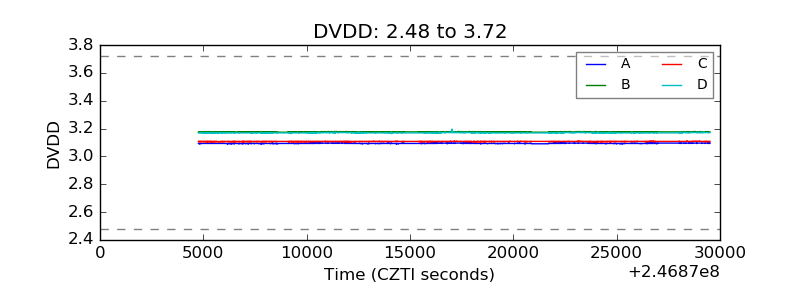 |
| Temperature 1 | 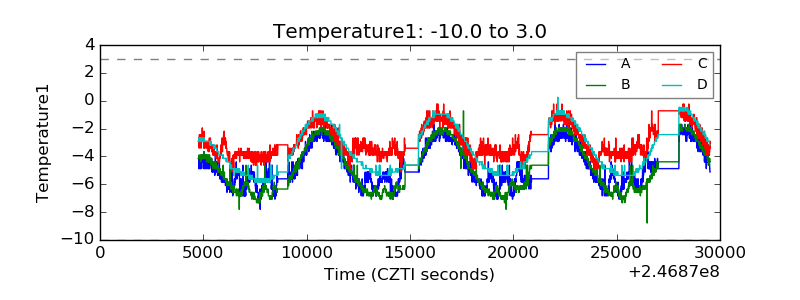 |
| Veto HV Monitor | 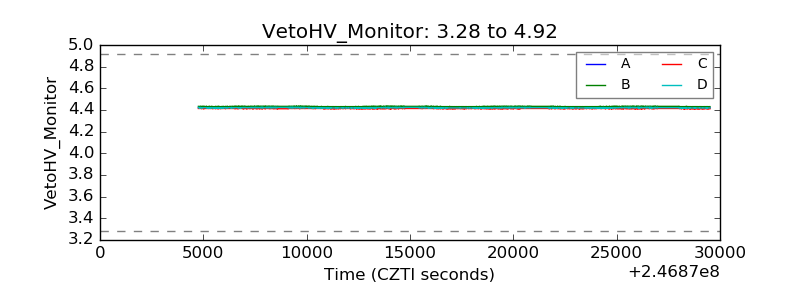 |
| Veto LLD | 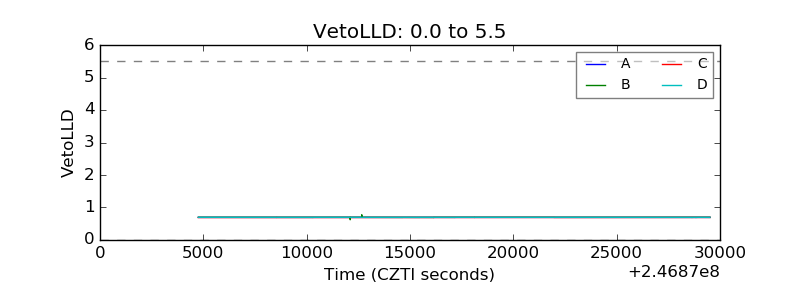 |
| Alpha Counter | 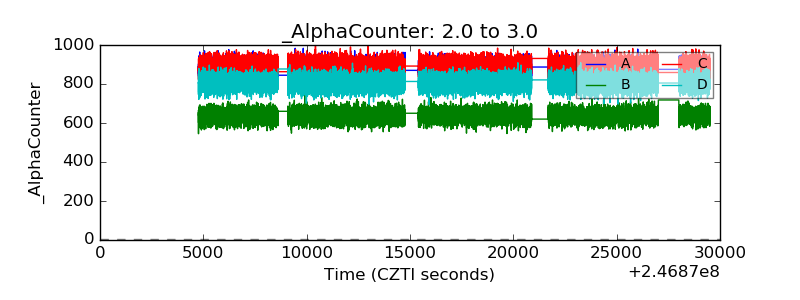 |
| _CPM_Rate | 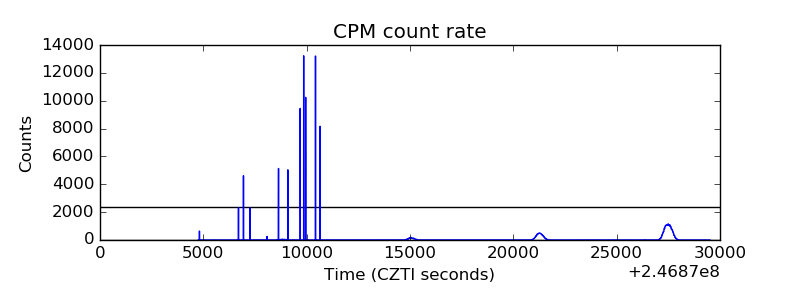 |
| CZT Counter | 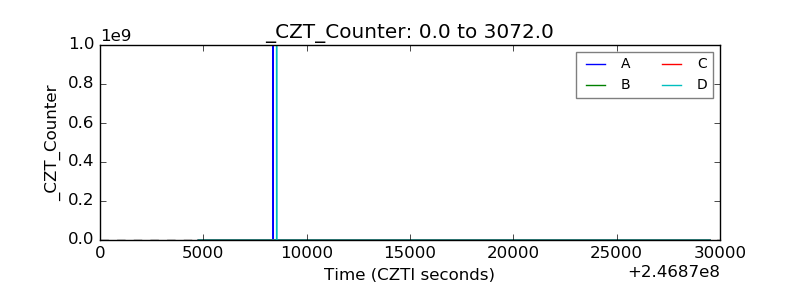 |
| +2.5 Volts monitor | 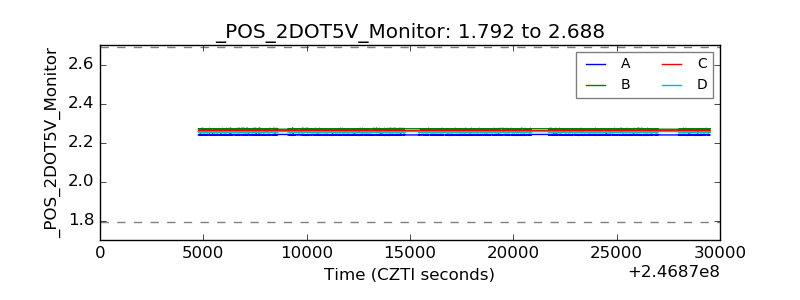 |
| +5 Volts monitor | 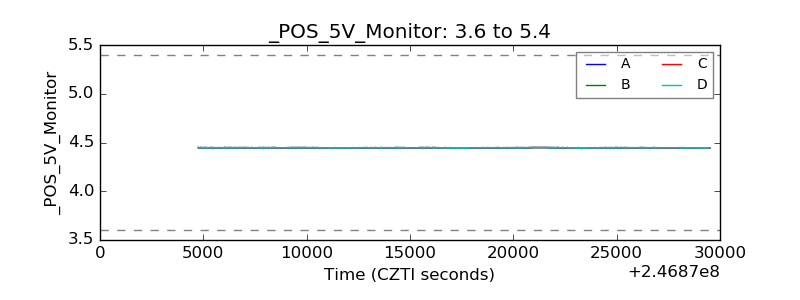 |
| _ROLL_ROT | 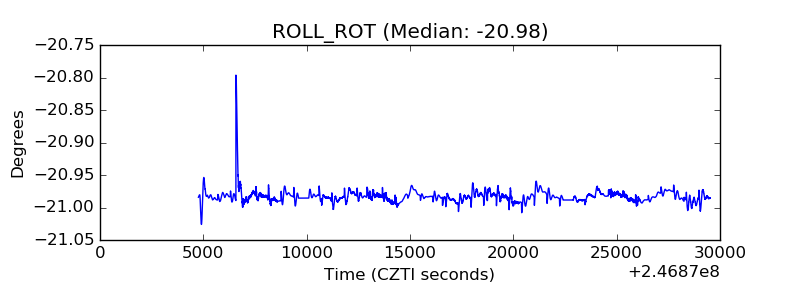 |
| _Roll_DEC | 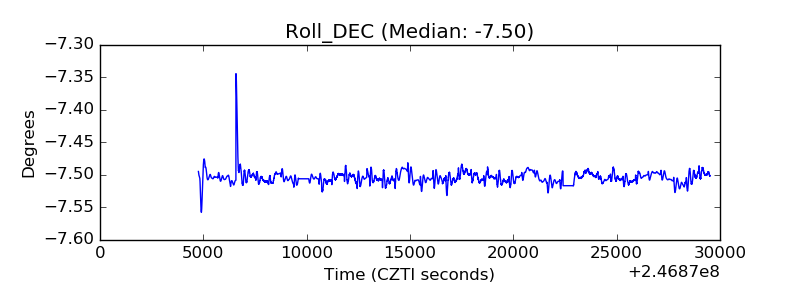 |
| _Roll_RA | 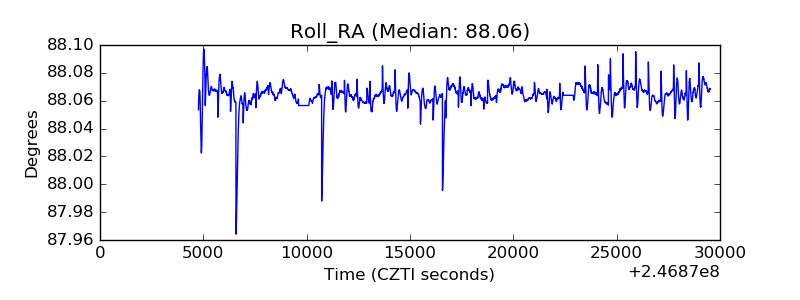 |
| Veto Counter | 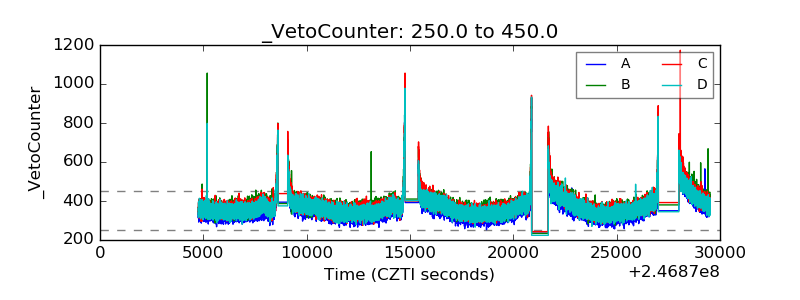 |