| Param | Original file | Final file |
|---|---|---|
| Filename | modeM0/AS1A04_044T01_9000001648_11273cztM0_level2.evt | modeM0/AS1A04_044T01_9000001648_11273cztM0_level2_quad_clean.evt |
| Size (bytes) | 651,386,880 | 78,920,640 |
| Size | 621.2 MB | 75.3 MB |
| Events in quadrant A | 6,018,014 | 472,348 |
| Events in quadrant B | 4,355,817 | 528,243 |
| Events in quadrant C | 2,775,110 | 514,056 |
| Events in quadrant D | 6,180,731 | 463,431 |
| Mode SS | |||
|---|---|---|---|
| Quadrant | BADHDUFLAG | Total packets | Discarded packets |
| A | 0 | 120 | 0 |
| B | 0 | 120 | 0 |
| C | 0 | 120 | 0 |
| D | 0 | 120 | 0 |
| Mode M9 | |||
|---|---|---|---|
| Quadrant | BADHDUFLAG | Total packets | Discarded packets |
| A | 0 | 12 | 0 |
| B | 0 | 12 | 0 |
| C | 0 | 12 | 0 |
| D | 0 | 12 | 0 |
| Mode M0 | |||
|---|---|---|---|
| Quadrant | BADHDUFLAG | Total packets | Discarded packets |
| A | 0 | 21965 | 2 |
| B | 0 | 16941 | 1 |
| C | 0 | 12150 | 1 |
| D | 0 | 22495 | 1 |
| Quadrant | Total seconds | Saturated seconds | Saturation percentage |
|---|---|---|---|
| A | 5883 | 954 | 16.216216% |
| B | 5883 | 500 | 8.499065% |
| C | 5883 | 47 | 0.798912% |
| D | 5883 | 625 | 10.623831% |
Noise dominated data is calculated using 1-second bins in cleaned event files. If a bin has >2000 counts, and if more than 50% of those come from <1% of pixels, then it is considered to be noise-dominated and hence unusable.
| Quadrant | # 1 sec bins | Bins with >0 counts | Bins with >2000 counts | High rate bins dominated by noise | Noise dominated (total time) | Noise dominated (detector-on time) | Marked lightcurve |
|---|---|---|---|---|---|---|---|
| A | 7093 | 5884 | 622 | 622 | 8.77% | 10.57% | 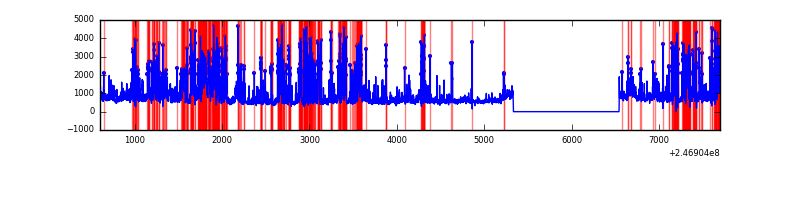 |
| B | 7093 | 5884 | 244 | 244 | 3.44% | 4.15% | 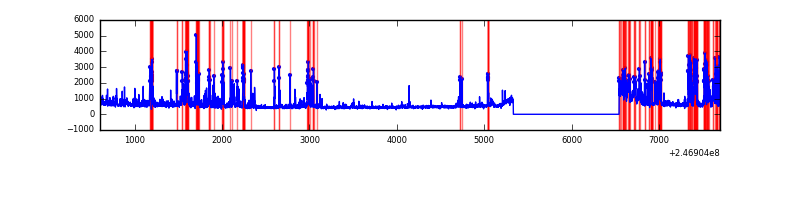 |
| C | 7093 | 5884 | 0 | 0 | 0.00% | 0.00% | 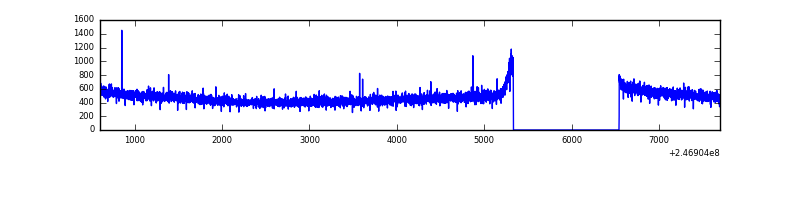 |
| D | 7093 | 5884 | 491 | 491 | 6.92% | 8.34% | 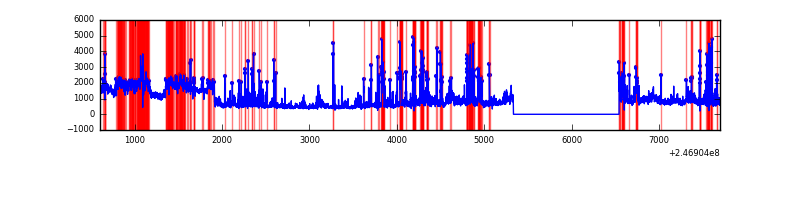 |
Top three noisy pixels from each quadrant. If the there are fewer than three noisy pixels in the level2.evt file, extra rows are filled as -1
| Pixel properties | Quadrant properties | ||||||
|---|---|---|---|---|---|---|---|
| Quadrant | DetID | PixID | Counts | Sigma | Mean | Median | Sigma |
| A | 14 | 238 | 1581611 | 11368.22 | 685 | 672 | 139.1 |
| A | 8 | 5 | 1450216 | 10423.39 | 685 | 672 | 139.1 |
| A | 8 | 15 | 125129 | 894.95 | 685 | 672 | 139.1 |
| B | 4 | 239 | 1020312 | 7483.04 | 721 | 708 | 136.3 |
| B | 3 | 64 | 242519 | 1774.69 | 721 | 708 | 136.3 |
| B | 11 | 51 | 104274 | 760.09 | 721 | 708 | 136.3 |
| C | 13 | 61 | 5137 | 26.86 | 711 | 714 | 164.6 |
| C | 12 | 4 | 2537 | 11.07 | 711 | 714 | 164.6 |
| C | 3 | 202 | 1760 | 6.35 | 711 | 714 | 164.6 |
| D | 10 | 234 | 878990 | 5379.84 | 675 | 657 | 163.3 |
| D | 12 | 157 | 572442 | 3502.21 | 675 | 657 | 163.3 |
| D | 10 | 253 | 496315 | 3035.93 | 675 | 657 | 163.3 |
Histogram calculated using DETX and DETY for each event in the final _common_clean file
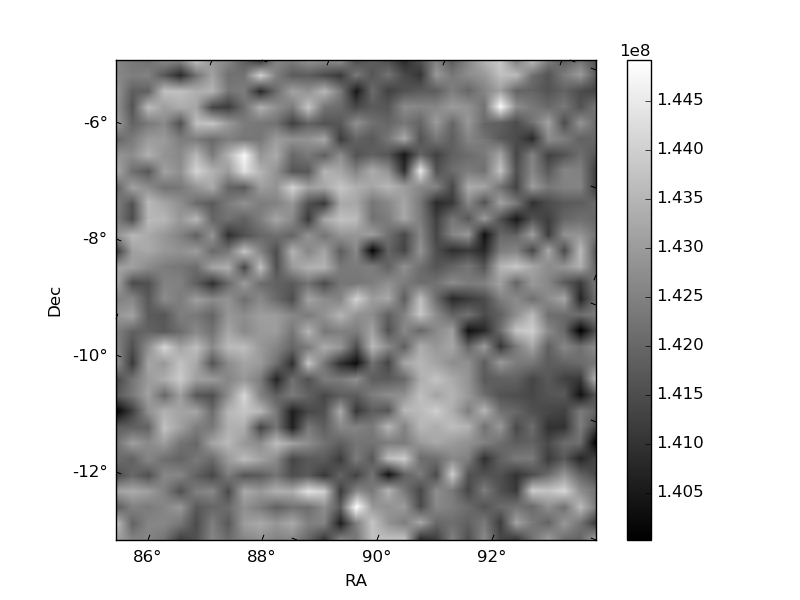
| Quadrant A | 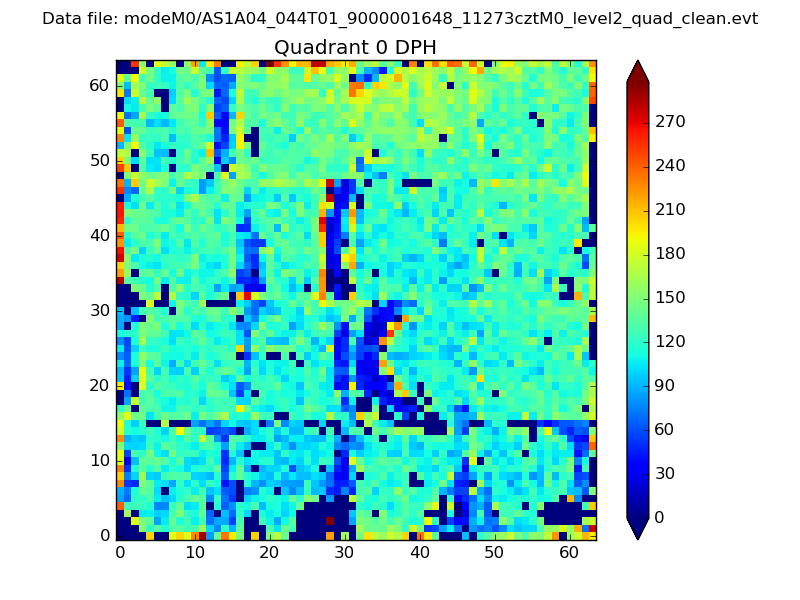 |
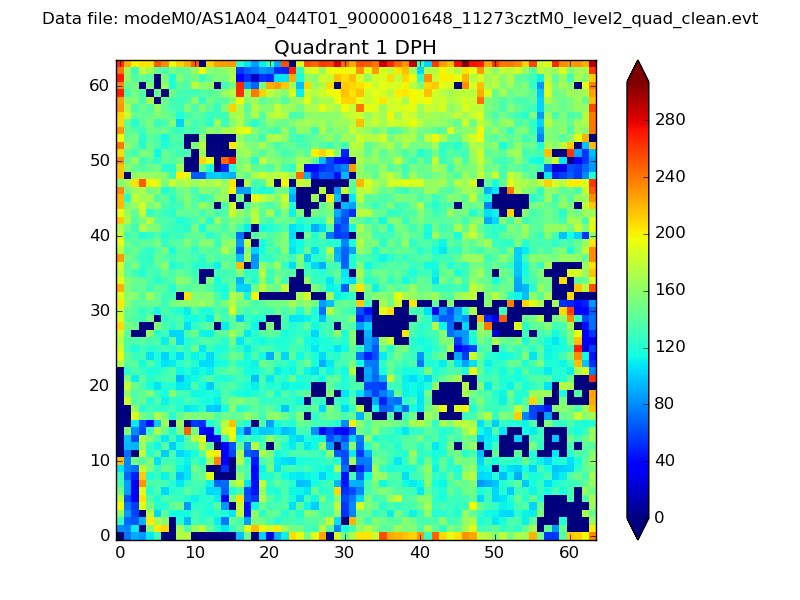 |
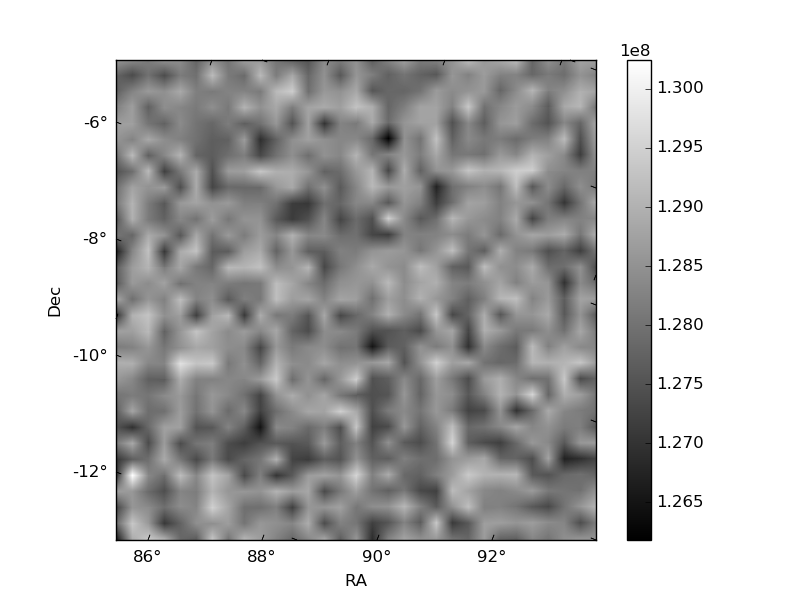
Quadrant B |
|---|---|---|---|
| Quadrant D | 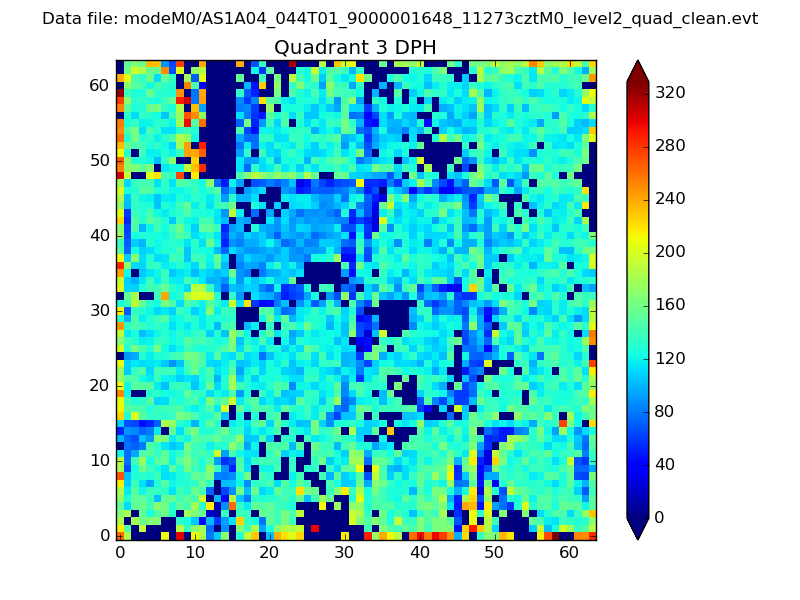 |
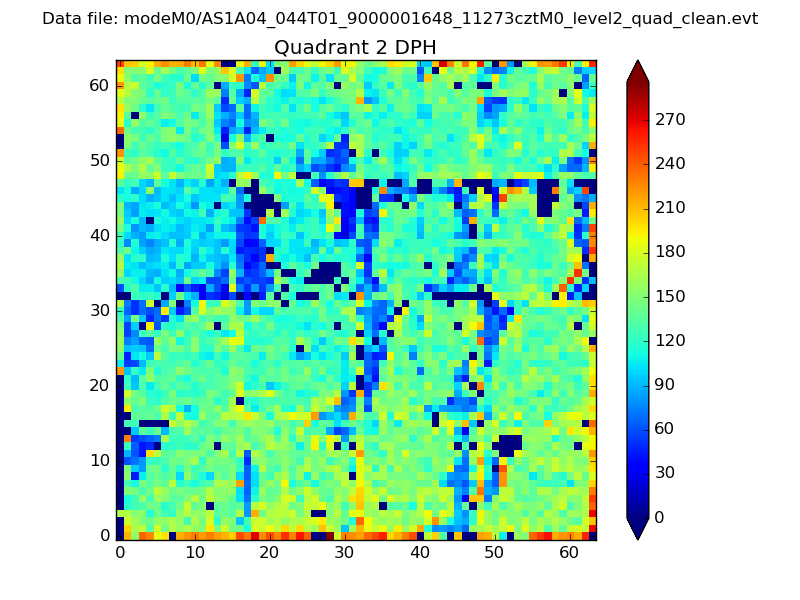 |
Quadrant C |
| Plot type | Count rate plots | Images |
|---|---|---|
| Comparison with Poisson distribution Blue bars denote a histogram of data divided into 1 sec bins. Red curve is a Poisson curve with rate = median count rate of data. |
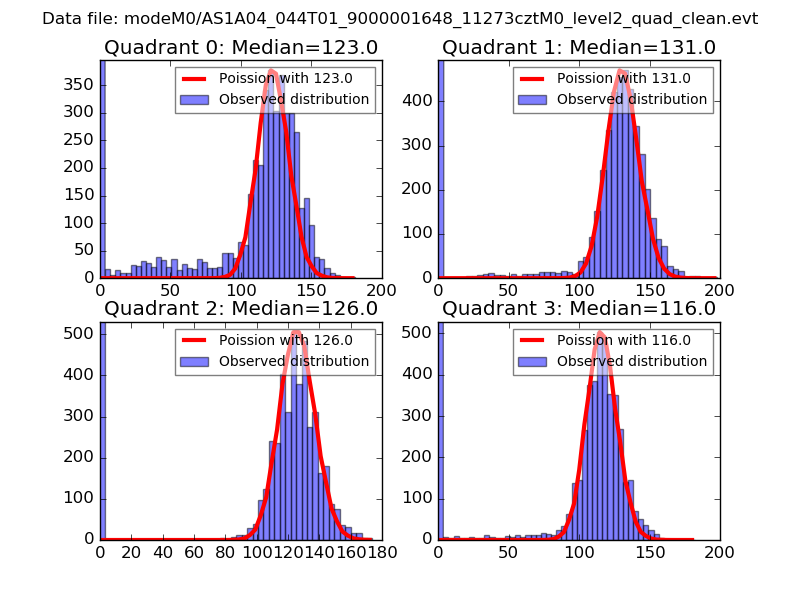 |
 |
| Quadrant-wise count rates Data is divided into 100 sec bins |
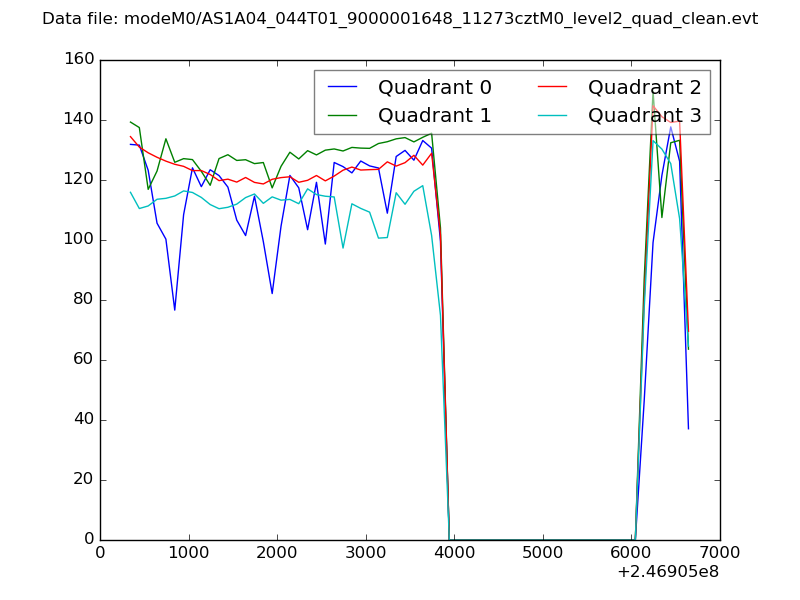 |
|
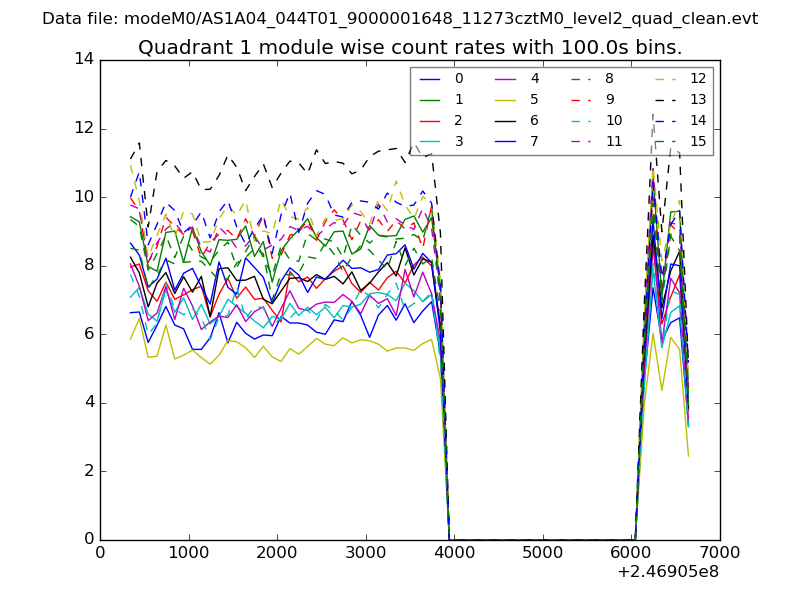
| Module-wise count rates for Quadrant A Data is divided into 100 sec bins |
 |
 |
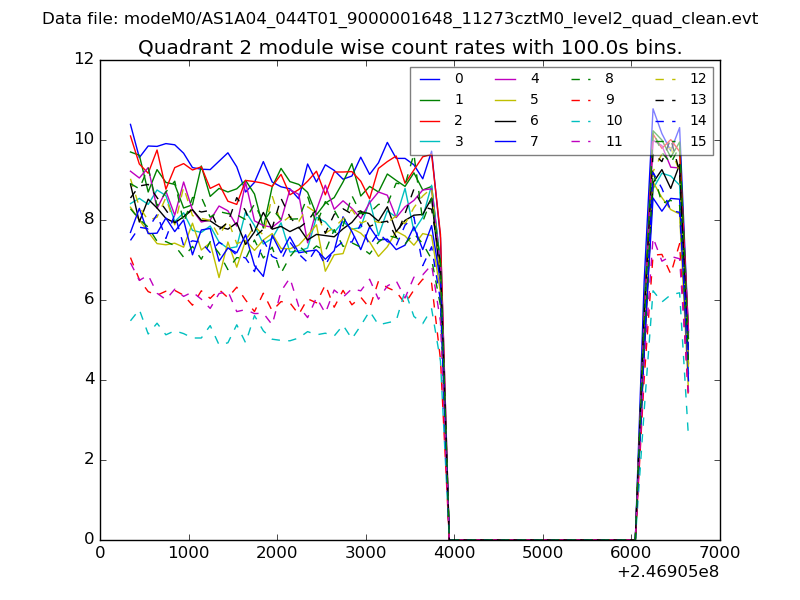
| Module-wise count rates for Quadrant B Data is divided into 100 sec bins |
 |
 |
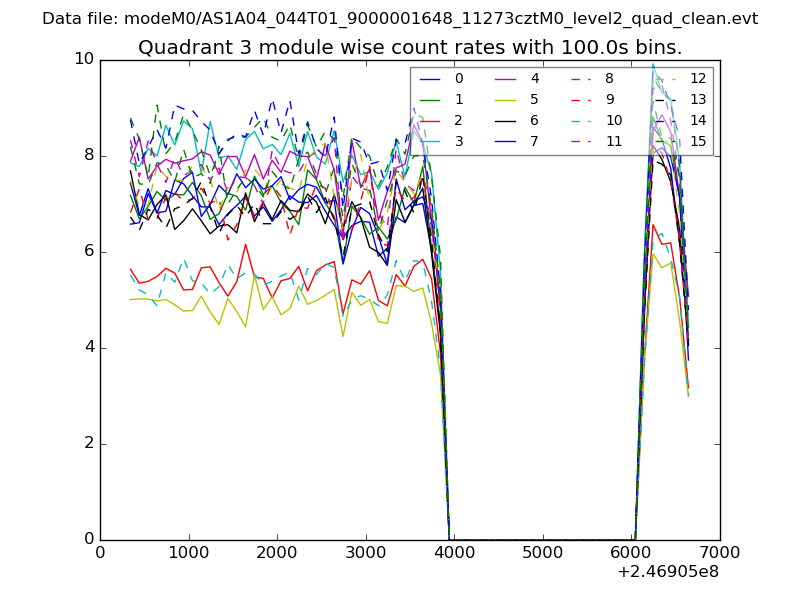
| Module-wise count rates for Quadrant C Data is divided into 100 sec bins |
 |
 |
| Module-wise count rates for Quadrant D Data is divided into 100 sec bins |
 |
 |
| Parameter | Plot |
|---|---|
| CZT HV Monitor | 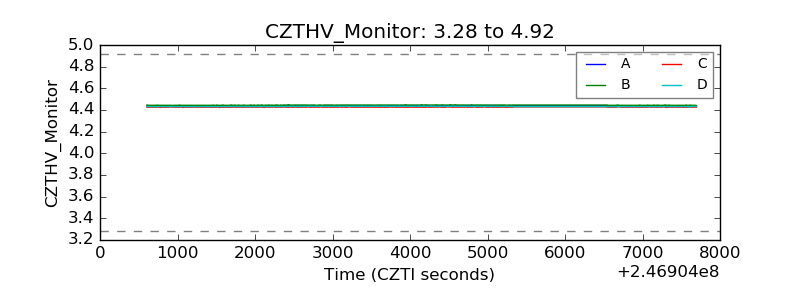 |
| D_VDD |  |
| Temperature 1 | 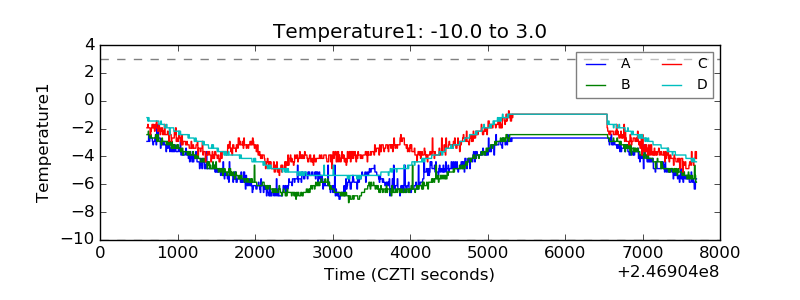 |
| Veto HV Monitor | 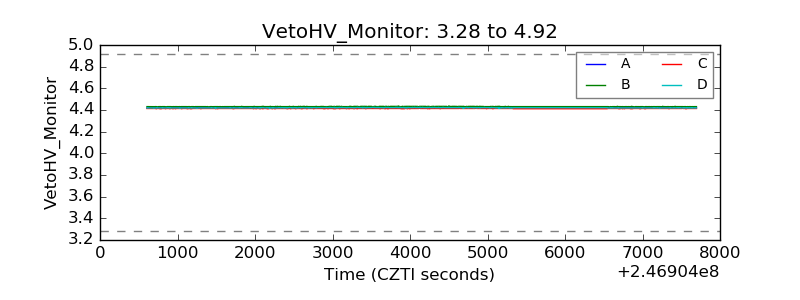 |
| Veto LLD | 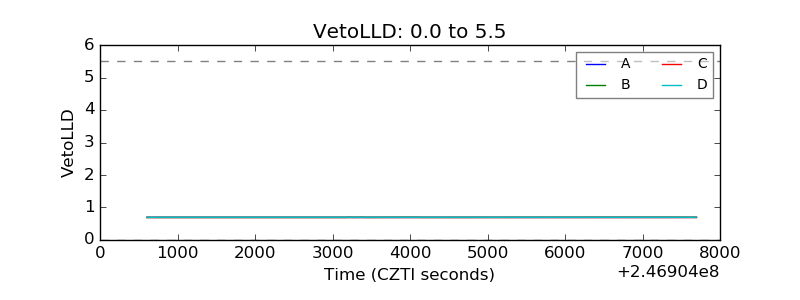 |
| Alpha Counter | 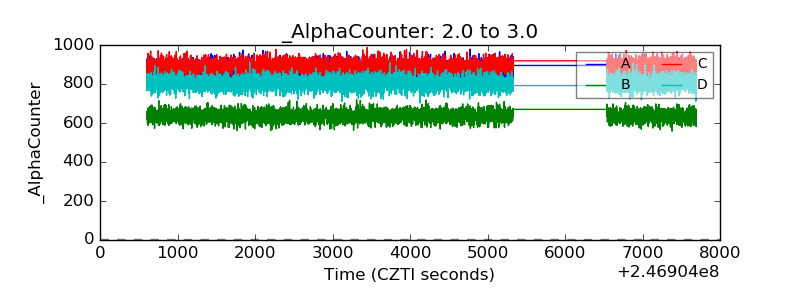 |
| _CPM_Rate | 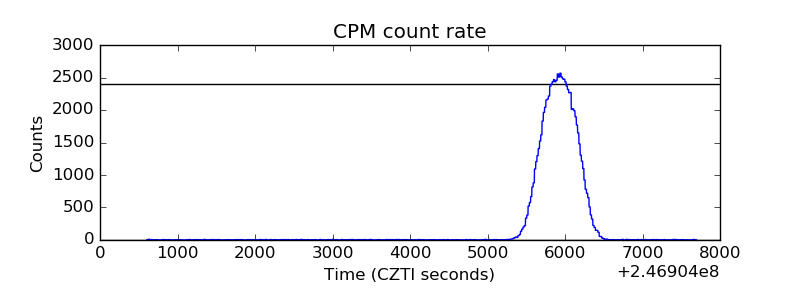 |
| CZT Counter | 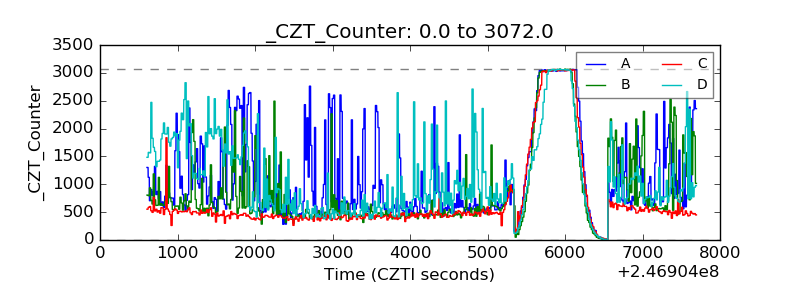 |
| +2.5 Volts monitor |  |
| +5 Volts monitor |  |
| _ROLL_ROT | 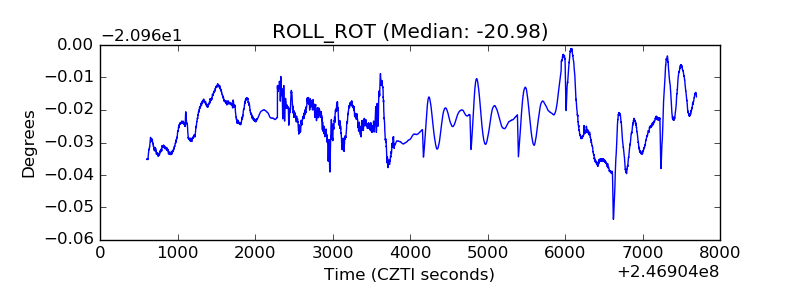 |
| _Roll_DEC | 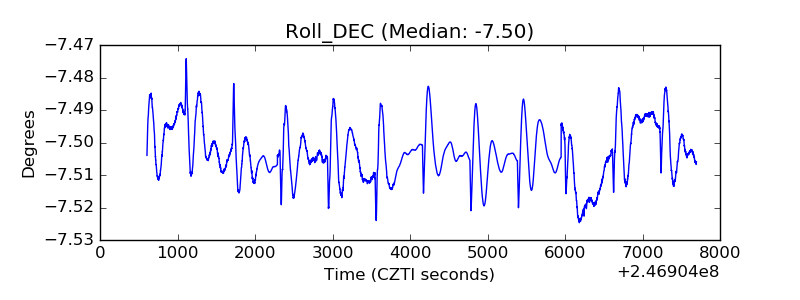 |
| _Roll_RA | 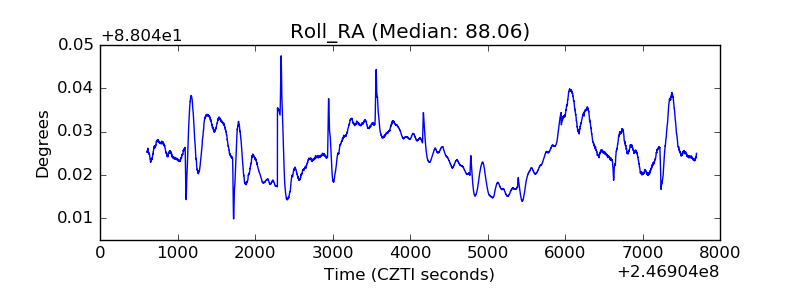 |
| Veto Counter | 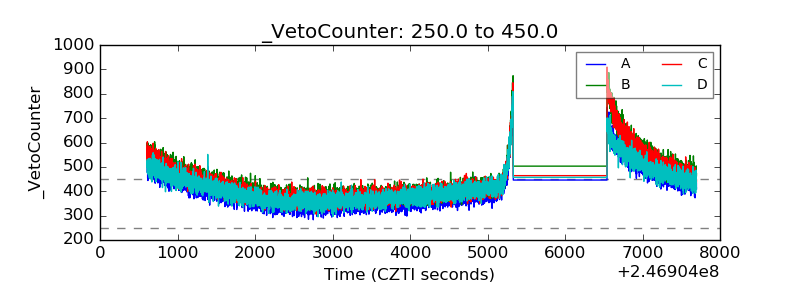 |