| Param | Original file | Final file |
|---|---|---|
| Filename | modeM0/AS1A04_044T01_9000001648_11275cztM0_level2.evt | modeM0/AS1A04_044T01_9000001648_11275cztM0_level2_quad_clean.evt |
| Size (bytes) | 600,710,400 | 100,120,320 |
| Size | 572.9 MB | 95.5 MB |
| Events in quadrant A | 4,685,431 | 643,059 |
| Events in quadrant B | 5,516,947 | 671,278 |
| Events in quadrant C | 3,233,765 | 651,092 |
| Events in quadrant D | 4,305,817 | 602,699 |
| Mode SS | |||
|---|---|---|---|
| Quadrant | BADHDUFLAG | Total packets | Discarded packets |
| A | 0 | 136 | 0 |
| B | 0 | 136 | 0 |
| C | 0 | 136 | 0 |
| D | 0 | 136 | 0 |
| Mode M9 | |||
|---|---|---|---|
| Quadrant | BADHDUFLAG | Total packets | Discarded packets |
| A | 0 | 26 | 0 |
| B | 0 | 26 | 0 |
| C | 0 | 26 | 0 |
| D | 0 | 26 | 0 |
| Mode M0 | |||
|---|---|---|---|
| Quadrant | BADHDUFLAG | Total packets | Discarded packets |
| A | 0 | 18191 | 3 |
| B | 0 | 20915 | 2 |
| C | 0 | 13918 | 2 |
| D | 0 | 17159 | 2 |
| Quadrant | Total seconds | Saturated seconds | Saturation percentage |
|---|---|---|---|
| A | 6656 | 474 | 7.121394% |
| B | 6656 | 722 | 10.847356% |
| C | 6656 | 31 | 0.465745% |
| D | 6656 | 170 | 2.554087% |
Noise dominated data is calculated using 1-second bins in cleaned event files. If a bin has >2000 counts, and if more than 50% of those come from <1% of pixels, then it is considered to be noise-dominated and hence unusable.
| Quadrant | # 1 sec bins | Bins with >0 counts | Bins with >2000 counts | High rate bins dominated by noise | Noise dominated (total time) | Noise dominated (detector-on time) | Marked lightcurve |
|---|---|---|---|---|---|---|---|
| A | 9236 | 6658 | 255 | 255 | 2.76% | 3.83% | 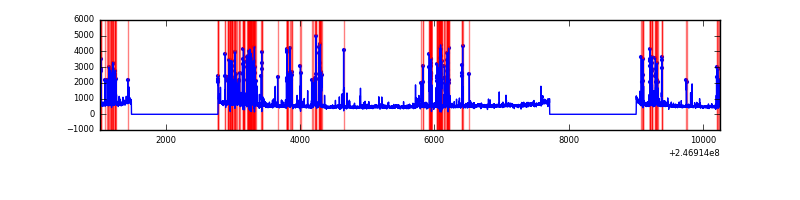 |
| B | 9236 | 6658 | 323 | 323 | 3.50% | 4.85% | 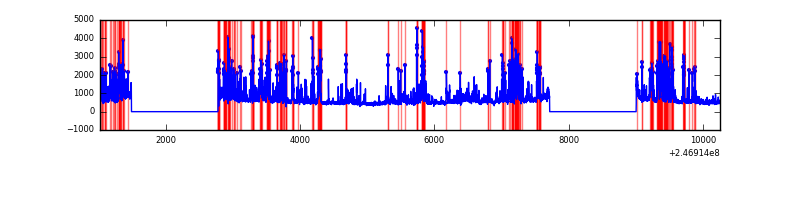 |
| C | 9236 | 6658 | 0 | 0 | 0.00% | 0.00% | 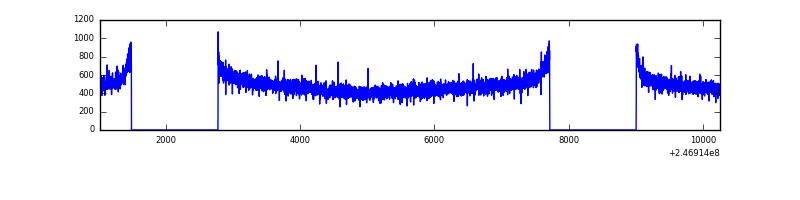 |
| D | 9236 | 6658 | 93 | 93 | 1.01% | 1.40% |  |
Top three noisy pixels from each quadrant. If the there are fewer than three noisy pixels in the level2.evt file, extra rows are filled as -1
| Pixel properties | Quadrant properties | ||||||
|---|---|---|---|---|---|---|---|
| Quadrant | DetID | PixID | Counts | Sigma | Mean | Median | Sigma |
| A | 14 | 238 | 867717 | 5162.47 | 829 | 814 | 167.9 |
| A | 8 | 5 | 395010 | 2347.47 | 829 | 814 | 167.9 |
| A | 1 | 162 | 69042 | 406.3 | 829 | 814 | 167.9 |
| B | 4 | 239 | 1196999 | 7469.99 | 837 | 818 | 160.1 |
| B | 3 | 64 | 788838 | 4921.08 | 837 | 818 | 160.1 |
| B | 11 | 51 | 118961 | 737.78 | 837 | 818 | 160.1 |
| C | 13 | 61 | 6055 | 27.15 | 828 | 835 | 192.2 |
| C | 5 | 128 | 2478 | 8.55 | 828 | 835 | 192.2 |
| C | 12 | 4 | 2097 | 6.56 | 828 | 835 | 192.2 |
| D | 10 | 253 | 318647 | 1633.63 | 809 | 788 | 194.6 |
| D | 1 | 52 | 254357 | 1303.21 | 809 | 788 | 194.6 |
| D | 8 | 195 | 177646 | 908.96 | 809 | 788 | 194.6 |
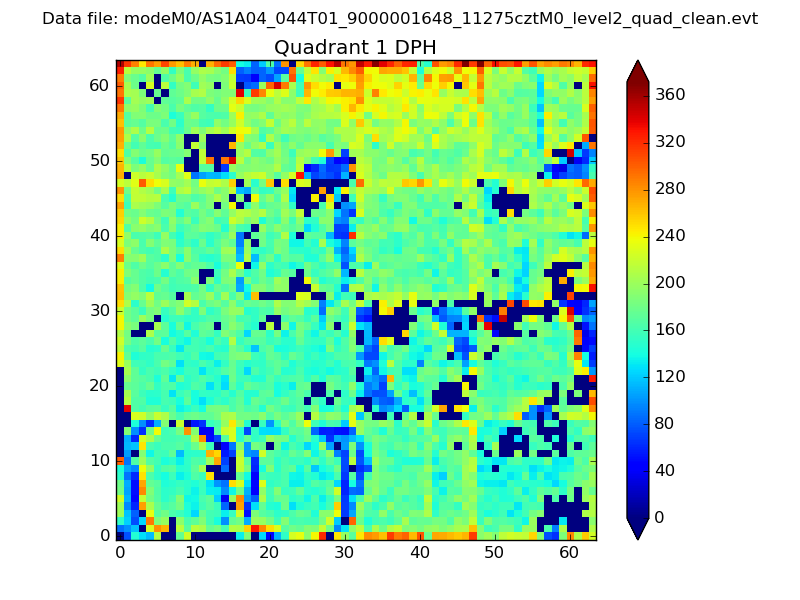
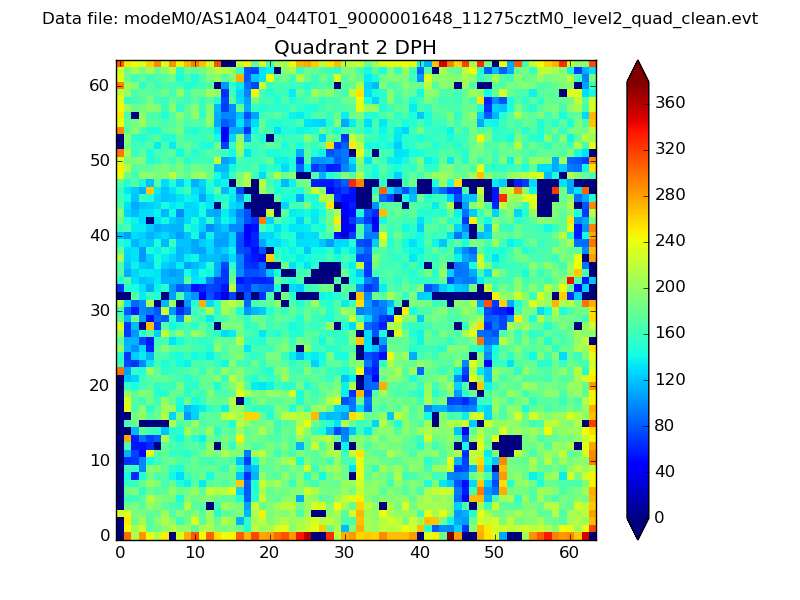
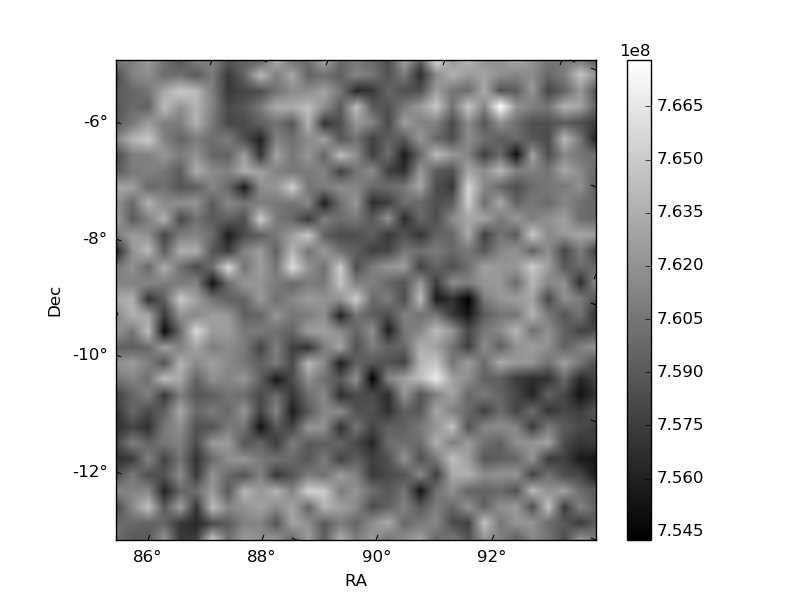
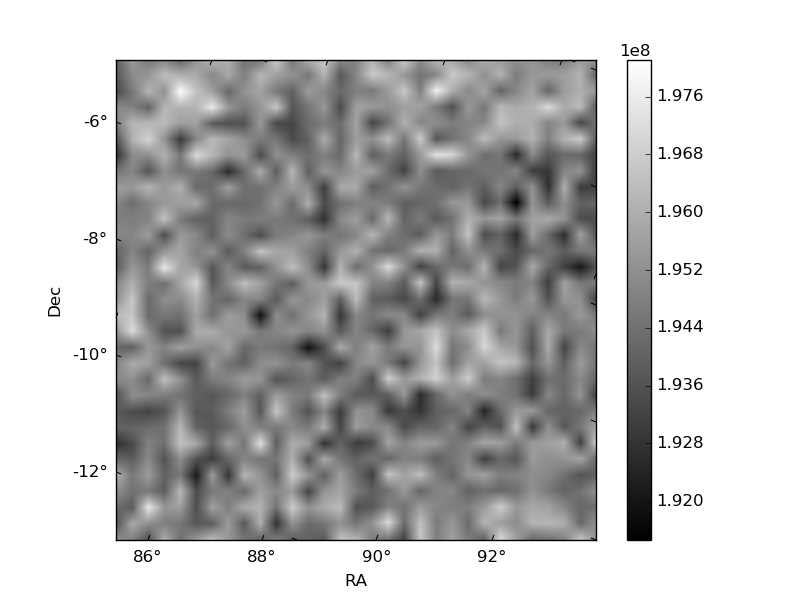
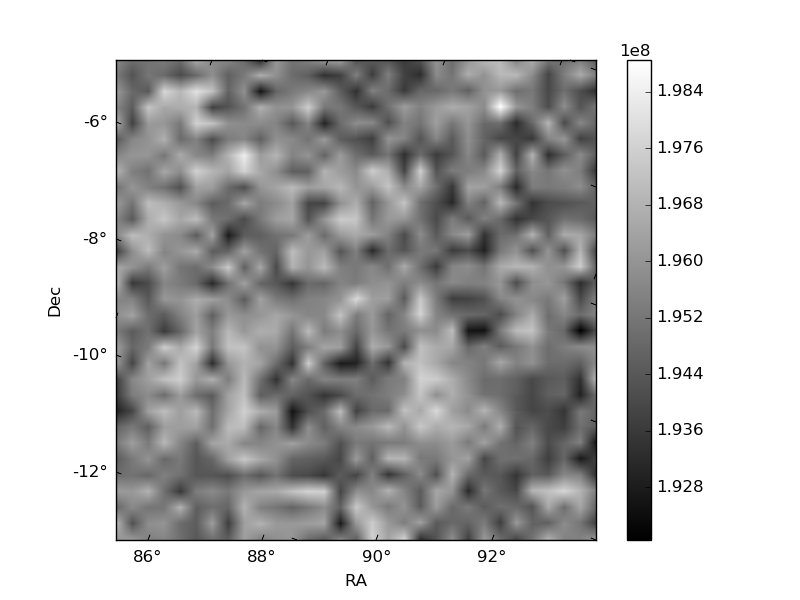
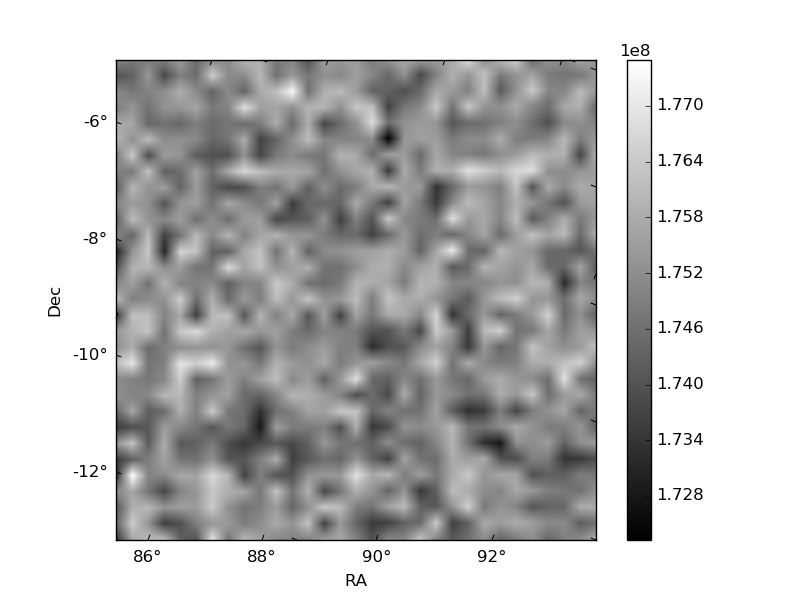
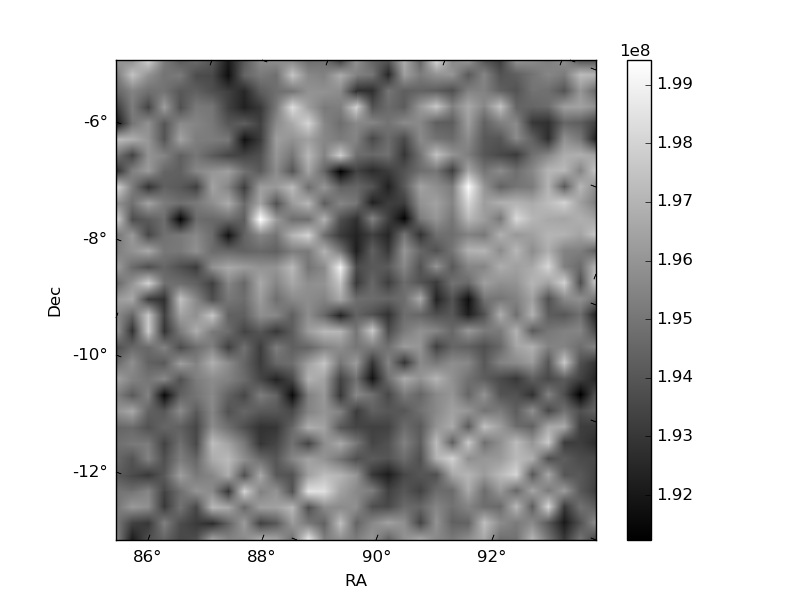
Histogram calculated using DETX and DETY for each event in the final _common_clean file
| Quadrant A | 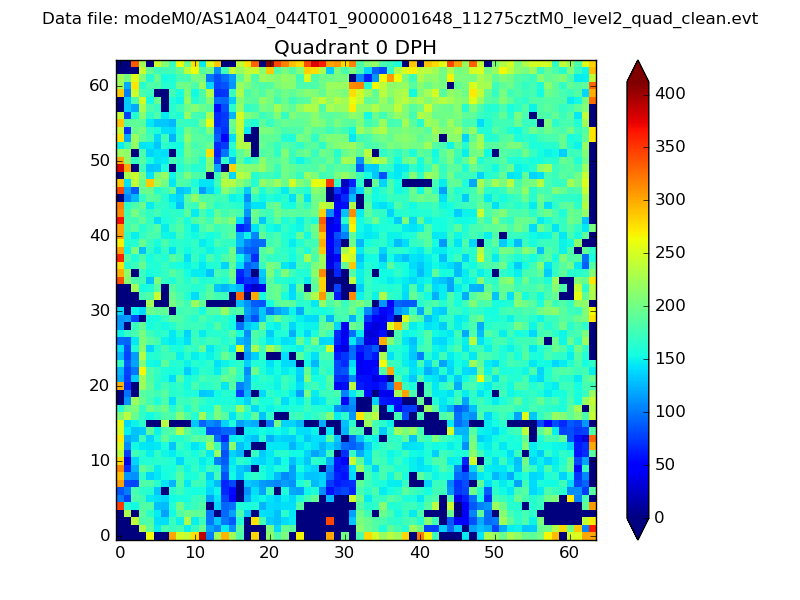 |
 |
Quadrant B |
|---|---|---|---|
| Quadrant D | 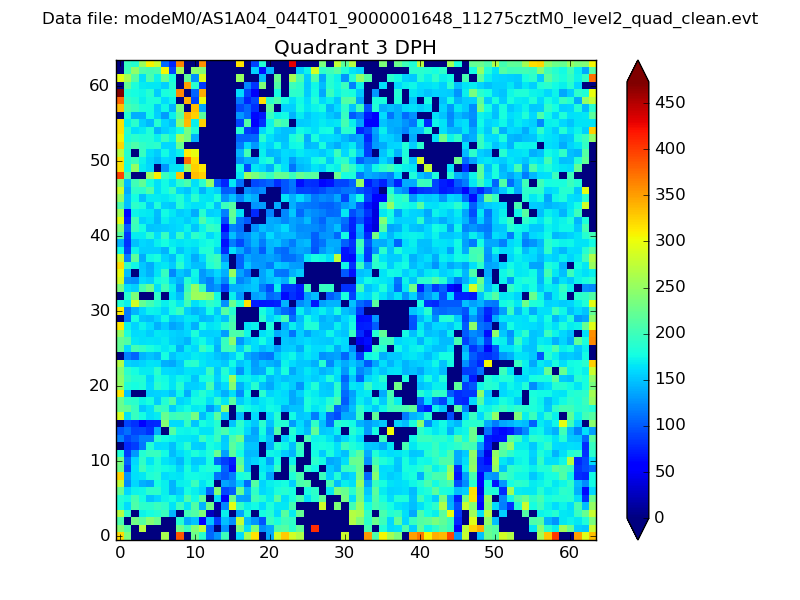 |
 |
Quadrant C |
| Plot type | Count rate plots | Images |
|---|---|---|
| Comparison with Poisson distribution Blue bars denote a histogram of data divided into 1 sec bins. Red curve is a Poisson curve with rate = median count rate of data. |
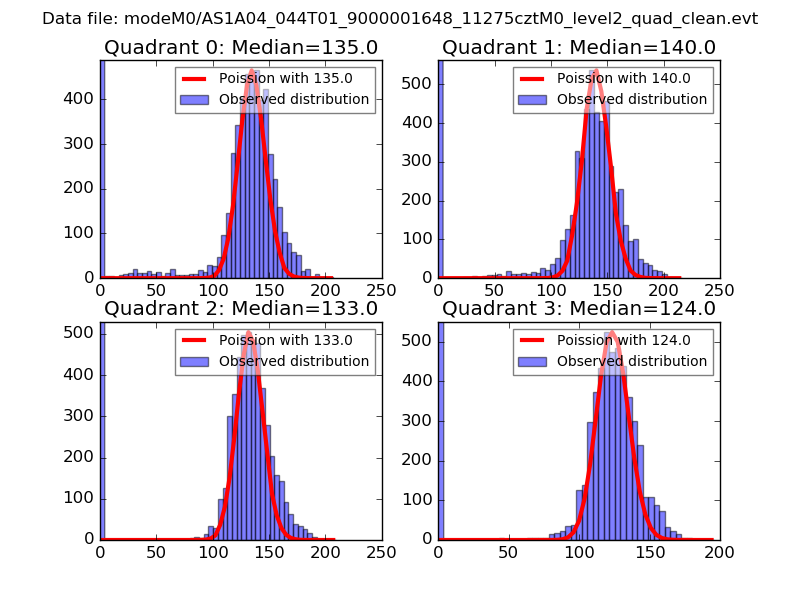 |
 |
| Quadrant-wise count rates Data is divided into 100 sec bins |
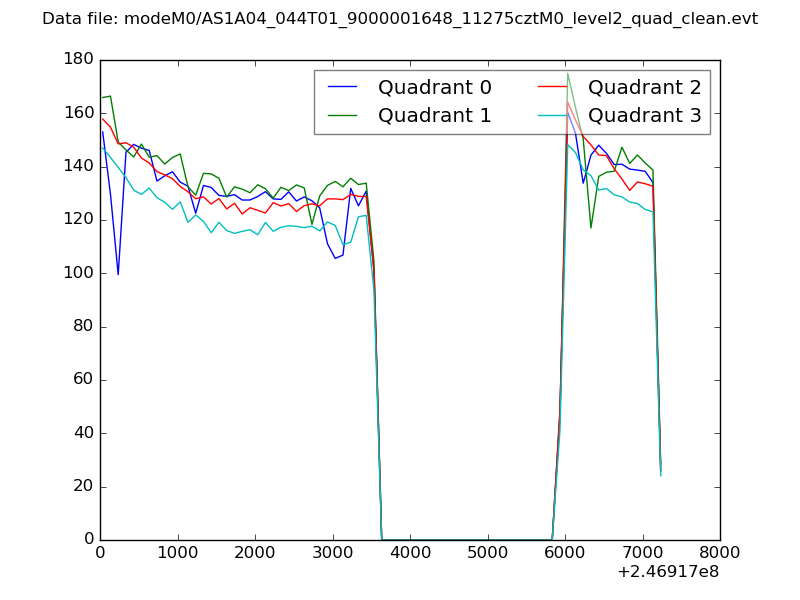 |
|
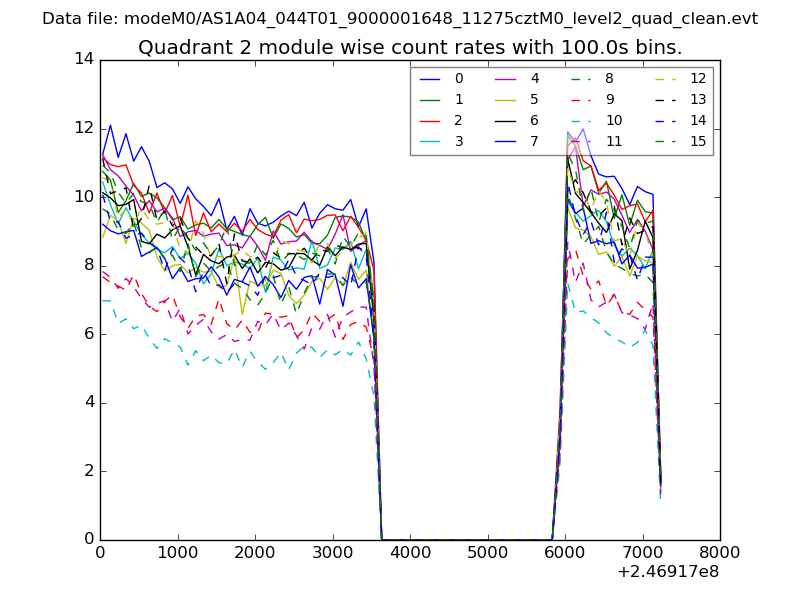
| Module-wise count rates for Quadrant A Data is divided into 100 sec bins |
 |
 |
| Module-wise count rates for Quadrant B Data is divided into 100 sec bins |
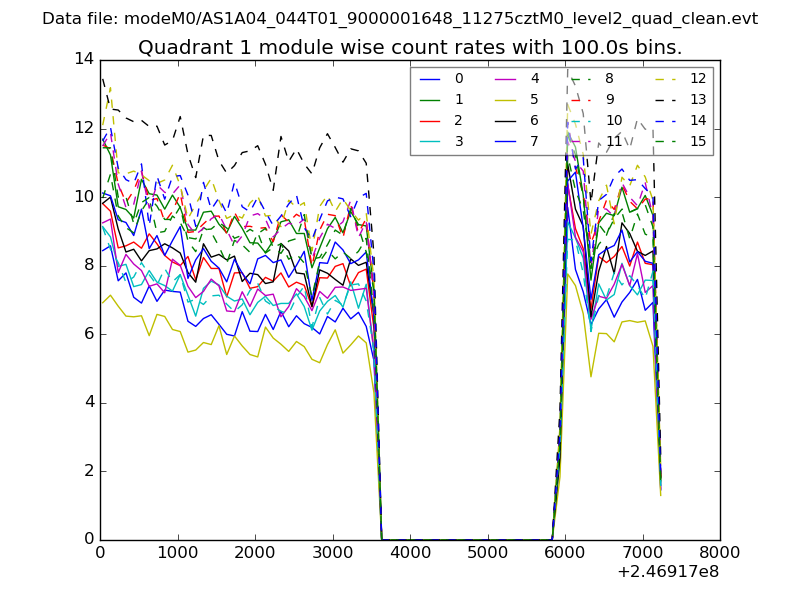 |
 |
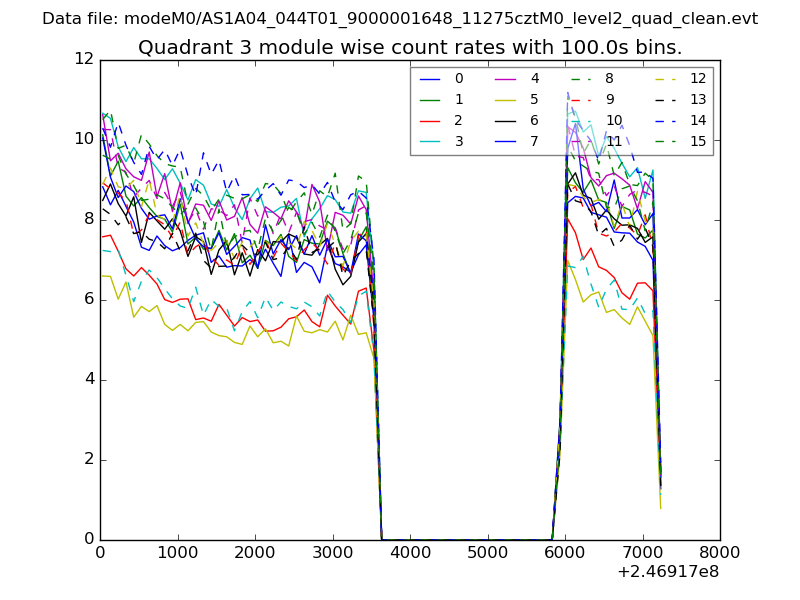
| Module-wise count rates for Quadrant C Data is divided into 100 sec bins |
 |
 |
| Module-wise count rates for Quadrant D Data is divided into 100 sec bins |
 |
 |
| Parameter | Plot |
|---|---|
| CZT HV Monitor | 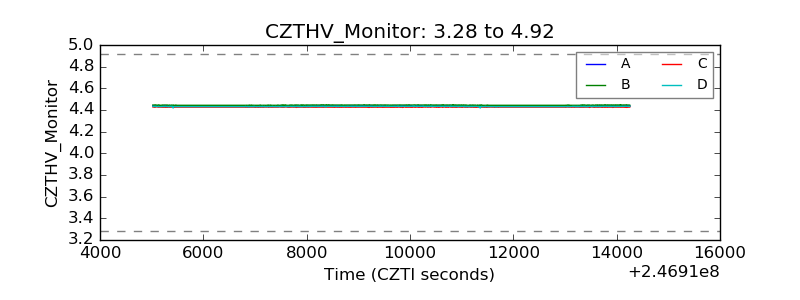 |
| D_VDD | 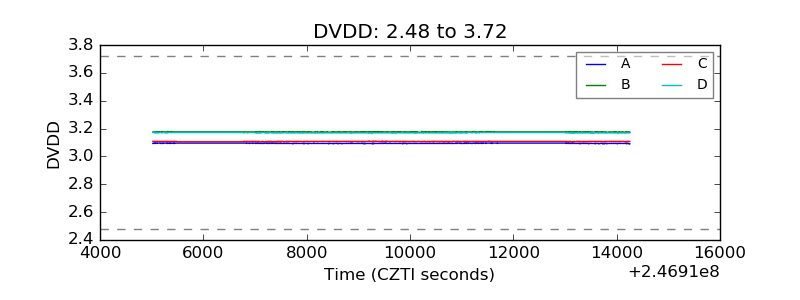 |
| Temperature 1 | 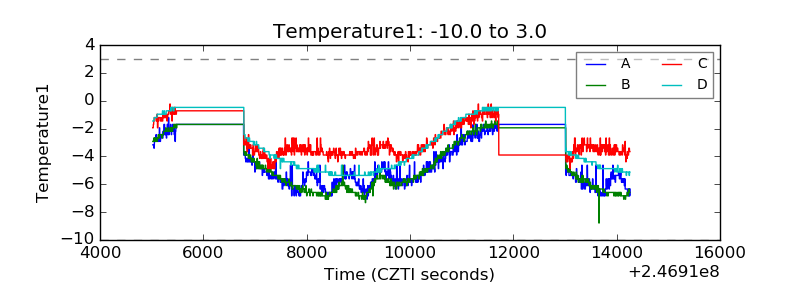 |
| Veto HV Monitor | 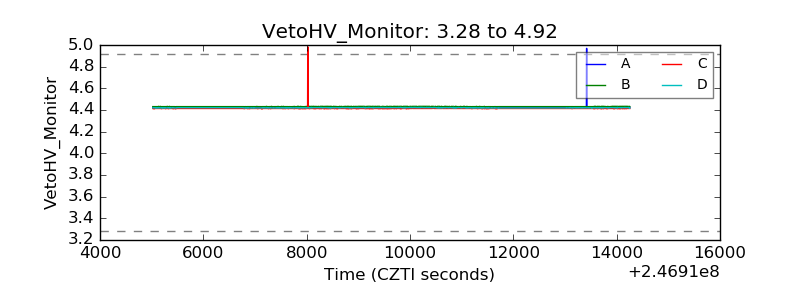 |
| Veto LLD |  |
| Alpha Counter | 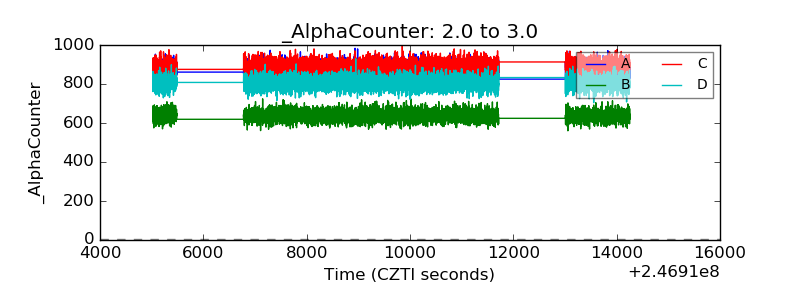 |
| _CPM_Rate | 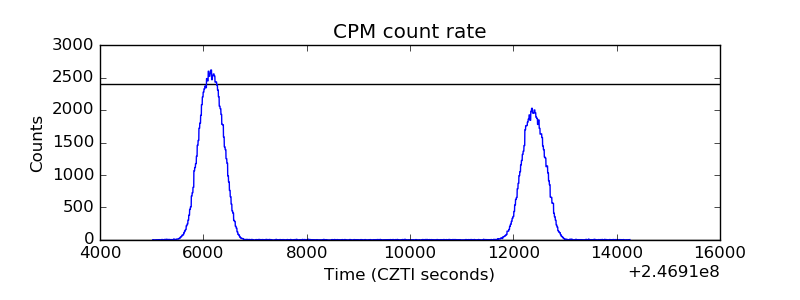 |
| CZT Counter | 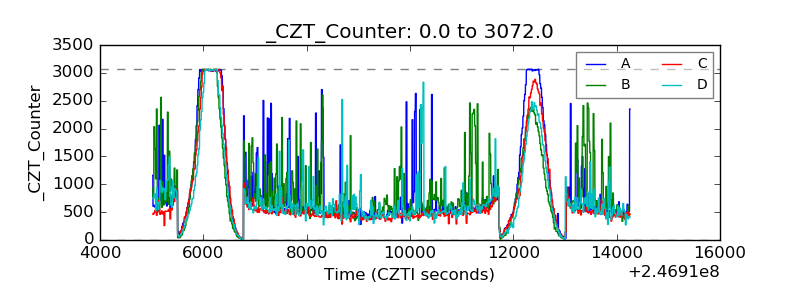 |
| +2.5 Volts monitor |  |
| +5 Volts monitor |  |
| _ROLL_ROT | 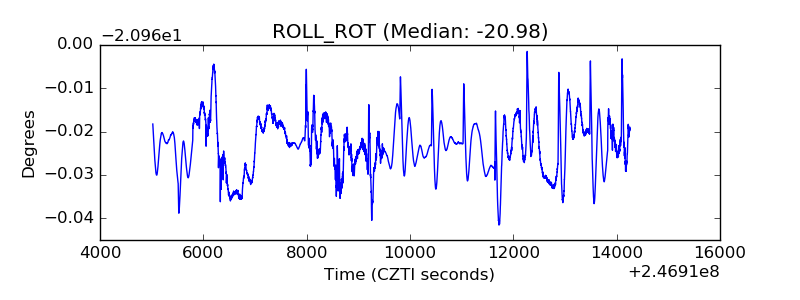 |
| _Roll_DEC | 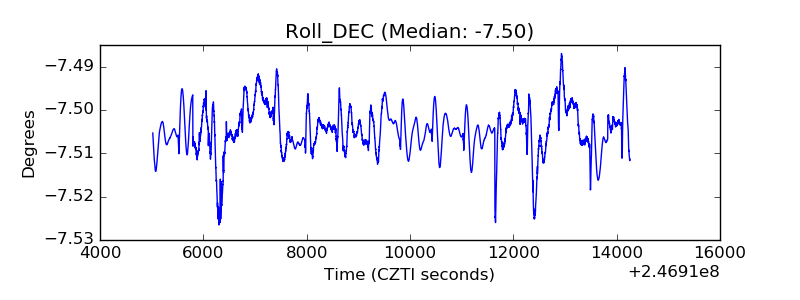 |
| _Roll_RA | 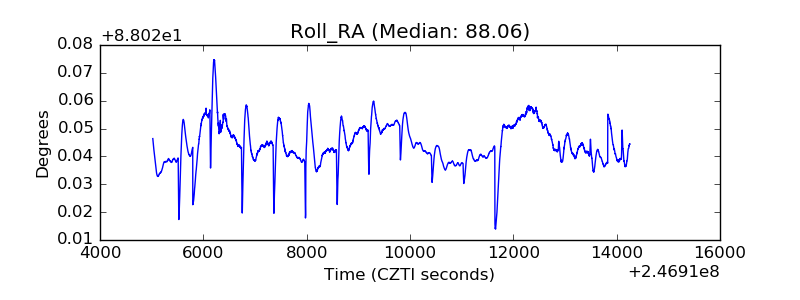 |
| Veto Counter | 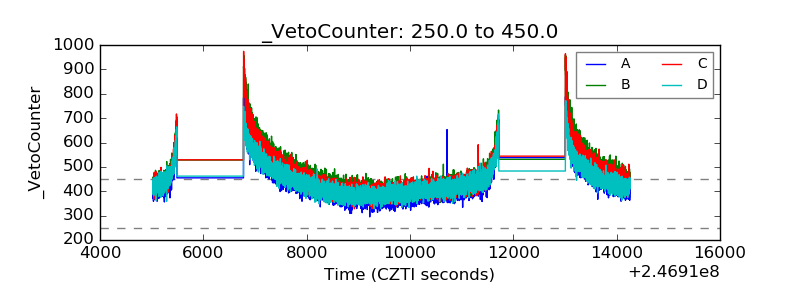 |