| Param | Original file | Final file |
|---|---|---|
| Filename | modeM0/AS1A04_044T01_9000001648_11276cztM0_level2.evt | modeM0/AS1A04_044T01_9000001648_11276cztM0_level2_quad_clean.evt |
| Size (bytes) | 572,037,120 | 101,125,440 |
| Size | 545.5 MB | 96.4 MB |
| Events in quadrant A | 4,310,108 | 649,562 |
| Events in quadrant B | 5,525,897 | 681,205 |
| Events in quadrant C | 3,075,813 | 660,896 |
| Events in quadrant D | 3,966,905 | 612,476 |
| Mode SS | |||
|---|---|---|---|
| Quadrant | BADHDUFLAG | Total packets | Discarded packets |
| A | 0 | 132 | 0 |
| B | 0 | 132 | 0 |
| C | 0 | 132 | 0 |
| D | 0 | 132 | 0 |
| Mode M9 | |||
|---|---|---|---|
| Quadrant | BADHDUFLAG | Total packets | Discarded packets |
| A | 0 | 22 | 0 |
| B | 0 | 22 | 0 |
| C | 0 | 22 | 0 |
| D | 0 | 23 | 0 |
| Mode M0 | |||
|---|---|---|---|
| Quadrant | BADHDUFLAG | Total packets | Discarded packets |
| A | 0 | 17064 | 3 |
| B | 0 | 20799 | 2 |
| C | 0 | 13558 | 2 |
| D | 0 | 16338 | 2 |
| Quadrant | Total seconds | Saturated seconds | Saturation percentage |
|---|---|---|---|
| A | 6576 | 363 | 5.520073% |
| B | 6576 | 781 | 11.876521% |
| C | 6576 | 10 | 0.152068% |
| D | 6576 | 146 | 2.220195% |
Noise dominated data is calculated using 1-second bins in cleaned event files. If a bin has >2000 counts, and if more than 50% of those come from <1% of pixels, then it is considered to be noise-dominated and hence unusable.
| Quadrant | # 1 sec bins | Bins with >0 counts | Bins with >2000 counts | High rate bins dominated by noise | Noise dominated (total time) | Noise dominated (detector-on time) | Marked lightcurve |
|---|---|---|---|---|---|---|---|
| A | 7831 | 6577 | 246 | 246 | 3.14% | 3.74% | 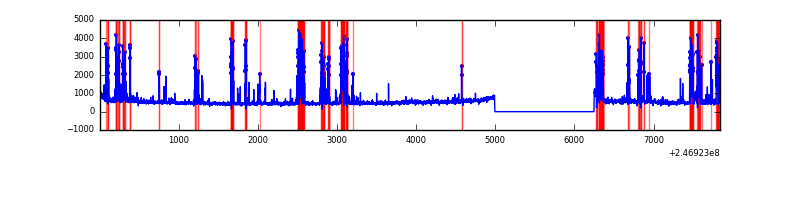 |
| B | 7831 | 6576 | 384 | 384 | 4.90% | 5.84% | 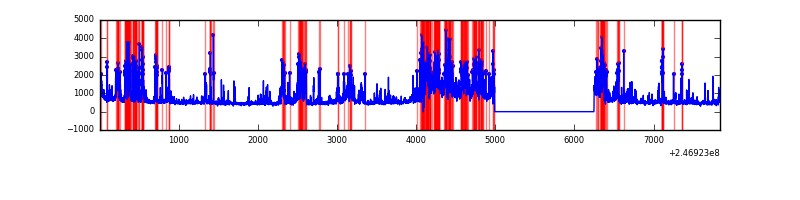 |
| C | 7831 | 6577 | 0 | 0 | 0.00% | 0.00% | 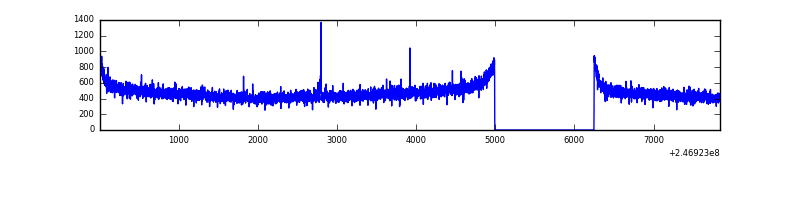 |
| D | 7831 | 6577 | 111 | 111 | 1.42% | 1.69% | 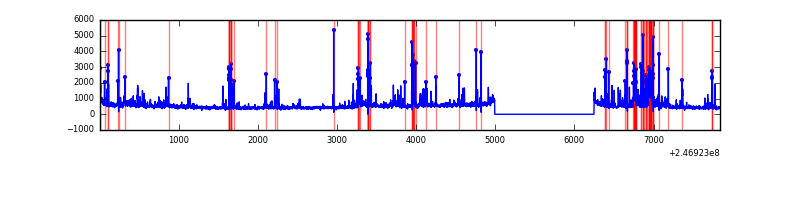 |
Top three noisy pixels from each quadrant. If the there are fewer than three noisy pixels in the level2.evt file, extra rows are filled as -1
| Pixel properties | Quadrant properties | ||||||
|---|---|---|---|---|---|---|---|
| Quadrant | DetID | PixID | Counts | Sigma | Mean | Median | Sigma |
| A | 14 | 238 | 979692 | 6095.13 | 786 | 772 | 160.6 |
| A | 8 | 5 | 159368 | 987.48 | 786 | 772 | 160.6 |
| A | 1 | 162 | 48071 | 294.5 | 786 | 772 | 160.6 |
| B | 4 | 239 | 1095828 | 7349.57 | 785 | 766 | 149.0 |
| B | 3 | 64 | 980663 | 6576.63 | 785 | 766 | 149.0 |
| B | 0 | 214 | 195650 | 1307.97 | 785 | 766 | 149.0 |
| C | 9 | 54 | 7451 | 36.16 | 787 | 791 | 184.2 |
| C | 13 | 61 | 5788 | 27.13 | 787 | 791 | 184.2 |
| C | 3 | 202 | 1866 | 5.84 | 787 | 791 | 184.2 |
| D | 10 | 253 | 200842 | 1089.35 | 764 | 744 | 183.7 |
| D | 2 | 120 | 169496 | 918.7 | 764 | 744 | 183.7 |
| D | 13 | 152 | 168151 | 911.38 | 764 | 744 | 183.7 |
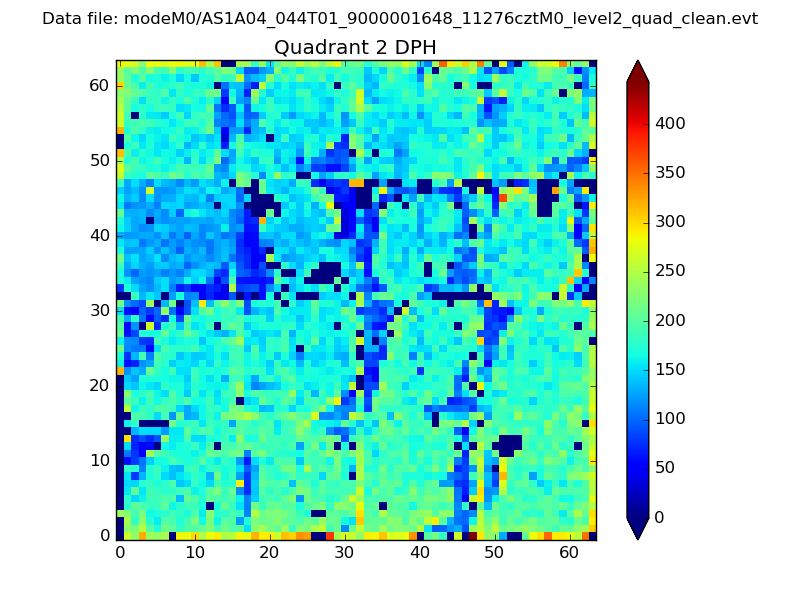
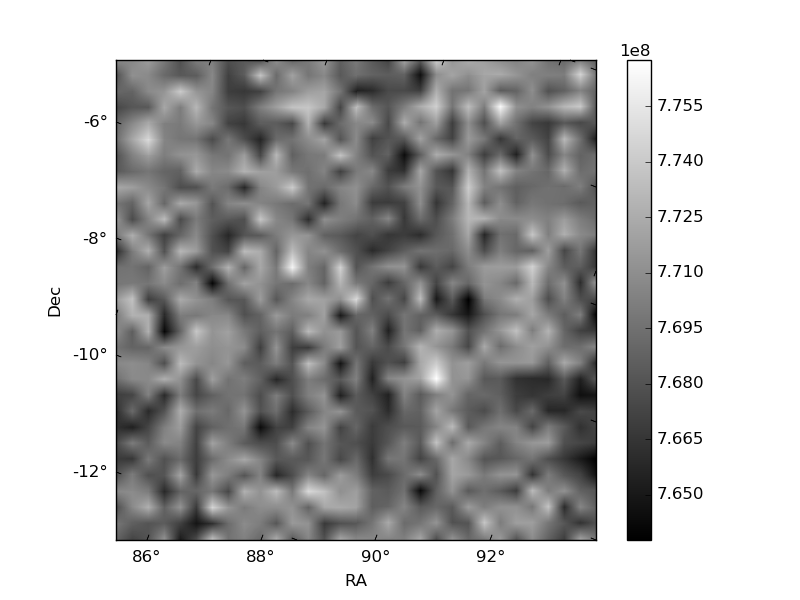
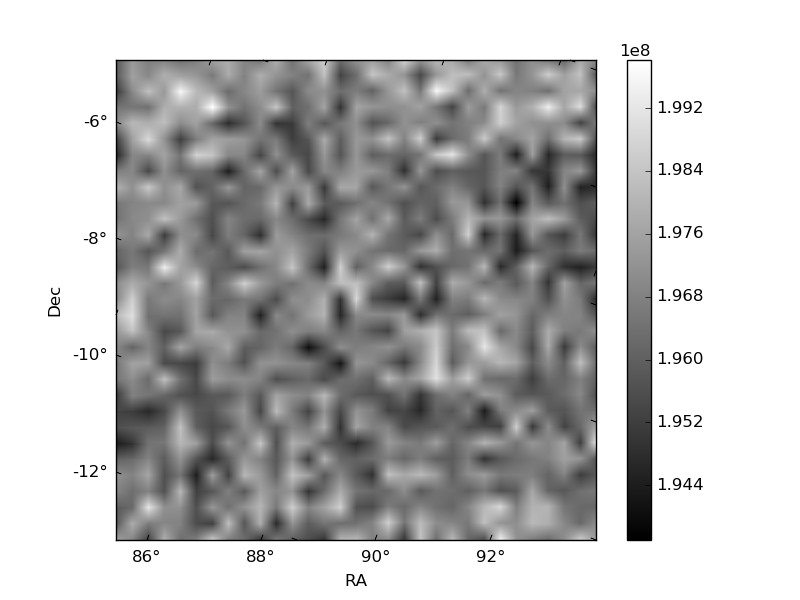
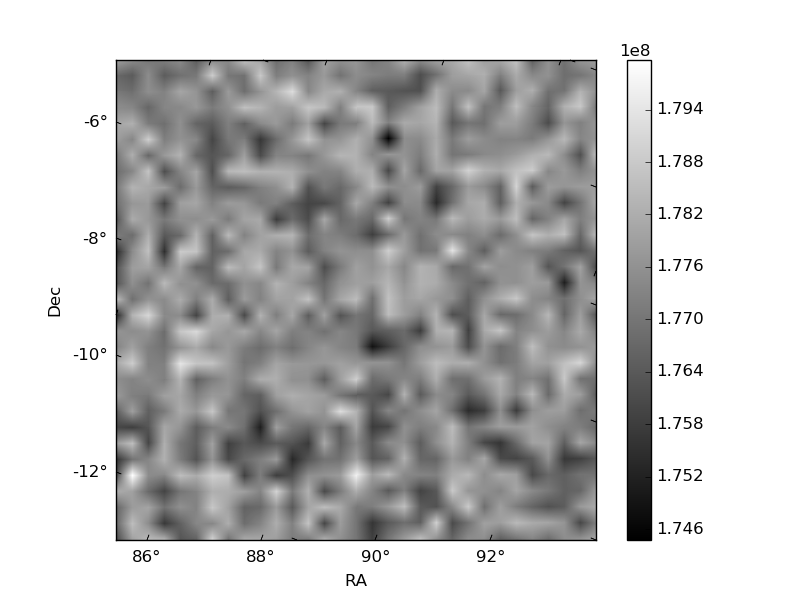
Histogram calculated using DETX and DETY for each event in the final _common_clean file
| Quadrant A | 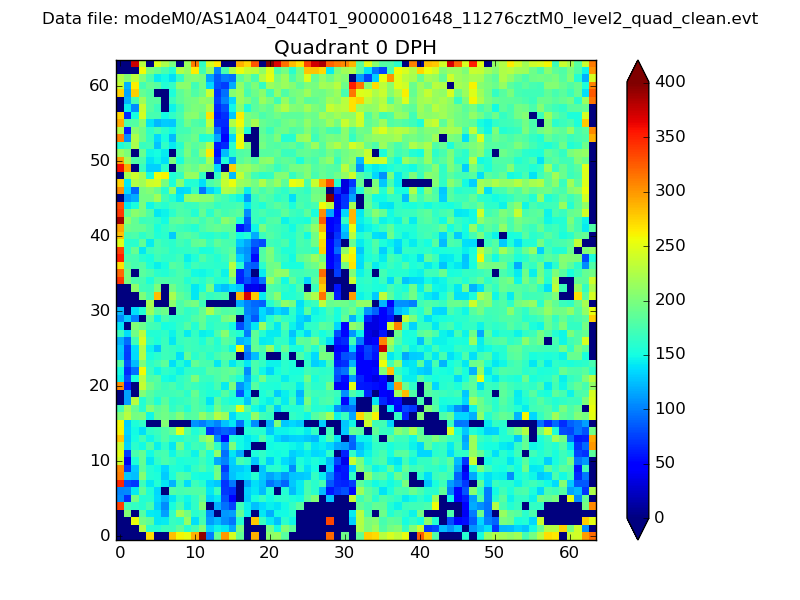 |
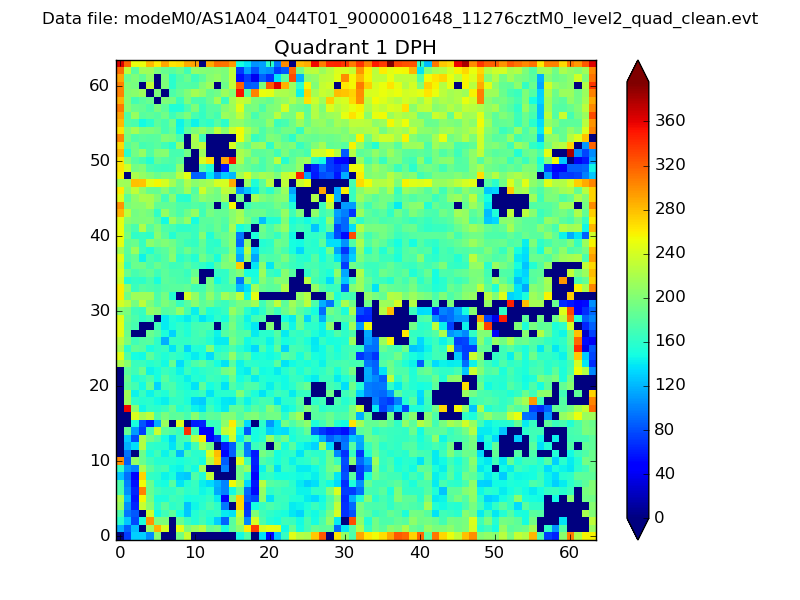 |
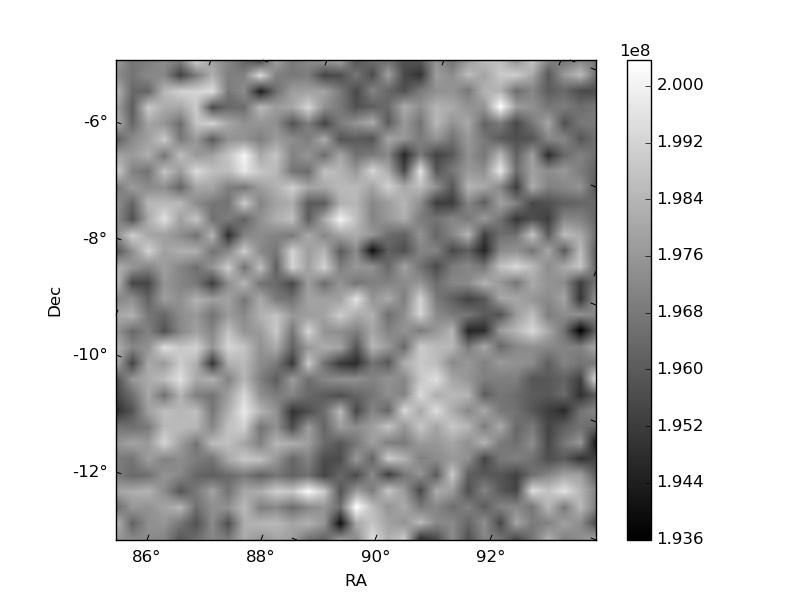
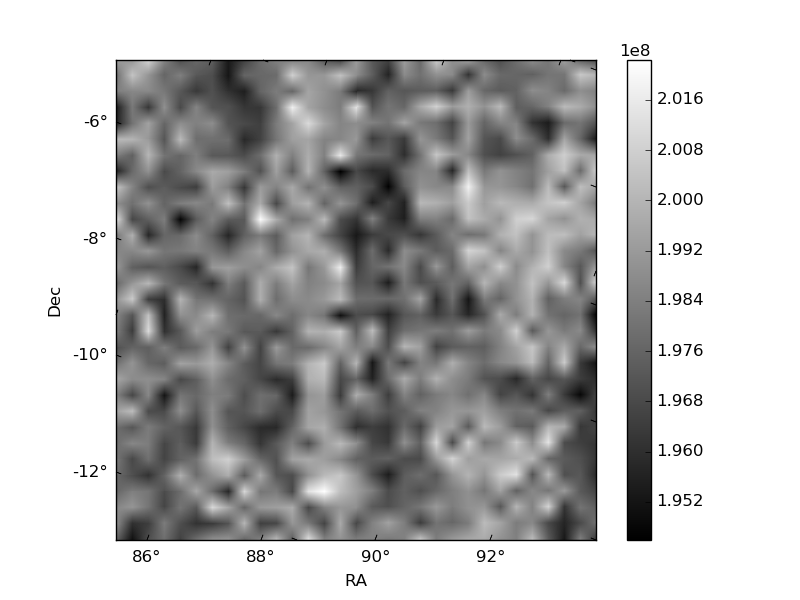
Quadrant B |
|---|---|---|---|
| Quadrant D | 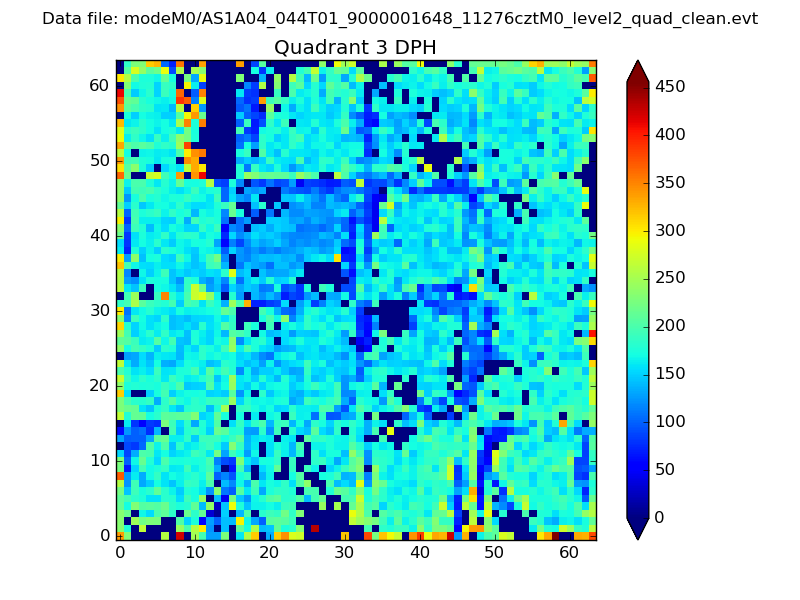 |
 |
Quadrant C |
| Plot type | Count rate plots | Images |
|---|---|---|
| Comparison with Poisson distribution Blue bars denote a histogram of data divided into 1 sec bins. Red curve is a Poisson curve with rate = median count rate of data. |
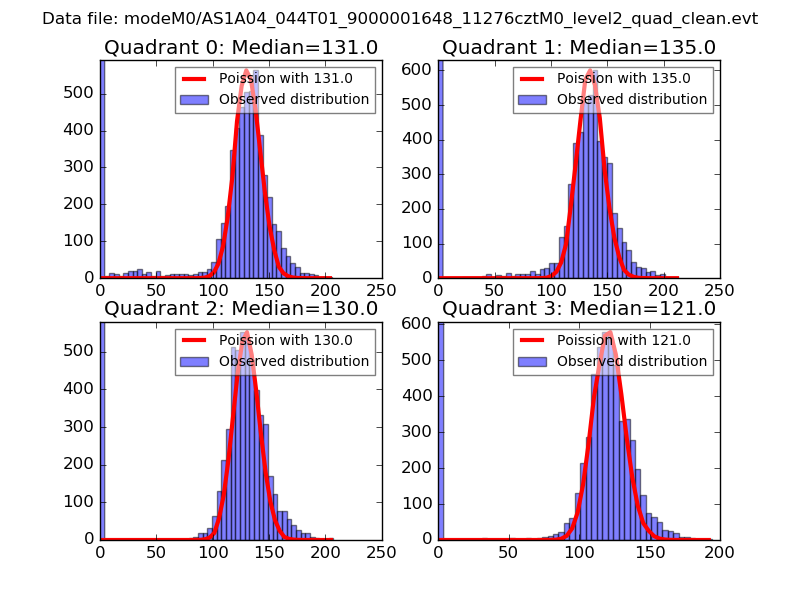 |
 |
| Quadrant-wise count rates Data is divided into 100 sec bins |
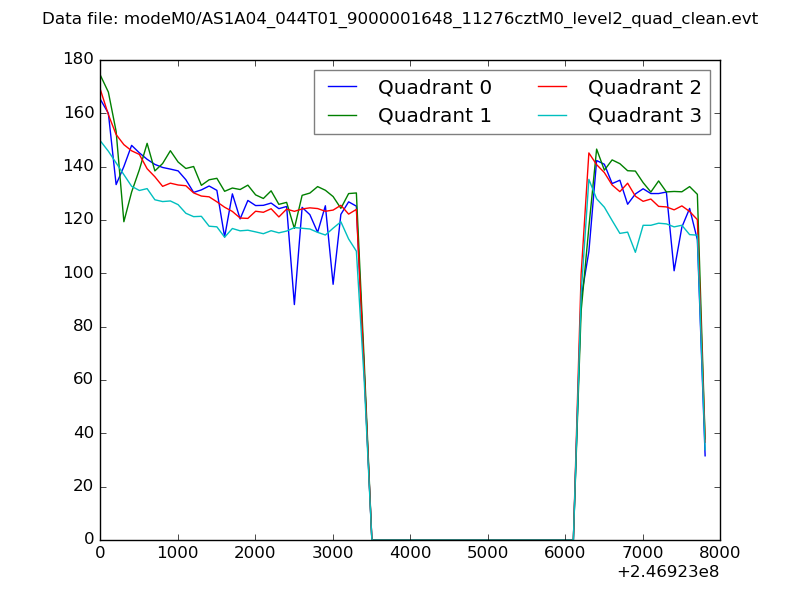 |
|
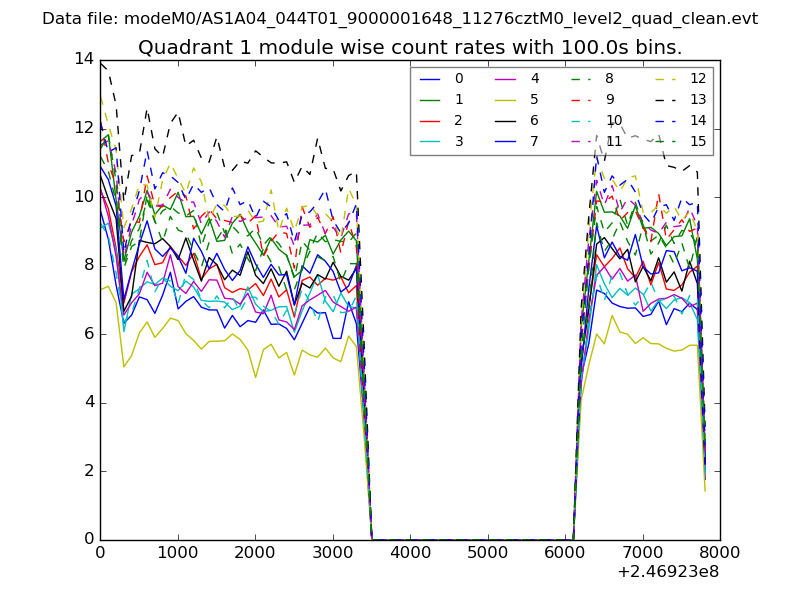
| Module-wise count rates for Quadrant A Data is divided into 100 sec bins |
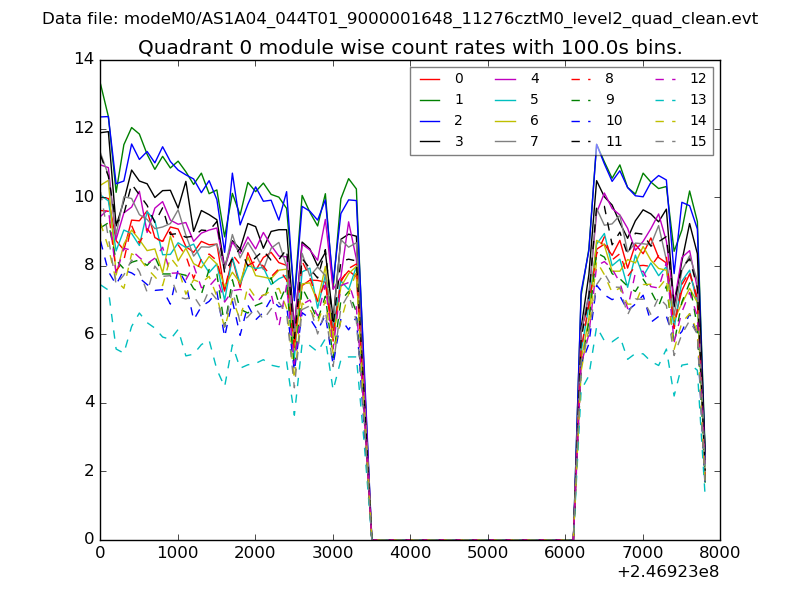 |
 |
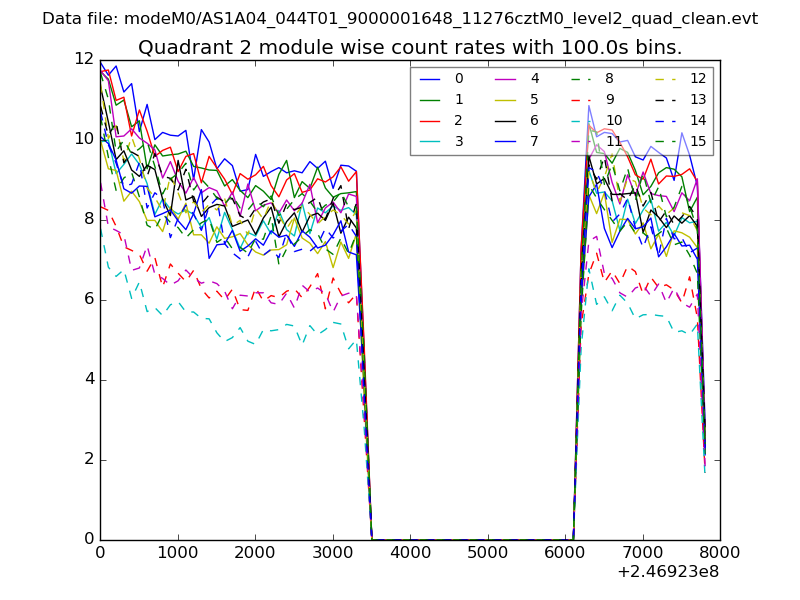
| Module-wise count rates for Quadrant B Data is divided into 100 sec bins |
 |
 |
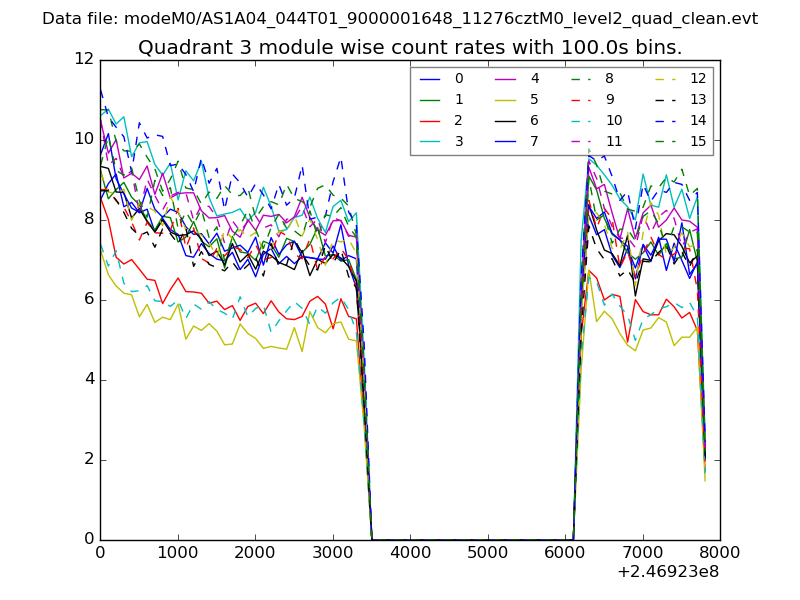
| Module-wise count rates for Quadrant C Data is divided into 100 sec bins |
 |
 |
| Module-wise count rates for Quadrant D Data is divided into 100 sec bins |
 |
 |
| Parameter | Plot |
|---|---|
| CZT HV Monitor | 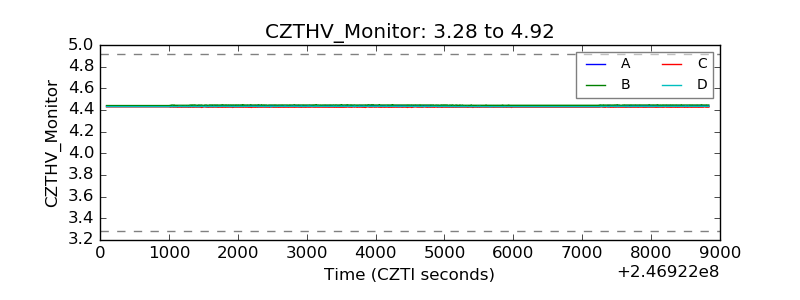 |
| D_VDD | 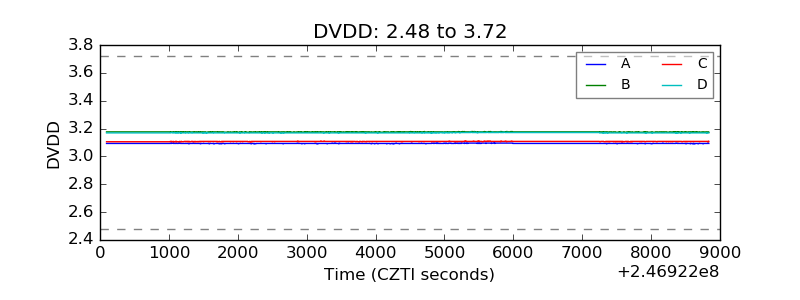 |
| Temperature 1 | 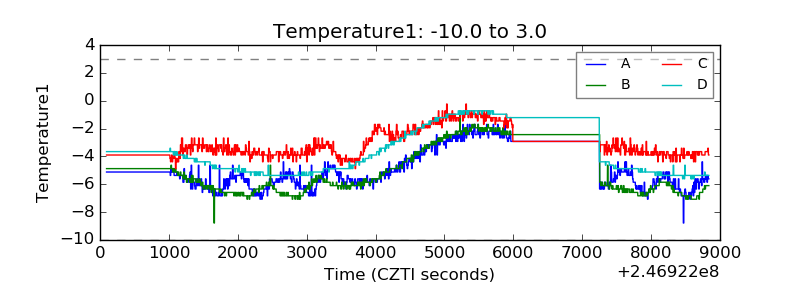 |
| Veto HV Monitor | 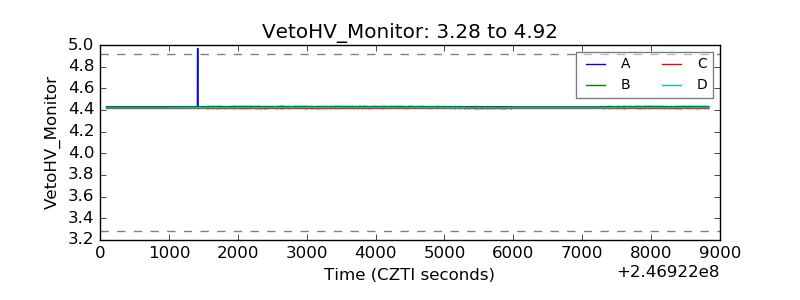 |
| Veto LLD | 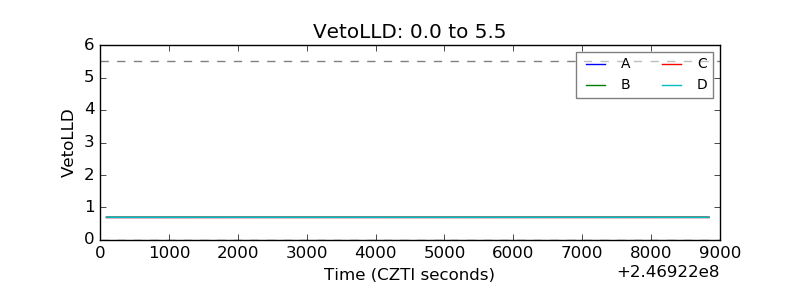 |
| Alpha Counter | 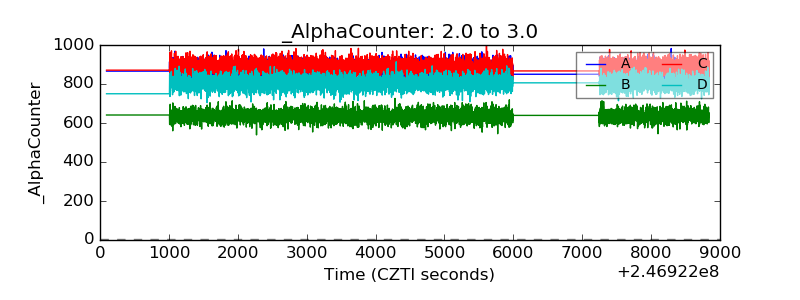 |
| _CPM_Rate | 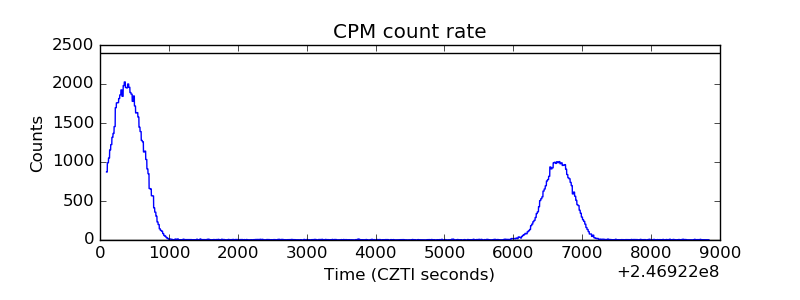 |
| CZT Counter | 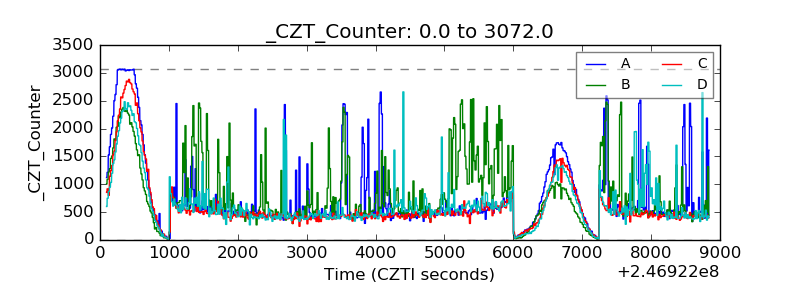 |
| +2.5 Volts monitor | 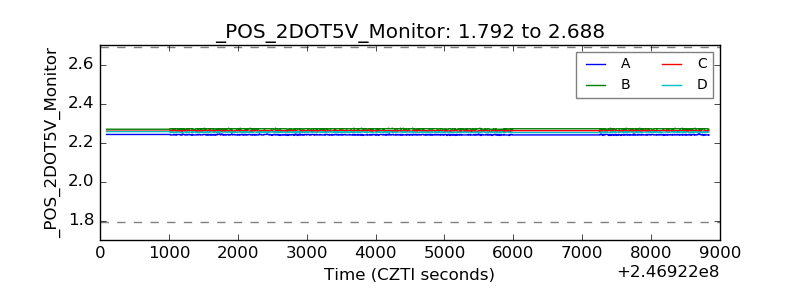 |
| +5 Volts monitor |  |
| _ROLL_ROT | 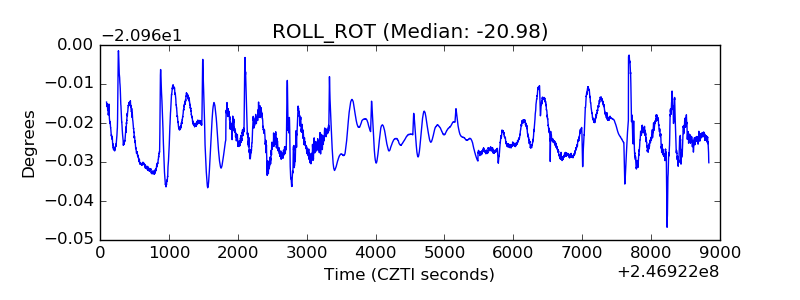 |
| _Roll_DEC | 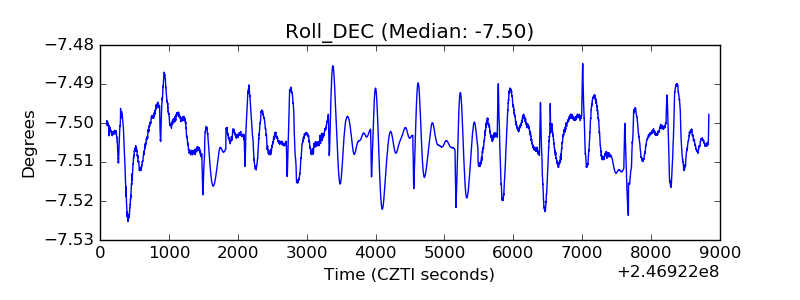 |
| _Roll_RA | 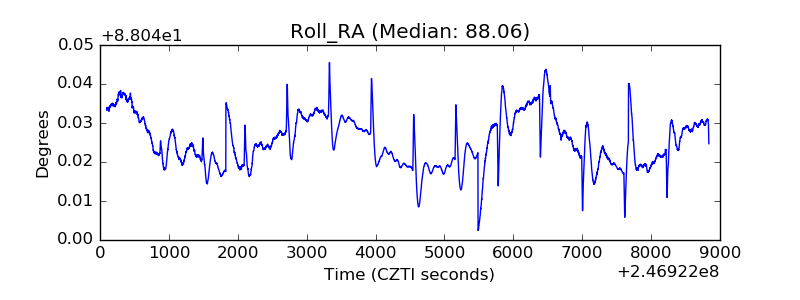 |
| Veto Counter | 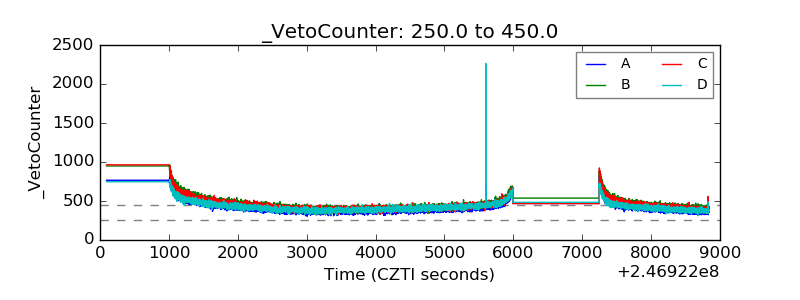 |