| Param | Original file | Final file |
|---|---|---|
| Filename | modeM0/AS1A04_044T01_9000001648_11278cztM0_level2.evt | modeM0/AS1A04_044T01_9000001648_11278cztM0_level2_quad_clean.evt |
| Size (bytes) | 1,609,099,200 | 216,357,120 |
| Size | 1.5 GB | 206.3 MB |
| Events in quadrant A | 11,595,698 | 1,364,249 |
| Events in quadrant B | 13,129,854 | 1,418,609 |
| Events in quadrant C | 7,799,853 | 1,376,803 |
| Events in quadrant D | 15,058,445 | 1,218,423 |
| Mode SS | |||
|---|---|---|---|
| Quadrant | BADHDUFLAG | Total packets | Discarded packets |
| A | 0 | 346 | 0 |
| B | 0 | 346 | 0 |
| C | 0 | 346 | 0 |
| D | 0 | 346 | 0 |
| Mode M9 | |||
|---|---|---|---|
| Quadrant | BADHDUFLAG | Total packets | Discarded packets |
| A | 0 | 29 | 0 |
| B | 0 | 29 | 0 |
| C | 0 | 29 | 0 |
| D | 0 | 29 | 0 |
| Mode M0 | |||
|---|---|---|---|
| Quadrant | BADHDUFLAG | Total packets | Discarded packets |
| A | 0 | 45569 | 5 |
| B | 0 | 50487 | 4 |
| C | 0 | 34963 | 4 |
| D | 0 | 56480 | 4 |
| Quadrant | Total seconds | Saturated seconds | Saturation percentage |
|---|---|---|---|
| A | 17025 | 1115 | 6.549192% |
| B | 17025 | 1744 | 10.243759% |
| C | 17025 | 79 | 0.464023% |
| D | 17025 | 2648 | 15.553598% |
Noise dominated data is calculated using 1-second bins in cleaned event files. If a bin has >2000 counts, and if more than 50% of those come from <1% of pixels, then it is considered to be noise-dominated and hence unusable.
| Quadrant | # 1 sec bins | Bins with >0 counts | Bins with >2000 counts | High rate bins dominated by noise | Noise dominated (total time) | Noise dominated (detector-on time) | Marked lightcurve |
|---|---|---|---|---|---|---|---|
| A | 19935 | 17028 | 738 | 738 | 3.70% | 4.33% | 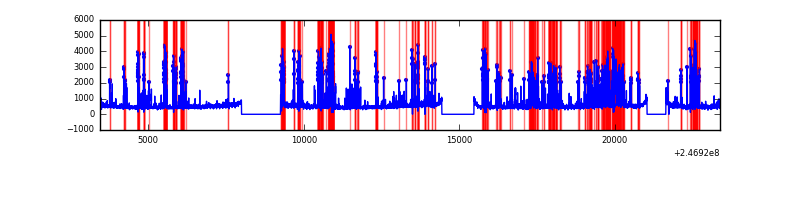 |
| B | 19935 | 17027 | 852 | 852 | 4.27% | 5.00% | 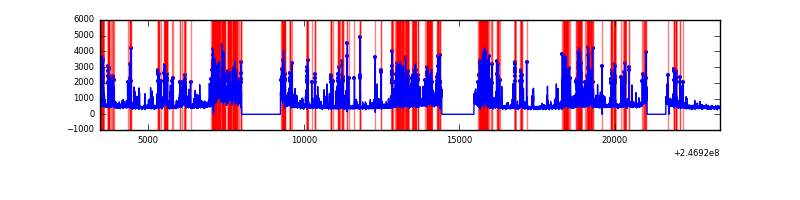 |
| C | 19935 | 17029 | 0 | 0 | 0.00% | 0.00% | 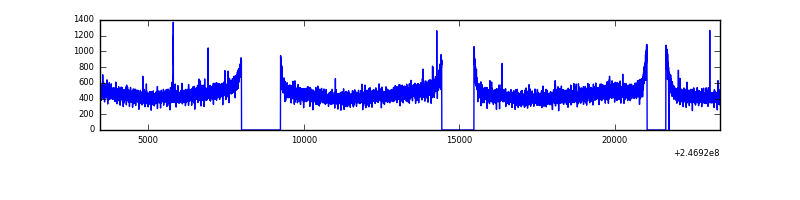 |
| D | 19935 | 17027 | 2085 | 2085 | 10.46% | 12.25% | 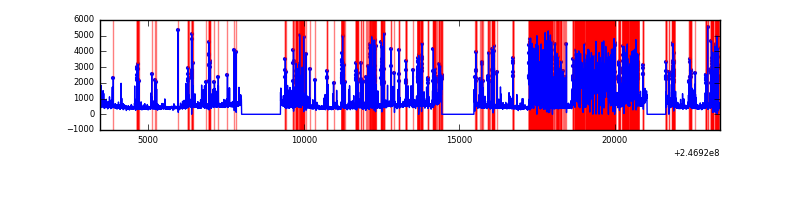 |
Top three noisy pixels from each quadrant. If the there are fewer than three noisy pixels in the level2.evt file, extra rows are filled as -1
| Pixel properties | Quadrant properties | ||||||
|---|---|---|---|---|---|---|---|
| Quadrant | DetID | PixID | Counts | Sigma | Mean | Median | Sigma |
| A | 8 | 5 | 1885462 | 4692.78 | 1993 | 1956 | 401.4 |
| A | 14 | 238 | 1690055 | 4205.92 | 1993 | 1956 | 401.4 |
| A | 8 | 15 | 93763 | 228.74 | 1993 | 1956 | 401.4 |
| B | 3 | 64 | 2397720 | 6311.07 | 1992 | 1945 | 379.6 |
| B | 4 | 239 | 2297097 | 6046.0 | 1992 | 1945 | 379.6 |
| B | 0 | 214 | 216044 | 563.99 | 1992 | 1945 | 379.6 |
| C | 13 | 61 | 14699 | 27.23 | 1998 | 2012 | 465.9 |
| C | 9 | 54 | 8568 | 14.07 | 1998 | 2012 | 465.9 |
| C | 8 | 128 | 6049 | 8.67 | 1998 | 2012 | 465.9 |
| D | 13 | 152 | 3355376 | 7765.25 | 1793 | 1743 | 431.9 |
| D | 10 | 253 | 2415662 | 5589.37 | 1793 | 1743 | 431.9 |
| D | 1 | 52 | 1109731 | 2565.52 | 1793 | 1743 | 431.9 |
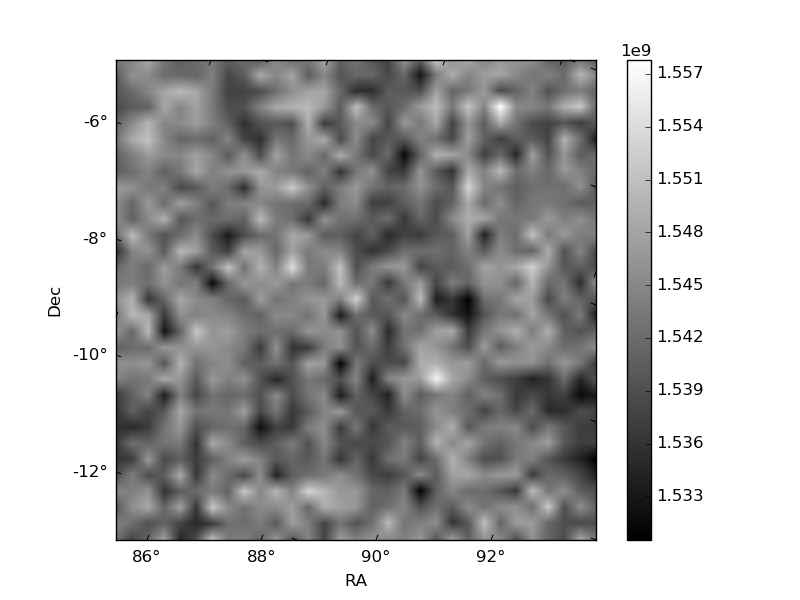
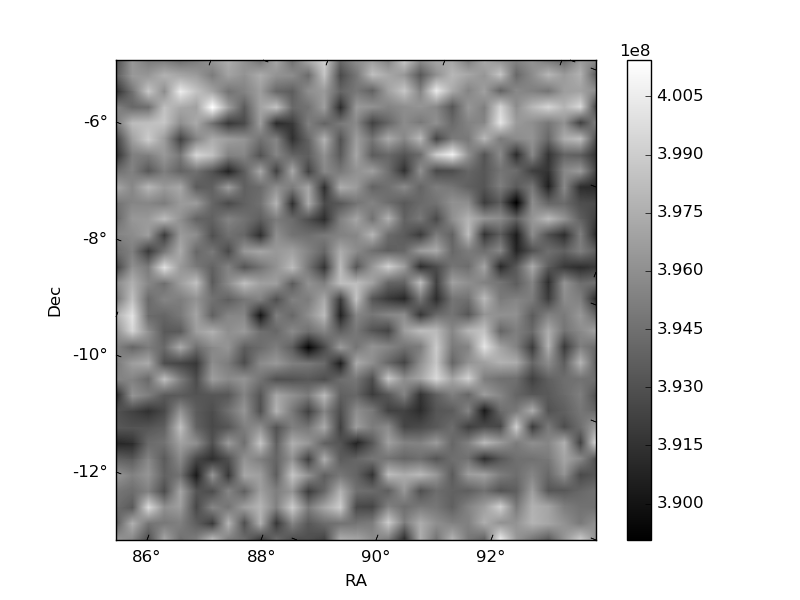
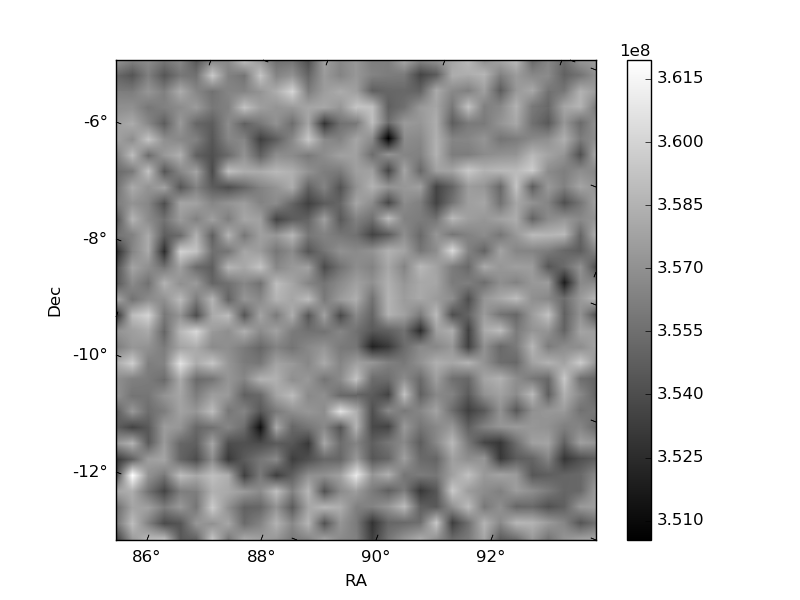
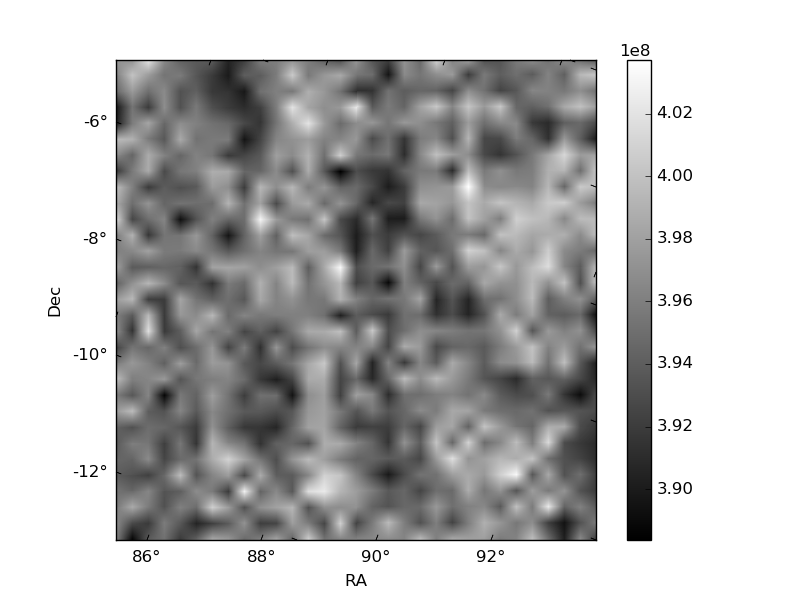
Histogram calculated using DETX and DETY for each event in the final _common_clean file
| Quadrant A | 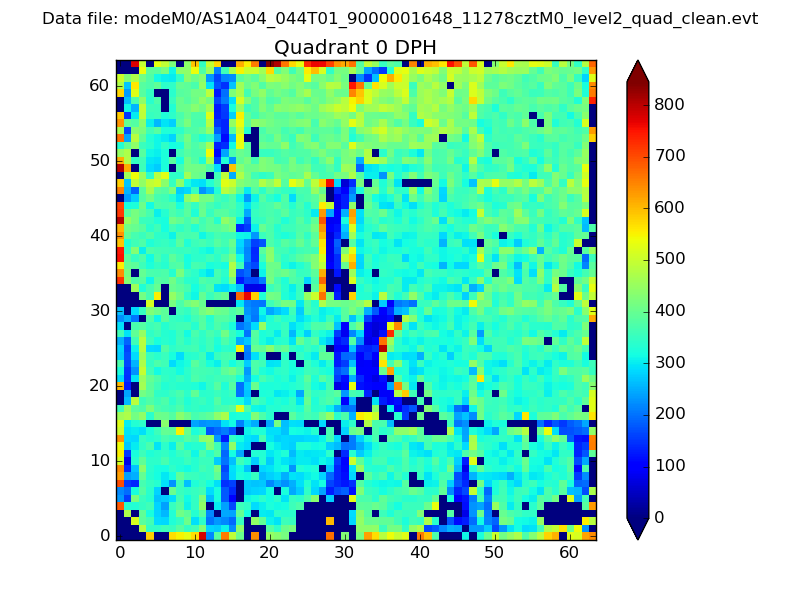 |
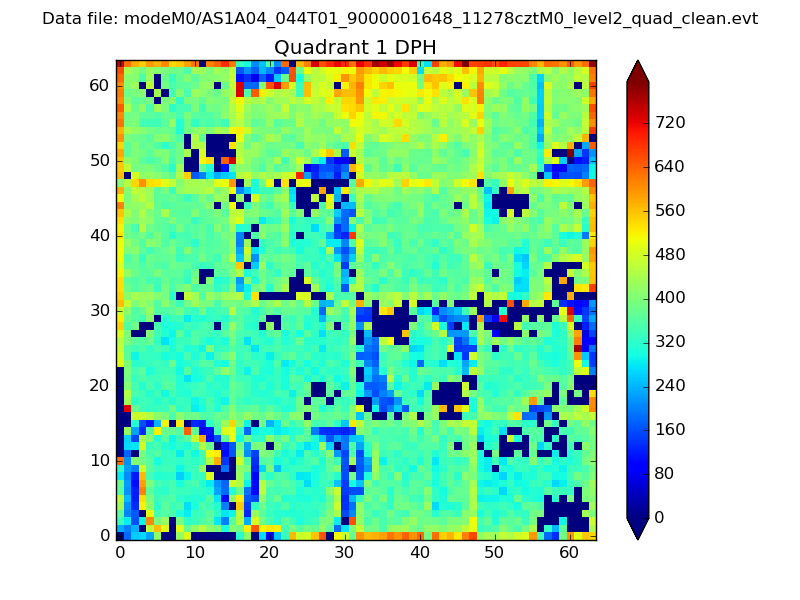 |
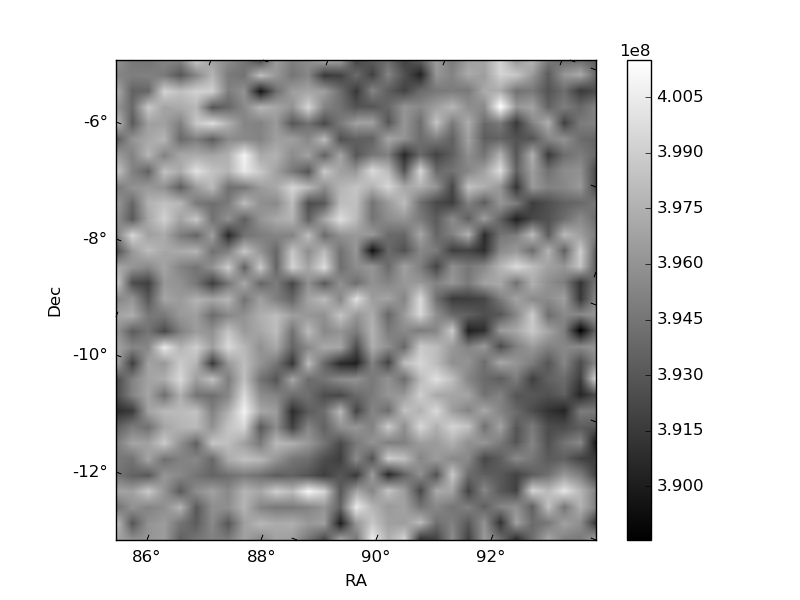
Quadrant B |
|---|---|---|---|
| Quadrant D | 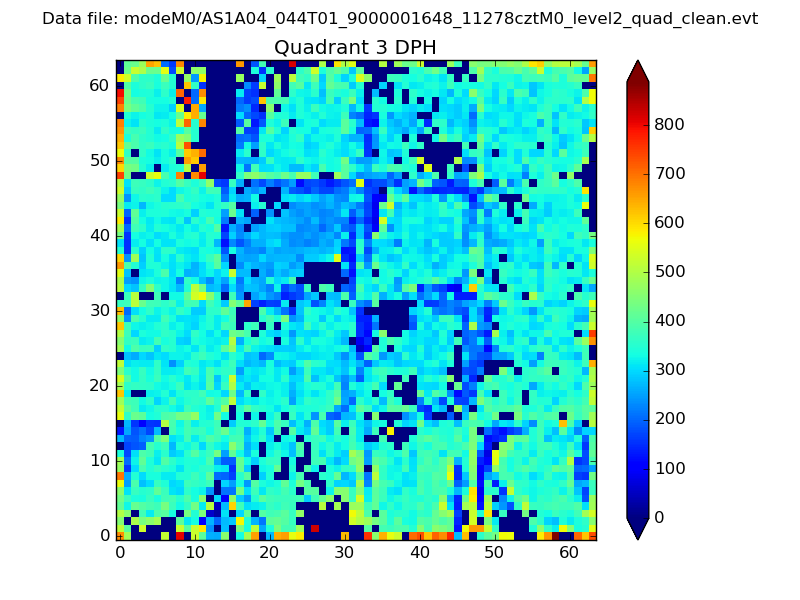 |
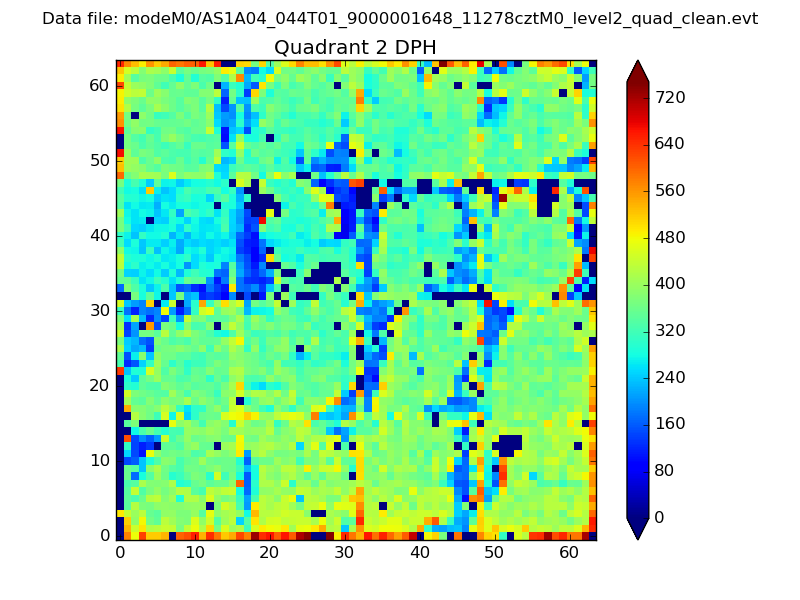 |
Quadrant C |
| Plot type | Count rate plots | Images |
|---|---|---|
| Comparison with Poisson distribution Blue bars denote a histogram of data divided into 1 sec bins. Red curve is a Poisson curve with rate = median count rate of data. |
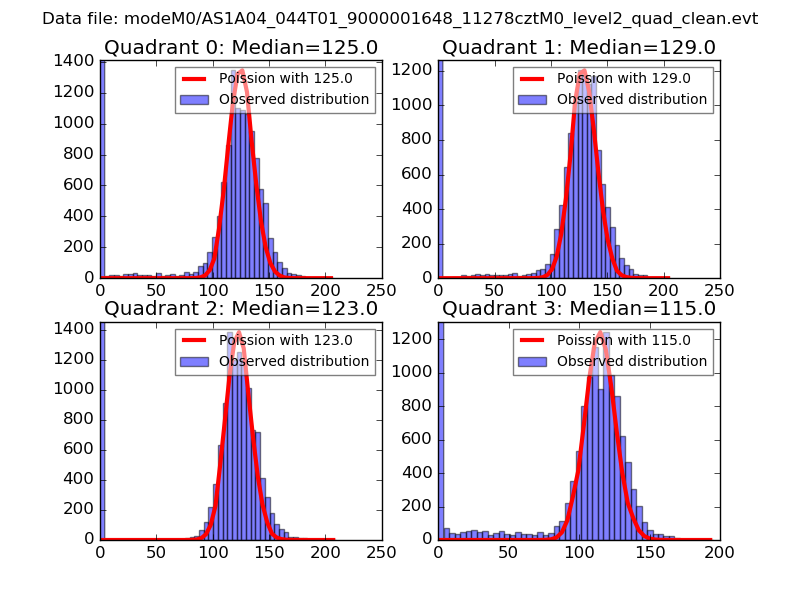 |
 |
| Quadrant-wise count rates Data is divided into 100 sec bins |
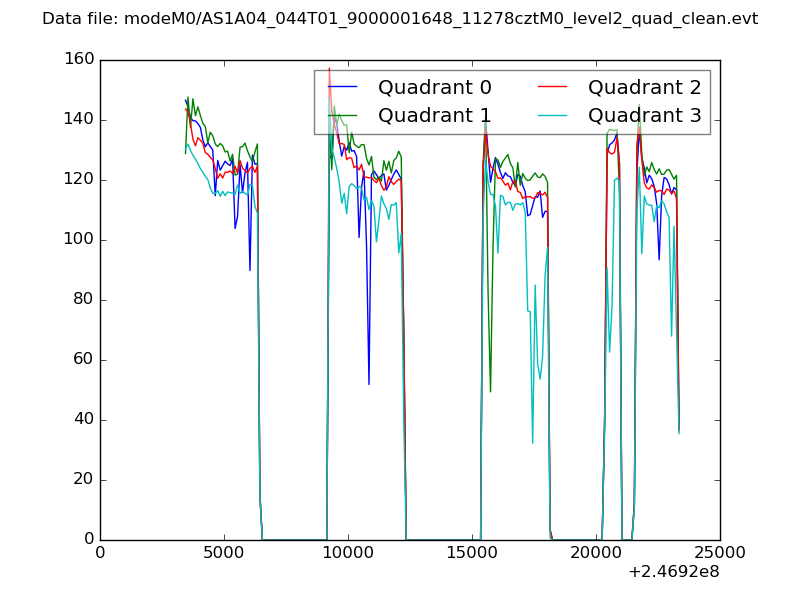 |
|
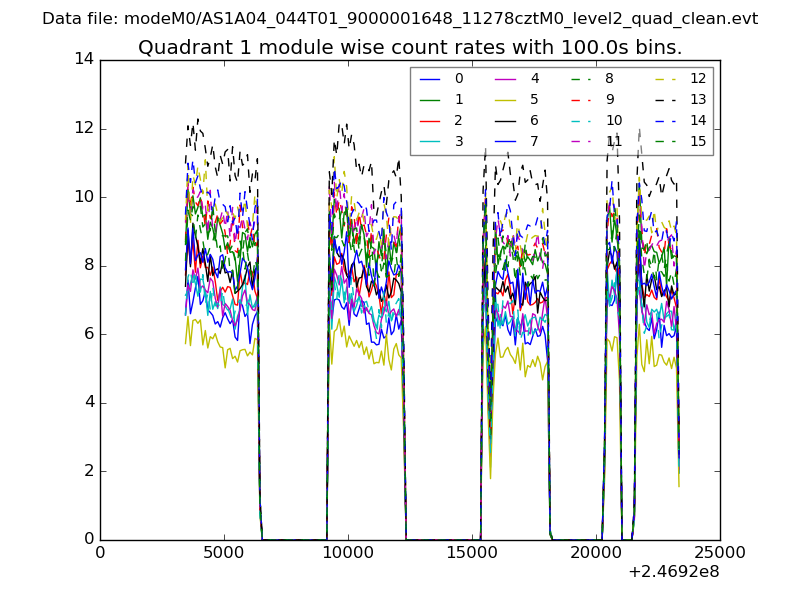
| Module-wise count rates for Quadrant A Data is divided into 100 sec bins |
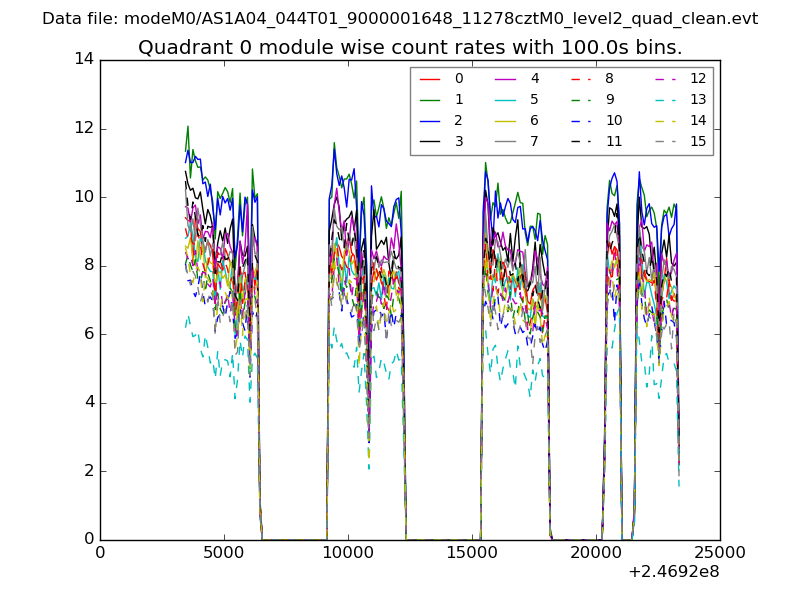 |
 |
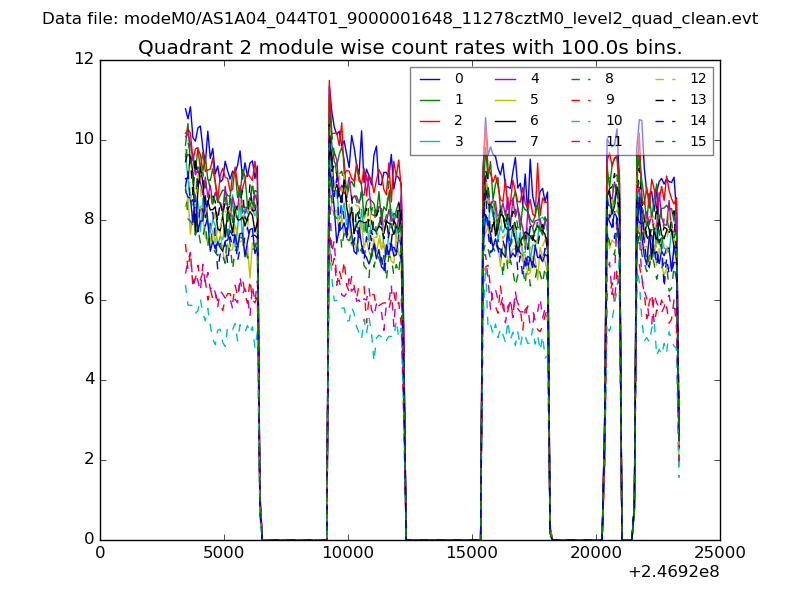
| Module-wise count rates for Quadrant B Data is divided into 100 sec bins |
 |
 |
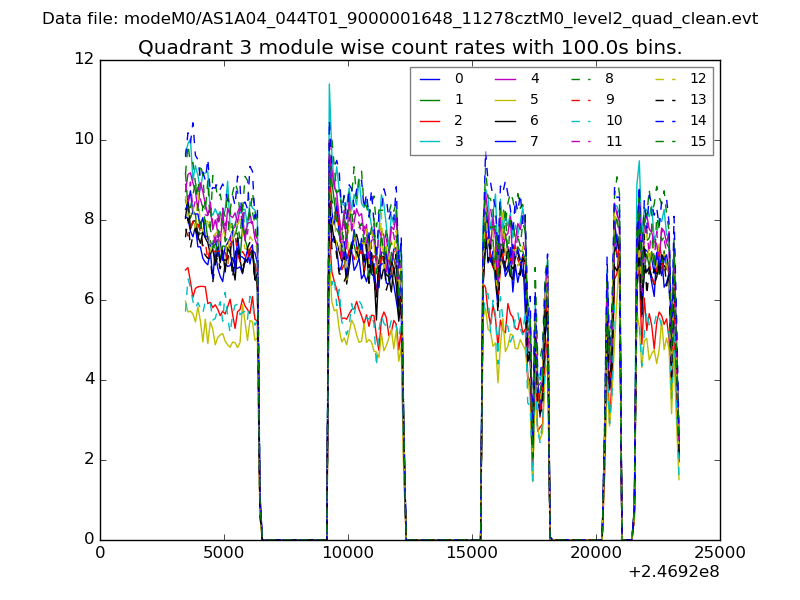
| Module-wise count rates for Quadrant C Data is divided into 100 sec bins |
 |
 |
| Module-wise count rates for Quadrant D Data is divided into 100 sec bins |
 |
 |
| Parameter | Plot |
|---|---|
| CZT HV Monitor | 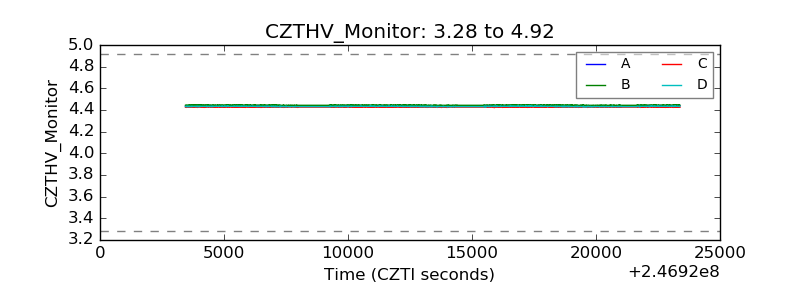 |
| D_VDD | 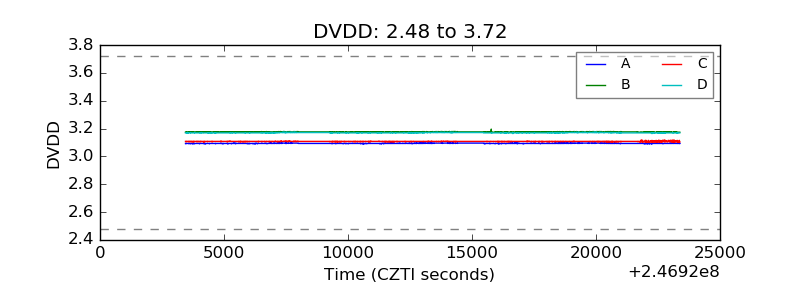 |
| Temperature 1 | 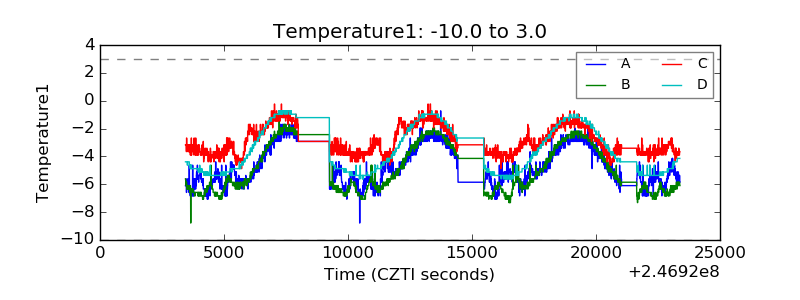 |
| Veto HV Monitor | 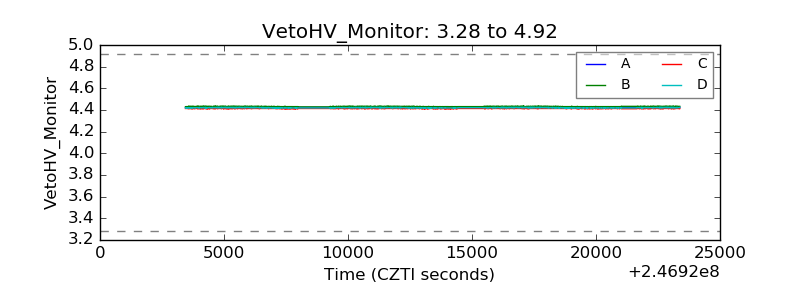 |
| Veto LLD | 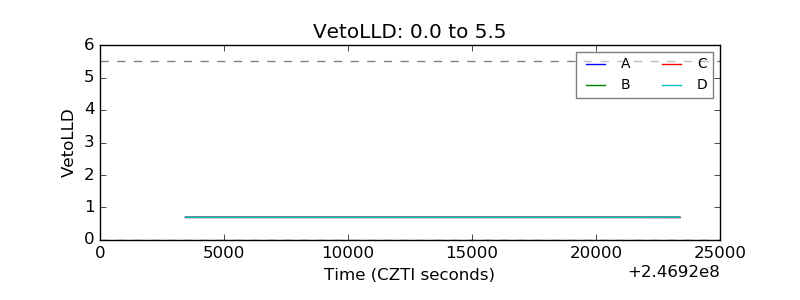 |
| Alpha Counter | 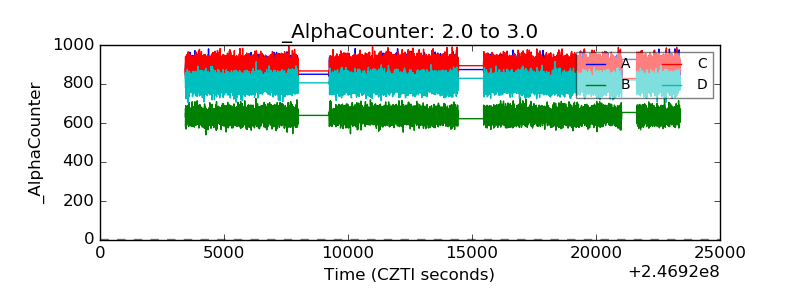 |
| _CPM_Rate | 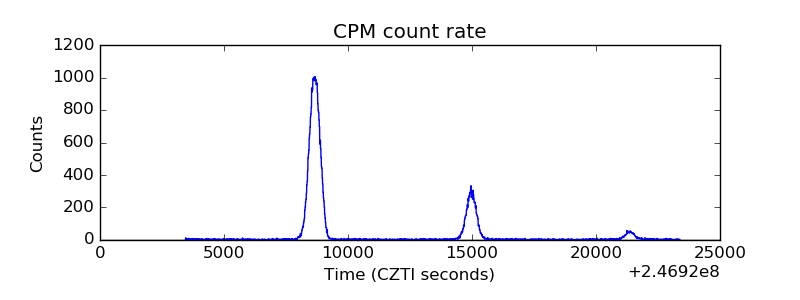 |
| CZT Counter | 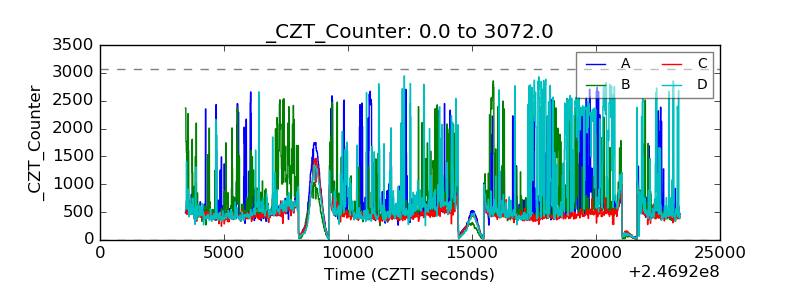 |
| +2.5 Volts monitor | 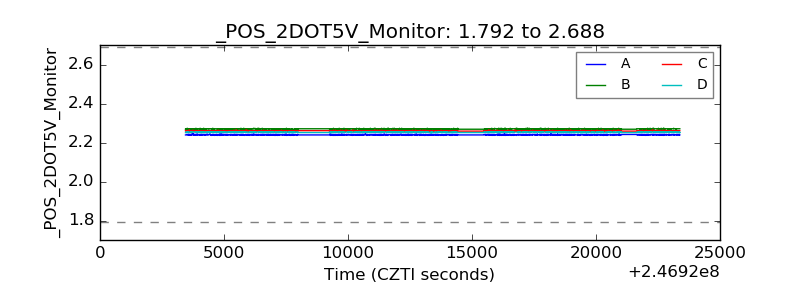 |
| +5 Volts monitor |  |
| _ROLL_ROT | 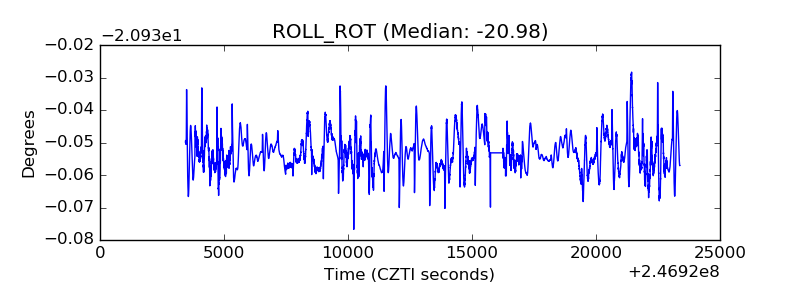 |
| _Roll_DEC | 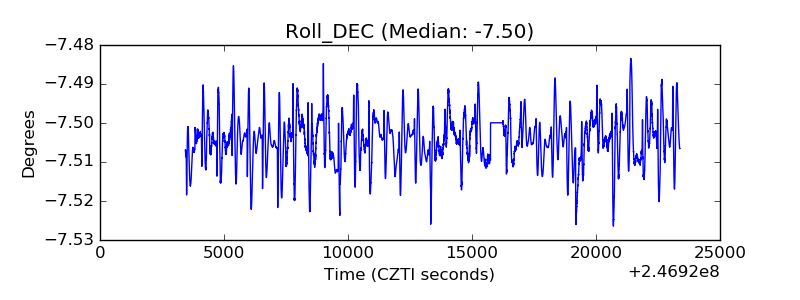 |
| _Roll_RA | 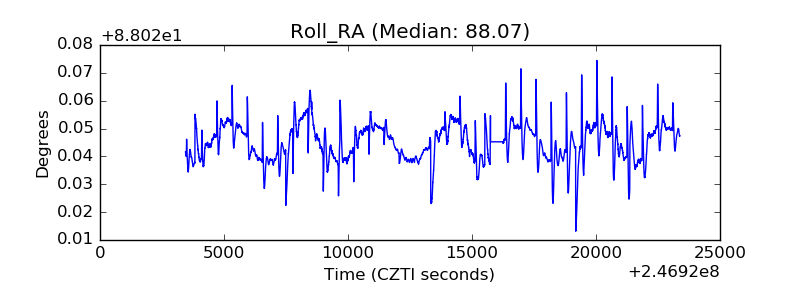 |
| Veto Counter | 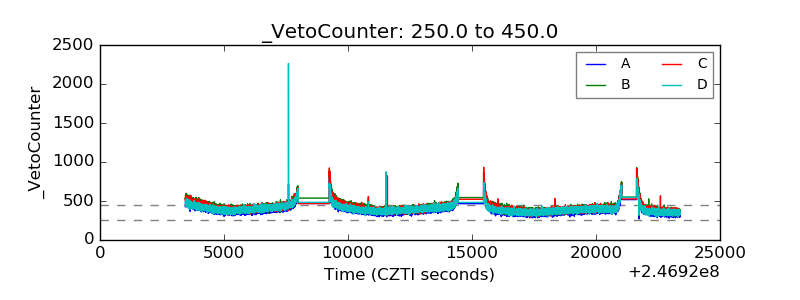 |