| Param | Original file | Final file |
|---|---|---|
| Filename | modeM0/AS1A04_044T01_9000001648_11280cztM0_level2.evt | modeM0/AS1A04_044T01_9000001648_11280cztM0_level2_quad_clean.evt |
| Size (bytes) | 496,880,640 | 45,400,320 |
| Size | 473.9 MB | 43.3 MB |
| Events in quadrant A | 2,754,517 | 278,674 |
| Events in quadrant B | 3,631,505 | 277,574 |
| Events in quadrant C | 1,987,648 | 276,012 |
| Events in quadrant D | 6,363,009 | 218,762 |
| Mode SS | |||
|---|---|---|---|
| Quadrant | BADHDUFLAG | Total packets | Discarded packets |
| A | 0 | 92 | 0 |
| B | 0 | 92 | 0 |
| C | 0 | 92 | 0 |
| D | 0 | 92 | 0 |
| Mode M0 | |||
|---|---|---|---|
| Quadrant | BADHDUFLAG | Total packets | Discarded packets |
| A | 0 | 11037 | 0 |
| B | 0 | 13798 | 0 |
| C | 0 | 9195 | 0 |
| D | 0 | 22156 | 0 |
| Quadrant | Total seconds | Saturated seconds | Saturation percentage |
|---|---|---|---|
| A | 4592 | 83 | 1.807491% |
| B | 4592 | 423 | 9.211672% |
| C | 4592 | 0 | 0.000000% |
| D | 4592 | 1178 | 25.653310% |
Noise dominated data is calculated using 1-second bins in cleaned event files. If a bin has >2000 counts, and if more than 50% of those come from <1% of pixels, then it is considered to be noise-dominated and hence unusable.
| Quadrant | # 1 sec bins | Bins with >0 counts | Bins with >2000 counts | High rate bins dominated by noise | Noise dominated (total time) | Noise dominated (detector-on time) | Marked lightcurve |
|---|---|---|---|---|---|---|---|
| A | 4592 | 4592 | 41 | 41 | 0.89% | 0.89% |  |
| B | 4592 | 4592 | 262 | 262 | 5.71% | 5.71% |  |
| C | 4592 | 4592 | 0 | 0 | 0.00% | 0.00% | 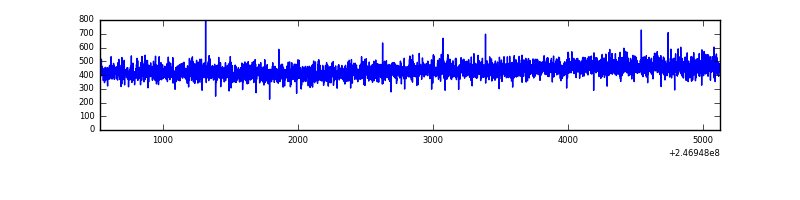 |
| D | 4592 | 4591 | 1034 | 1034 | 22.52% | 22.52% | 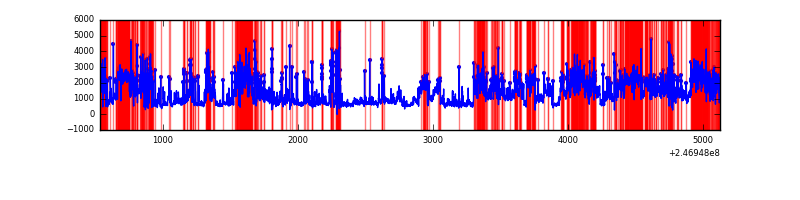 |
Top three noisy pixels from each quadrant. If the there are fewer than three noisy pixels in the level2.evt file, extra rows are filled as -1
| Pixel properties | Quadrant properties | ||||||
|---|---|---|---|---|---|---|---|
| Quadrant | DetID | PixID | Counts | Sigma | Mean | Median | Sigma |
| A | 8 | 5 | 404290 | 3763.15 | 521 | 509 | 107.3 |
| A | 13 | 251 | 202264 | 1880.31 | 521 | 509 | 107.3 |
| A | 8 | 15 | 69364 | 641.71 | 521 | 509 | 107.3 |
| B | 4 | 239 | 952382 | 9722.87 | 507 | 494 | 97.9 |
| B | 3 | 64 | 407283 | 4155.07 | 507 | 494 | 97.9 |
| B | 11 | 51 | 77826 | 789.89 | 507 | 494 | 97.9 |
| C | 13 | 61 | 3686 | 26.57 | 508 | 510 | 119.5 |
| C | 9 | 204 | 3115 | 21.79 | 508 | 510 | 119.5 |
| C | 14 | 234 | 1845 | 11.17 | 508 | 510 | 119.5 |
| D | 13 | 152 | 1978613 | 17688.79 | 459 | 446 | 111.8 |
| D | 7 | 80 | 985585 | 8809.12 | 459 | 446 | 111.8 |
| D | 1 | 52 | 820371 | 7331.78 | 459 | 446 | 111.8 |
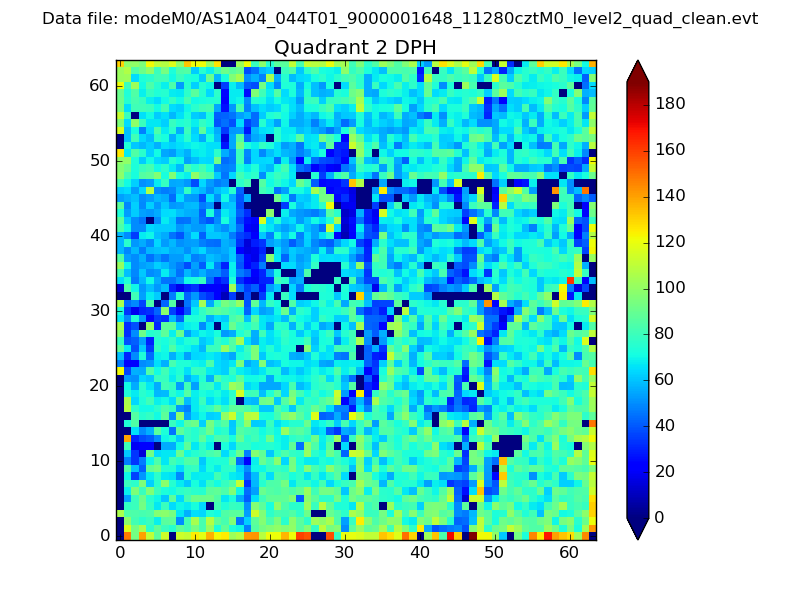
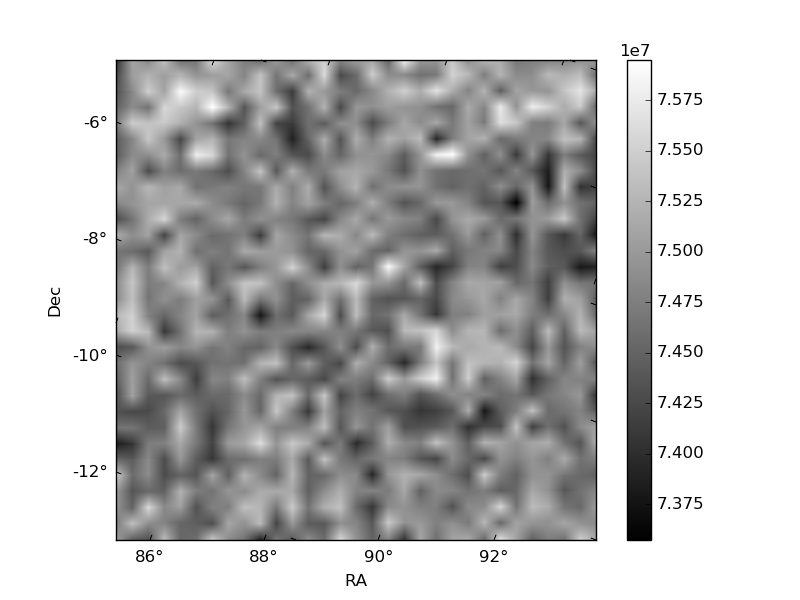
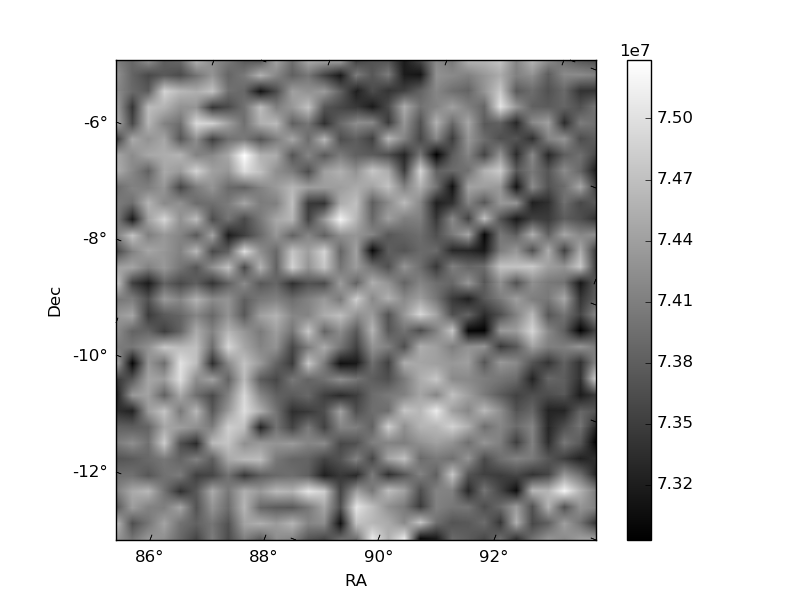
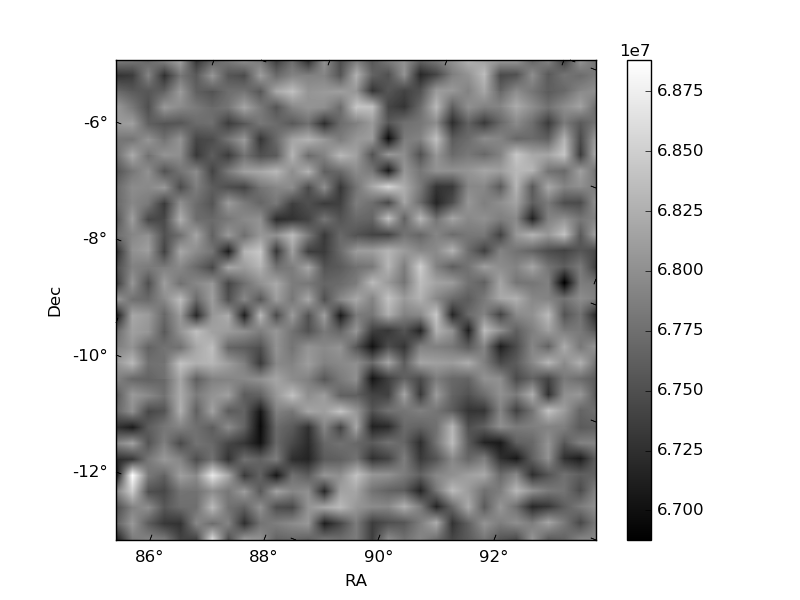
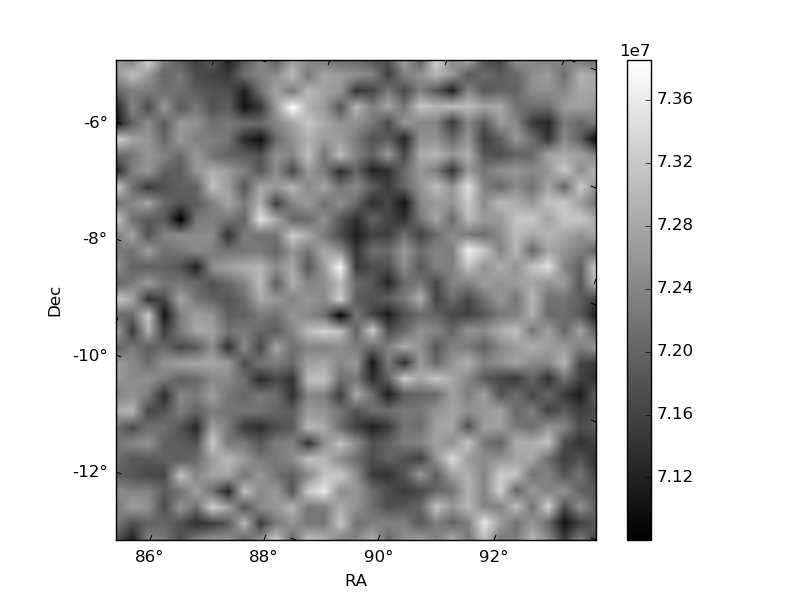
Histogram calculated using DETX and DETY for each event in the final _common_clean file
| Quadrant A | 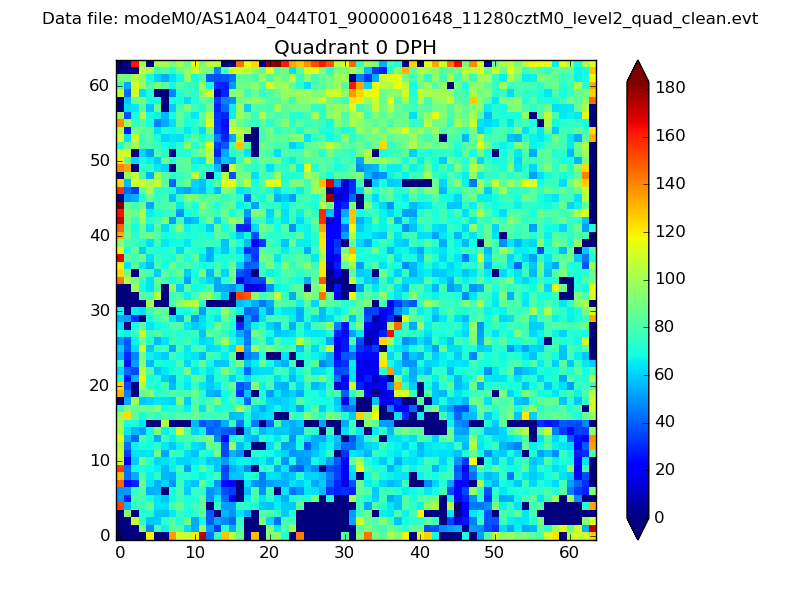 |
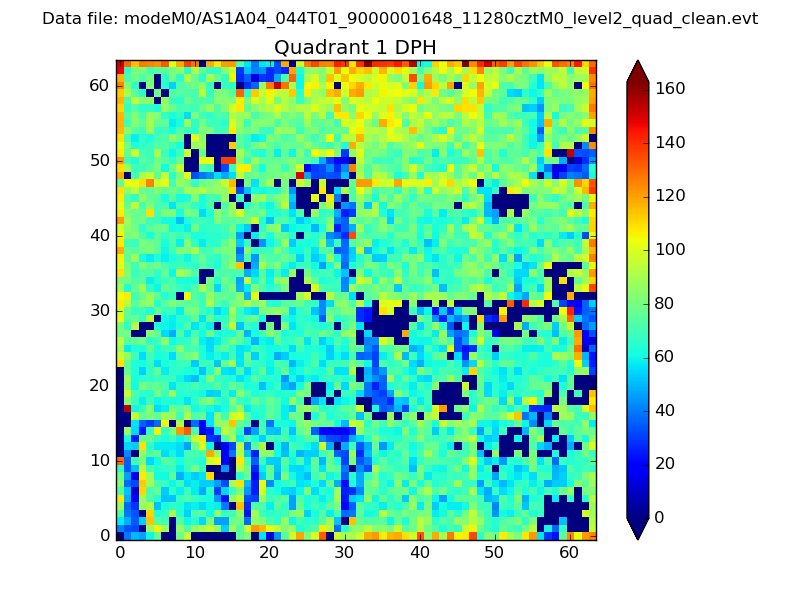 |
Quadrant B |
|---|---|---|---|
| Quadrant D | 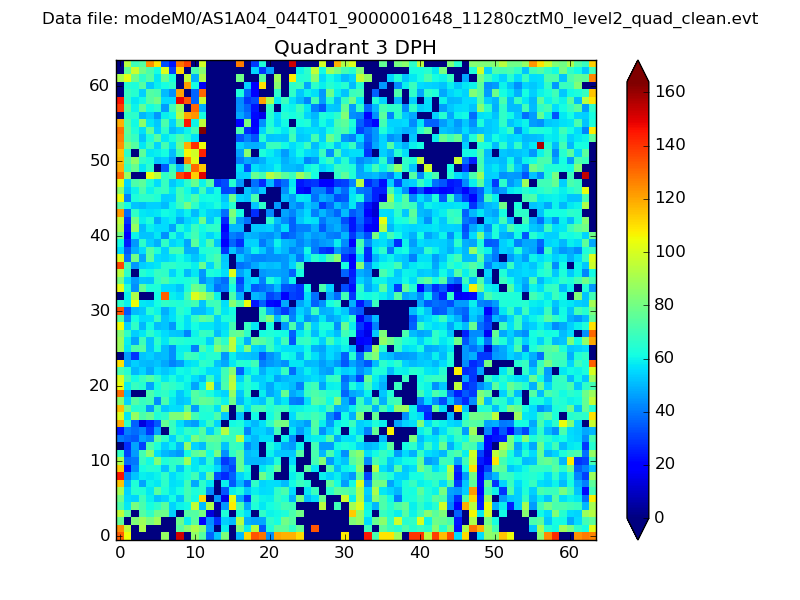 |
 |
Quadrant C |
| Plot type | Count rate plots | Images |
|---|---|---|
| Comparison with Poisson distribution Blue bars denote a histogram of data divided into 1 sec bins. Red curve is a Poisson curve with rate = median count rate of data. |
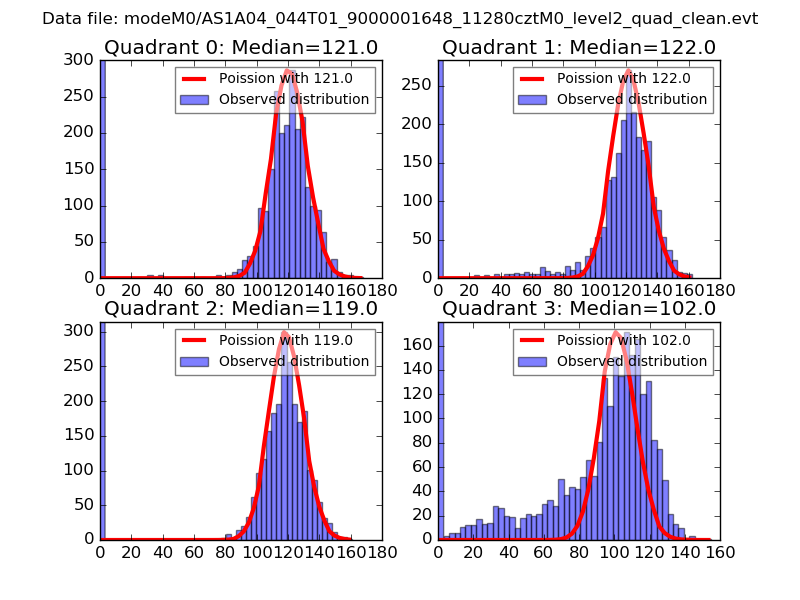 |
 |
| Quadrant-wise count rates Data is divided into 100 sec bins |
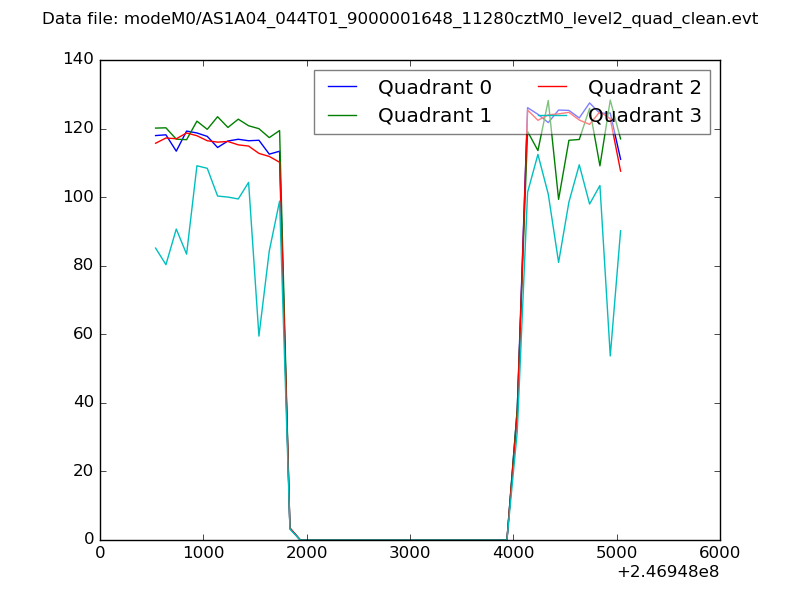 |
|
| Module-wise count rates for Quadrant A Data is divided into 100 sec bins |
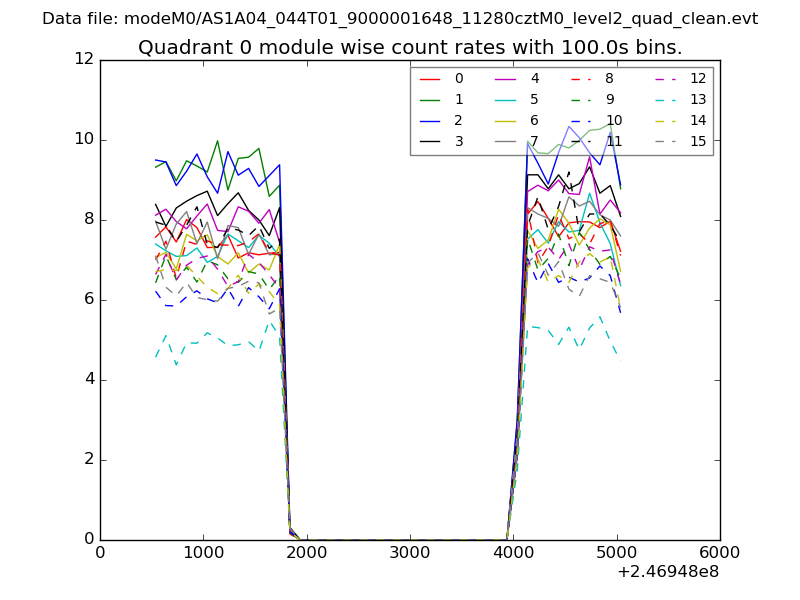 |
 |
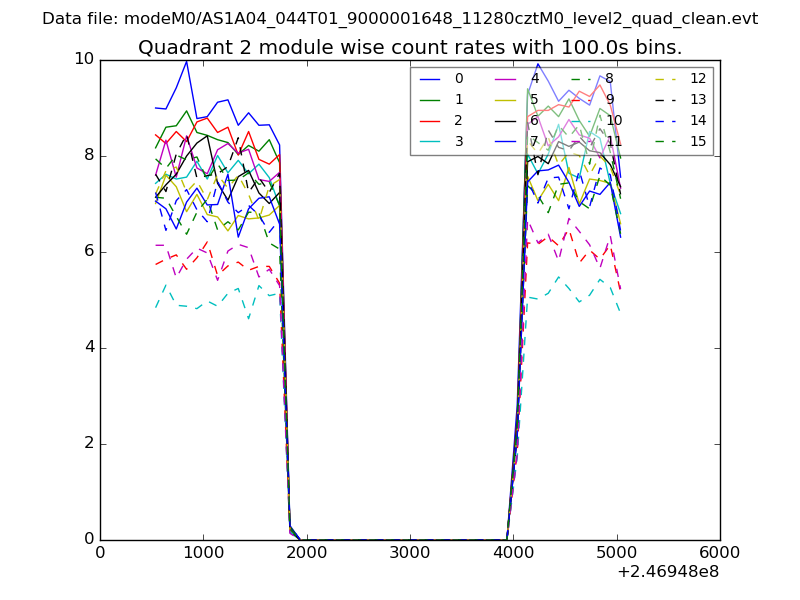
| Module-wise count rates for Quadrant B Data is divided into 100 sec bins |
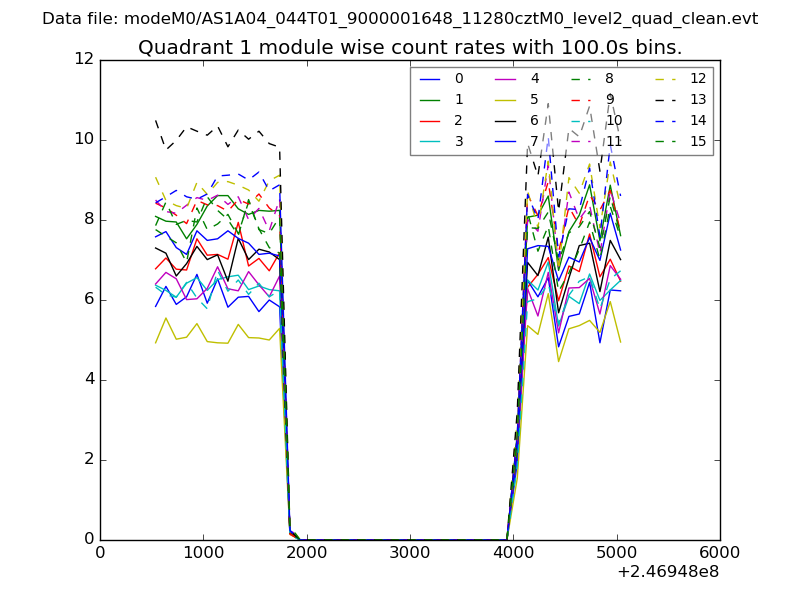 |
 |
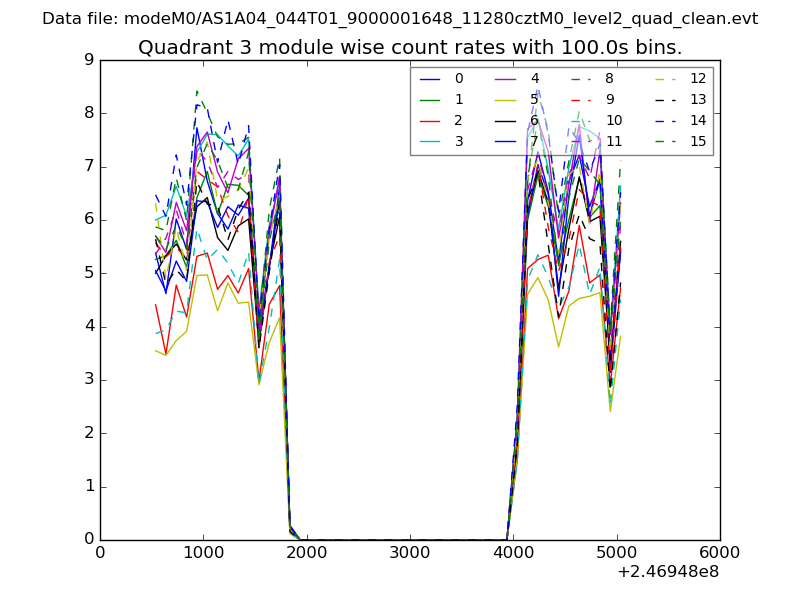
| Module-wise count rates for Quadrant C Data is divided into 100 sec bins |
 |
 |
| Module-wise count rates for Quadrant D Data is divided into 100 sec bins |
 |
 |
| Parameter | Plot |
|---|---|
| CZT HV Monitor | 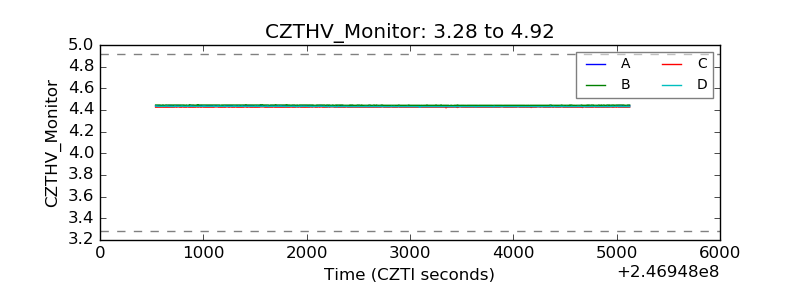 |
| D_VDD | 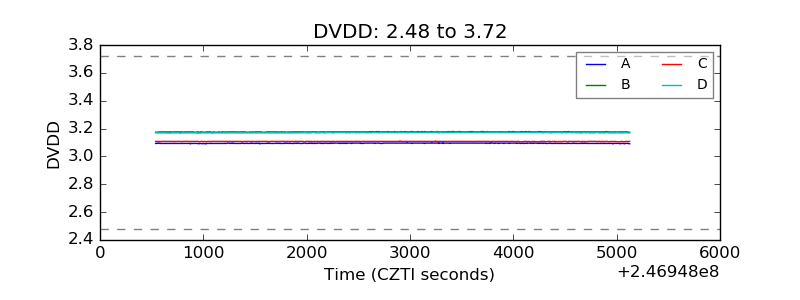 |
| Temperature 1 | 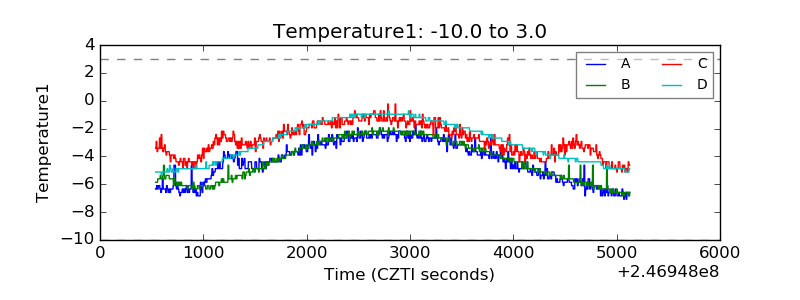 |
| Veto HV Monitor | 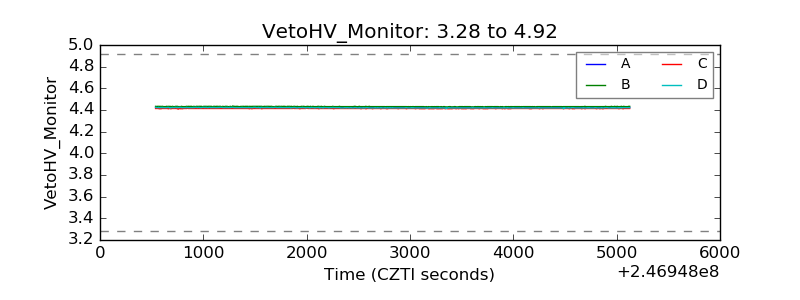 |
| Veto LLD | 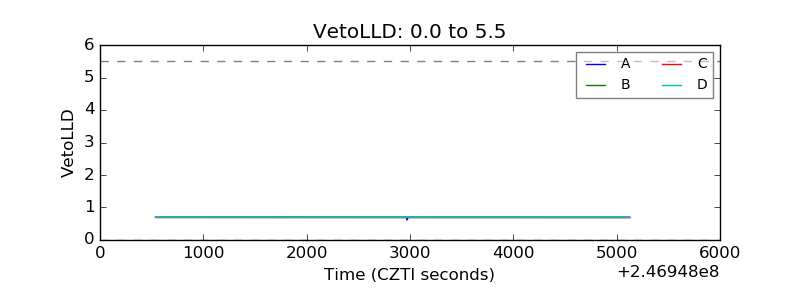 |
| Alpha Counter | 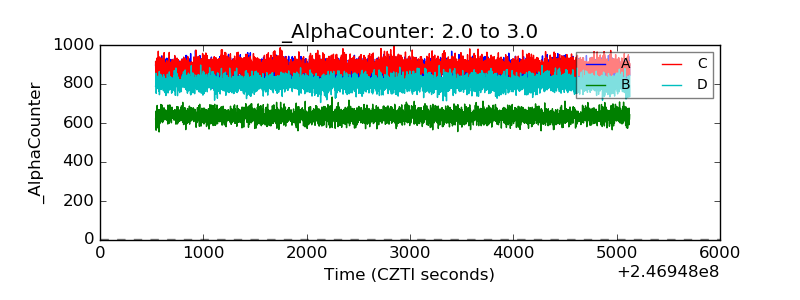 |
| _CPM_Rate | 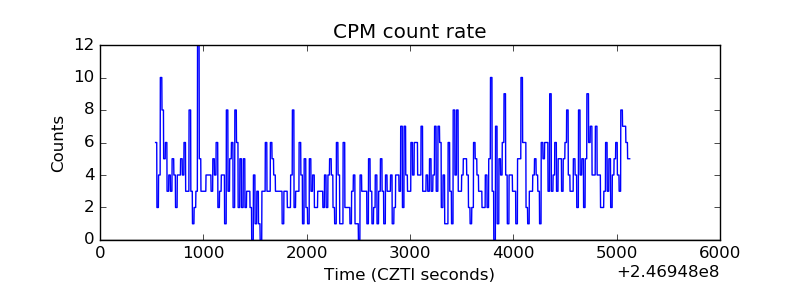 |
| CZT Counter | 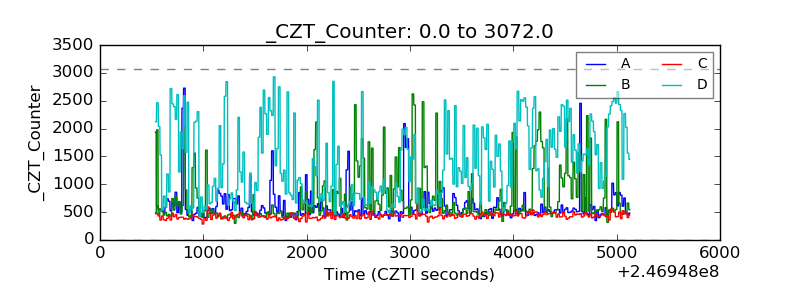 |
| +2.5 Volts monitor |  |
| +5 Volts monitor |  |
| _ROLL_ROT | 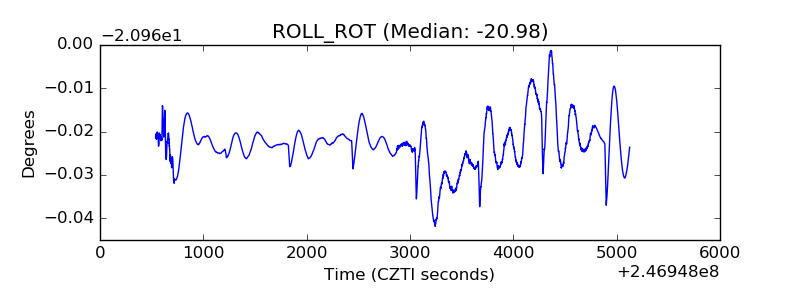 |
| _Roll_DEC | 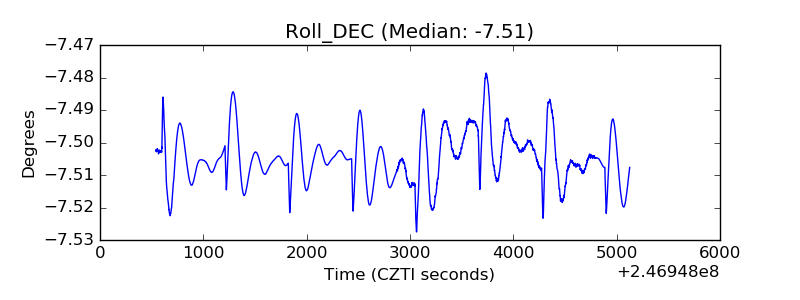 |
| _Roll_RA | 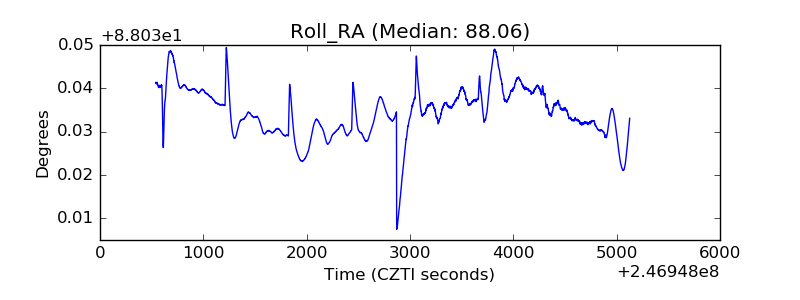 |
| Veto Counter | 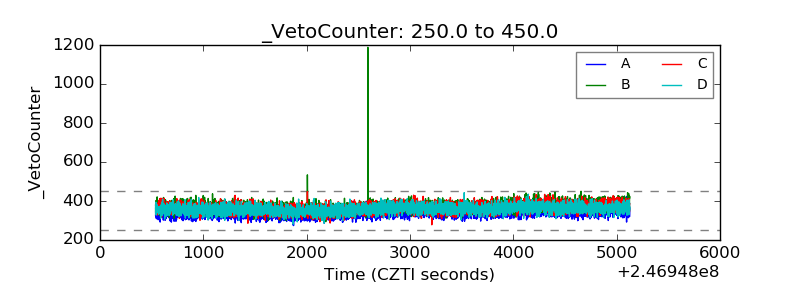 |