| Param | Original file | Final file |
|---|---|---|
| Filename | modeM0/AS1A04_080T02_9000001646cztM0_level2.fits | modeM0/AS1A04_080T02_9000001646cztM0_level2_quad_clean.evt |
| Size (bytes) | 71,968,320 | 45,308,160 |
| Size | 68.6 MB | 43.2 MB |
| Events in quadrant A | 425,688 | 218,803 |
| Events in quadrant B | 402,066 | 187,119 |
| Events in quadrant C | 435,978 | 216,704 |
| Events in quadrant D | 365,654 | 198,705 |
| Mode SS | |||
|---|---|---|---|
| Quadrant | BADHDUFLAG | Total packets | Discarded packets |
| A | 0 | 164 | 0 |
| B | 0 | 164 | 0 |
| C | 0 | 164 | 0 |
| D | 0 | 164 | 0 |
| Mode M0 | |||
|---|---|---|---|
| Quadrant | BADHDUFLAG | Total packets | Discarded packets |
| A | 0 | 20608 | 0 |
| B | 0 | 24886 | 0 |
| C | 0 | 16866 | 0 |
| D | 0 | 20907 | 0 |
| Mode M9 | |||
|---|---|---|---|
| Quadrant | BADHDUFLAG | Total packets | Discarded packets |
| A | 0 | 3 | 0 |
| B | 0 | 3 | 0 |
| C | 0 | 3 | 0 |
| D | 0 | 3 | 0 |
| Quadrant | Total seconds | Saturated seconds | Saturation percentage |
|---|---|---|---|
| A | 7897 | 459 | 5.812334% |
| B | 7897 | 1195 | 15.132329% |
| C | 7897 | 250 | 3.165759% |
| D | 7897 | 540 | 6.838040% |
Noise dominated data is calculated using 1-second bins in cleaned event files. If a bin has >2000 counts, and if more than 50% of those come from <1% of pixels, then it is considered to be noise-dominated and hence unusable.
| Quadrant | # 1 sec bins | Bins with >0 counts | Bins with >2000 counts | High rate bins dominated by noise | Noise dominated (total time) | Noise dominated (detector-on time) | Marked lightcurve |
|---|---|---|---|---|---|---|---|
| A | 8252 | 7894 | 0 | 0 | 0.00% | 0.00% |  |
| B | 8252 | 7894 | 0 | 0 | 0.00% | 0.00% |  |
| C | 8252 | 7897 | 0 | 0 | 0.00% | 0.00% |  |
| D | 8252 | 7895 | 0 | 0 | 0.00% | 0.00% |  |
Top three noisy pixels from each quadrant. If the there are fewer than three noisy pixels in the level2.evt file, extra rows are filled as -1
| Pixel properties | Quadrant properties | ||||||
|---|---|---|---|---|---|---|---|
| Quadrant | DetID | PixID | Counts | Sigma | Mean | Median | Sigma |
| A | 14 | 188 | 443 | 10.7 | 110 | 103 | 31.8 |
| A | 0 | 29 | 417 | 9.88 | 110 | 103 | 31.8 |
| A | 14 | 204 | 365 | 8.25 | 110 | 103 | 31.8 |
| B | 2 | 9 | 335 | 9.43 | 105 | 100 | 24.9 |
| B | 5 | 232 | 299 | 7.99 | 105 | 100 | 24.9 |
| B | 5 | 236 | 294 | 7.79 | 105 | 100 | 24.9 |
| C | 12 | 241 | 332 | 7.06 | 114 | 106 | 32.0 |
| C | 1 | 80 | 309 | 6.34 | 114 | 106 | 32.0 |
| C | 2 | 191 | 308 | 6.31 | 114 | 106 | 32.0 |
| D | 1 | 31 | 265 | 5.71 | 104 | 94 | 30.0 |
| D | 3 | 31 | 263 | 5.64 | 104 | 94 | 30.0 |
| D | 1 | 3 | 260 | 5.54 | 104 | 94 | 30.0 |
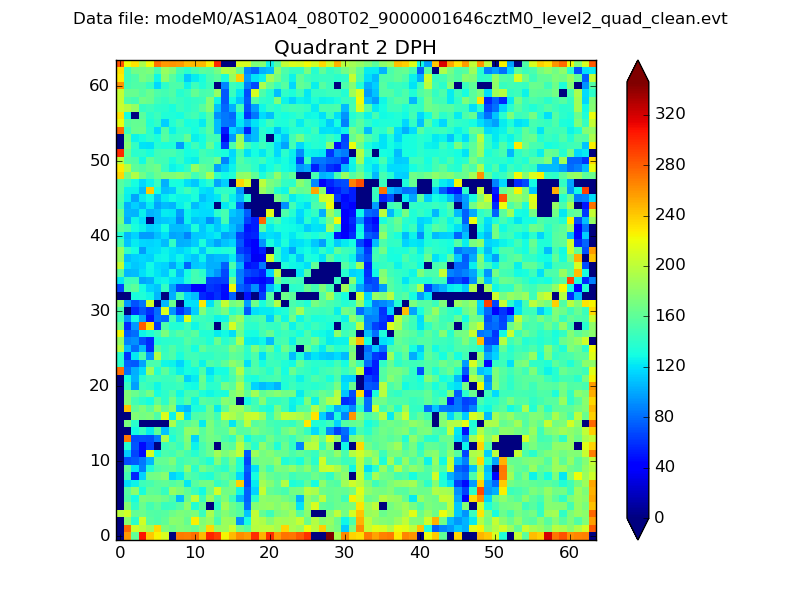
Histogram calculated using DETX and DETY for each event in the final _common_clean file
| Quadrant A | 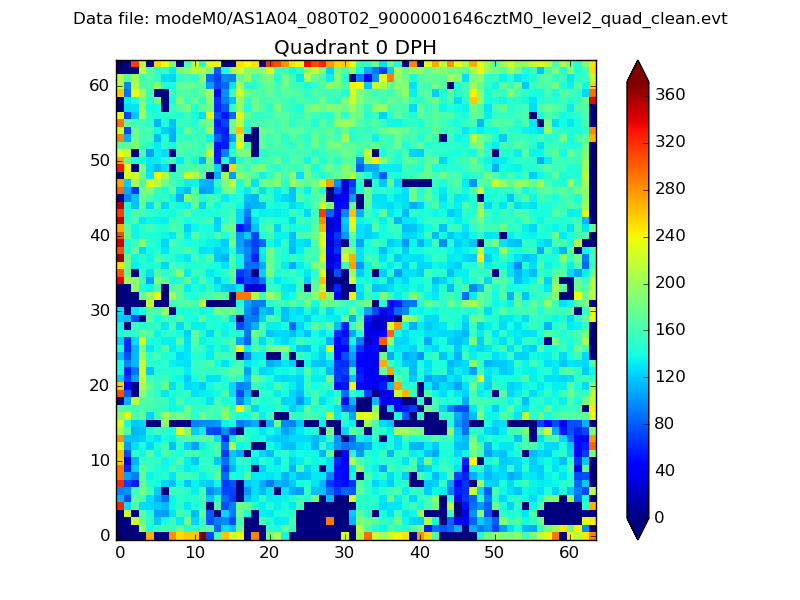 |
 |
Quadrant B |
|---|---|---|---|
| Quadrant D |  |
 |
Quadrant C |
| Plot type | Count rate plots | Images |
|---|---|---|
| Comparison with Poisson distribution Blue bars denote a histogram of data divided into 1 sec bins. Red curve is a Poisson curve with rate = median count rate of data. |
 |
 |
| Quadrant-wise count rates Data is divided into 100 sec bins |
 |
|
| Module-wise count rates for Quadrant A Data is divided into 100 sec bins |
 |
 |
| Module-wise count rates for Quadrant B Data is divided into 100 sec bins |
 |
 |
| Module-wise count rates for Quadrant C Data is divided into 100 sec bins |
 |
 |
| Module-wise count rates for Quadrant D Data is divided into 100 sec bins |
 |
 |
| Parameter | Plot |
|---|---|
| CZT HV Monitor |  |
| D_VDD | 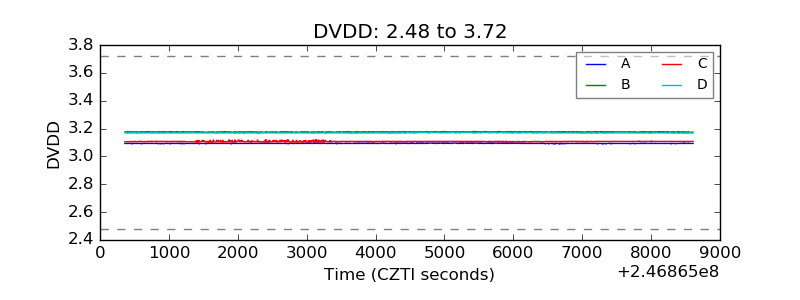 |
| Temperature 1 |  |
| Veto HV Monitor |  |
| Veto LLD |  |
| Alpha Counter |  |
| _CPM_Rate |  |
| CZT Counter |  |
| +2.5 Volts monitor |  |
| +5 Volts monitor |  |
| _ROLL_ROT |  |
| _Roll_DEC |  |
| _Roll_RA |  |
| Veto Counter |  |