| Param | Original file | Final file |
|---|---|---|
| Filename | modeM0/AS1A04_080T02_9000001646_11265cztM0_level2.evt | modeM0/AS1A04_080T02_9000001646_11265cztM0_level2_quad_clean.evt |
| Size (bytes) | 231,114,240 | 24,027,840 |
| Size | 220.4 MB | 22.9 MB |
| Events in quadrant A | 1,766,691 | 142,644 |
| Events in quadrant B | 1,851,897 | 137,520 |
| Events in quadrant C | 1,268,547 | 145,188 |
| Events in quadrant D | 1,944,227 | 125,616 |
| Mode SS | |||
|---|---|---|---|
| Quadrant | BADHDUFLAG | Total packets | Discarded packets |
| A | 0 | 52 | 0 |
| B | 0 | 52 | 0 |
| C | 0 | 52 | 0 |
| D | 0 | 52 | 0 |
| Mode M0 | |||
|---|---|---|---|
| Quadrant | BADHDUFLAG | Total packets | Discarded packets |
| A | 0 | 6896 | 2 |
| B | 0 | 7121 | 1 |
| C | 0 | 5438 | 1 |
| D | 0 | 7469 | 1 |
| Mode M9 | |||
|---|---|---|---|
| Quadrant | BADHDUFLAG | Total packets | Discarded packets |
| A | 0 | 1 | 0 |
| B | 0 | 1 | 0 |
| C | 0 | 1 | 0 |
| D | 0 | 1 | 0 |
| Quadrant | Total seconds | Saturated seconds | Saturation percentage |
|---|---|---|---|
| A | 2441 | 181 | 7.414994% |
| B | 2441 | 355 | 14.543220% |
| C | 2441 | 124 | 5.079885% |
| D | 2441 | 306 | 12.535846% |
Noise dominated data is calculated using 1-second bins in cleaned event files. If a bin has >2000 counts, and if more than 50% of those come from <1% of pixels, then it is considered to be noise-dominated and hence unusable.
| Quadrant | # 1 sec bins | Bins with >0 counts | Bins with >2000 counts | High rate bins dominated by noise | Noise dominated (total time) | Noise dominated (detector-on time) | Marked lightcurve |
|---|---|---|---|---|---|---|---|
| A | 2581 | 2442 | 18 | 18 | 0.70% | 0.74% | 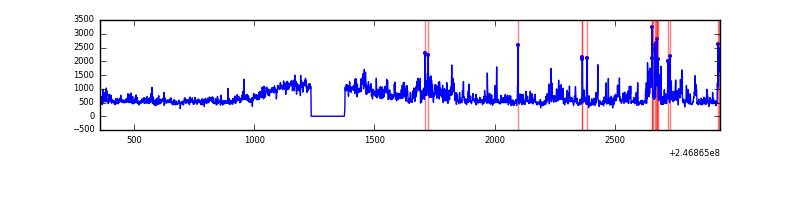 |
| B | 2581 | 2441 | 97 | 97 | 3.76% | 3.97% | 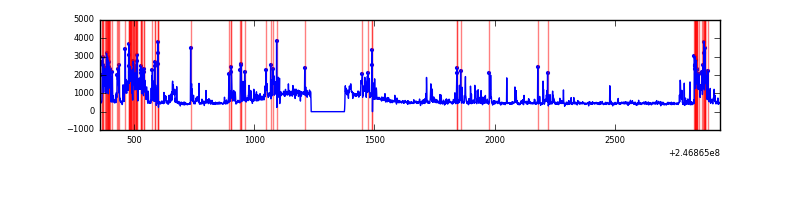 |
| C | 2581 | 2442 | 0 | 0 | 0.00% | 0.00% | 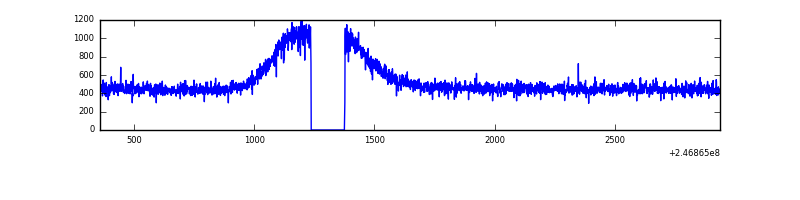 |
| D | 2581 | 2442 | 119 | 119 | 4.61% | 4.87% | 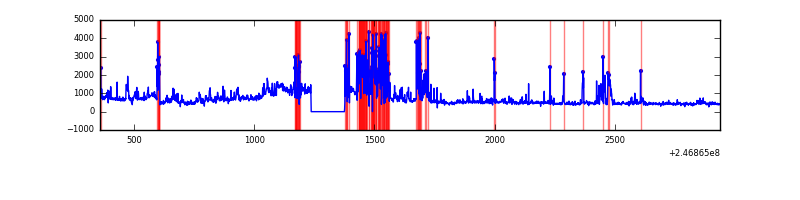 |
Top three noisy pixels from each quadrant. If the there are fewer than three noisy pixels in the level2.evt file, extra rows are filled as -1
| Pixel properties | Quadrant properties | ||||||
|---|---|---|---|---|---|---|---|
| Quadrant | DetID | PixID | Counts | Sigma | Mean | Median | Sigma |
| A | 13 | 251 | 379956 | 5497.39 | 320 | 311 | 69.1 |
| A | 14 | 238 | 56907 | 819.53 | 320 | 311 | 69.1 |
| A | 8 | 5 | 31111 | 445.99 | 320 | 311 | 69.1 |
| B | 4 | 239 | 310160 | 4696.81 | 316 | 307 | 66.0 |
| B | 3 | 64 | 269149 | 4075.16 | 316 | 307 | 66.0 |
| B | 4 | 81 | 16396 | 243.88 | 316 | 307 | 66.0 |
| C | 8 | 128 | 3719 | 42.87 | 323 | 324 | 79.2 |
| C | 13 | 61 | 2336 | 25.41 | 323 | 324 | 79.2 |
| C | 8 | 112 | 1866 | 19.47 | 323 | 324 | 79.2 |
| D | 10 | 253 | 347238 | 4515.21 | 300 | 291 | 76.8 |
| D | 1 | 52 | 227833 | 2961.26 | 300 | 291 | 76.8 |
| D | 8 | 195 | 80484 | 1043.64 | 300 | 291 | 76.8 |
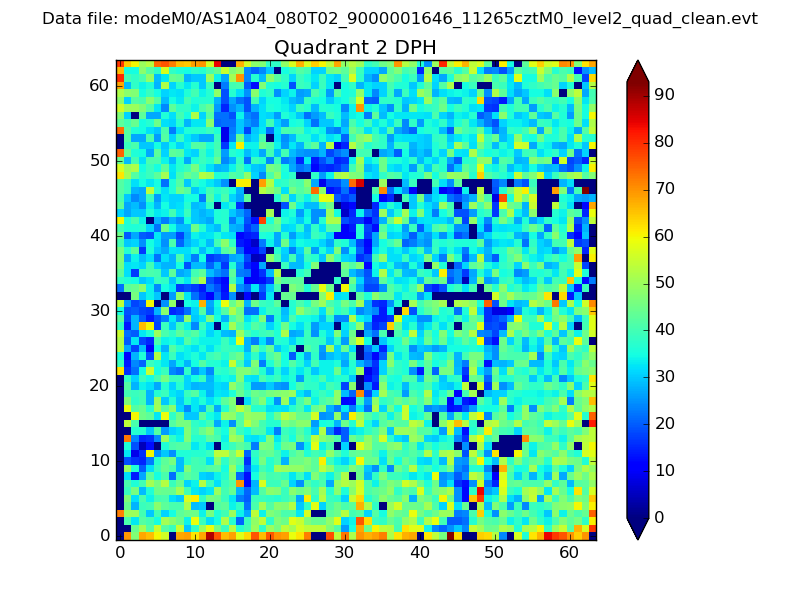
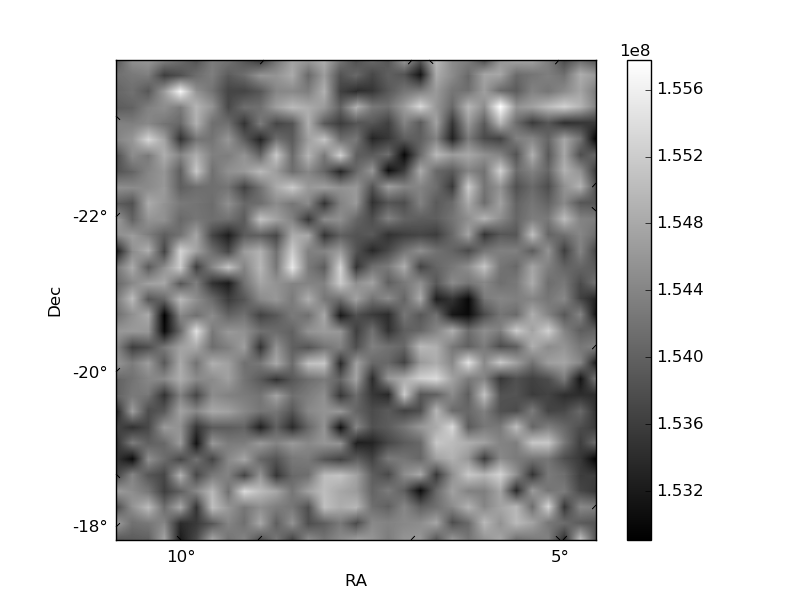
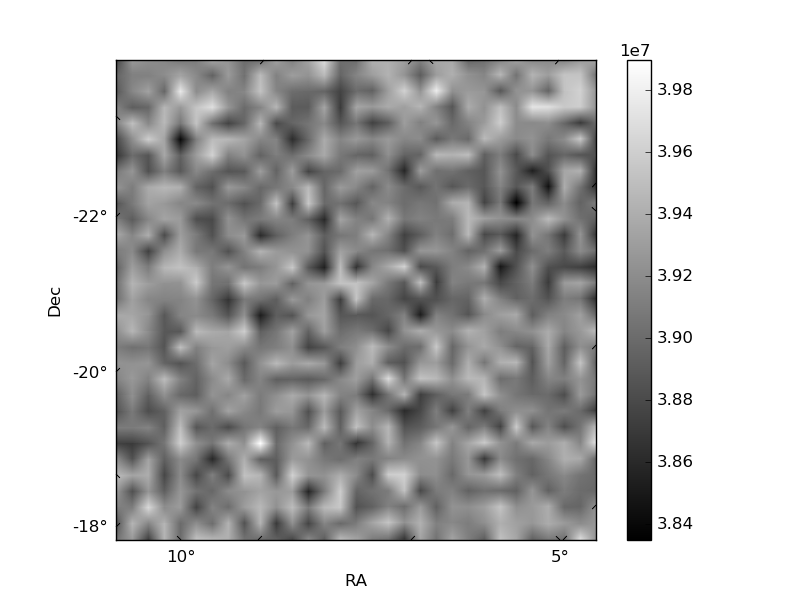
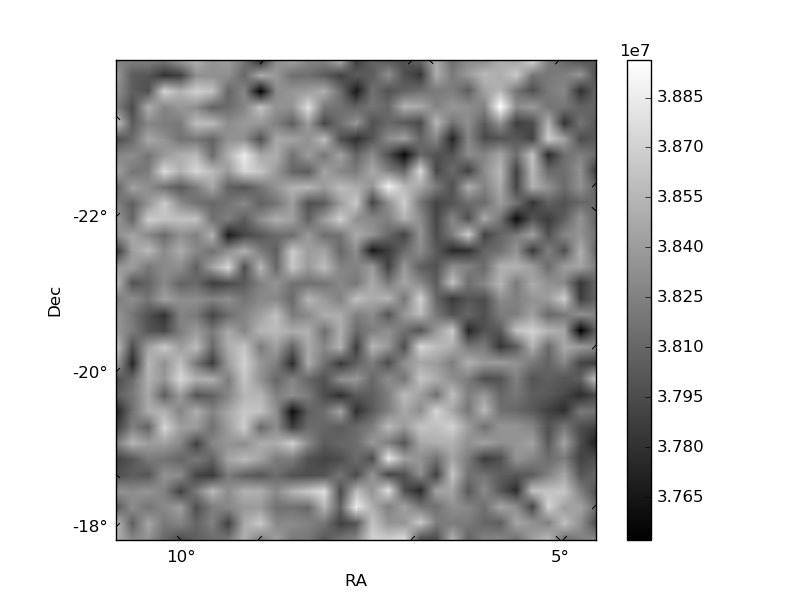
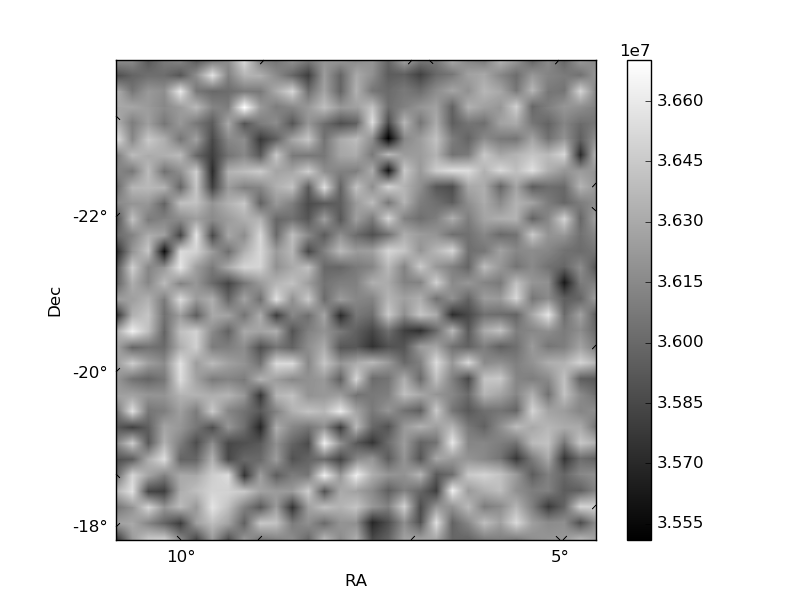
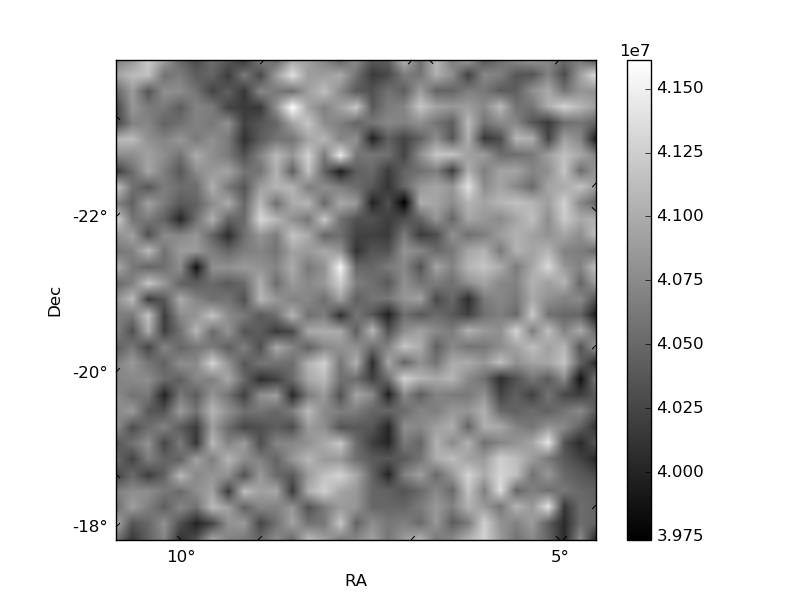
Histogram calculated using DETX and DETY for each event in the final _common_clean file
| Quadrant A | 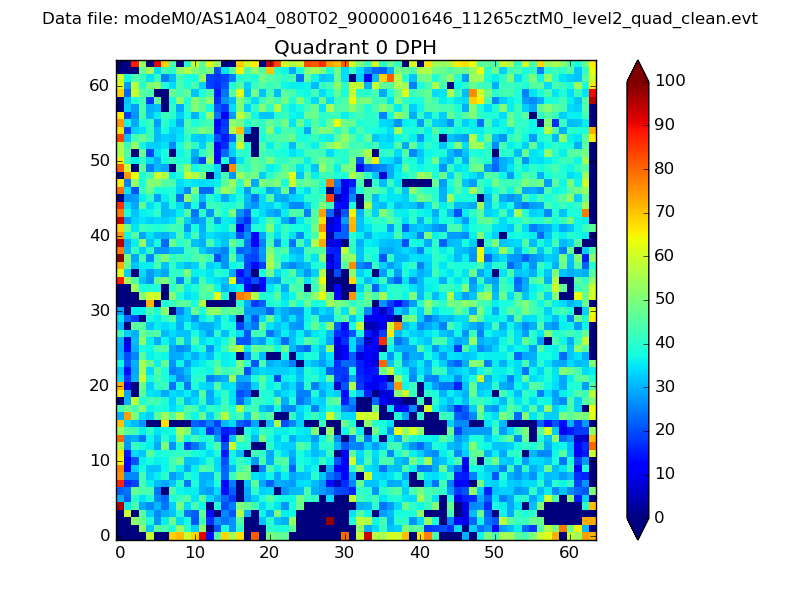 |
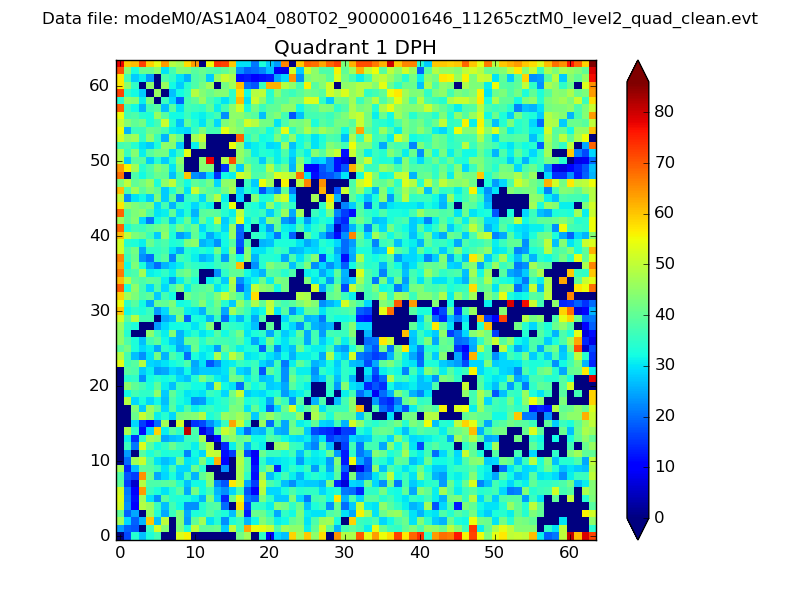 |
Quadrant B |
|---|---|---|---|
| Quadrant D | 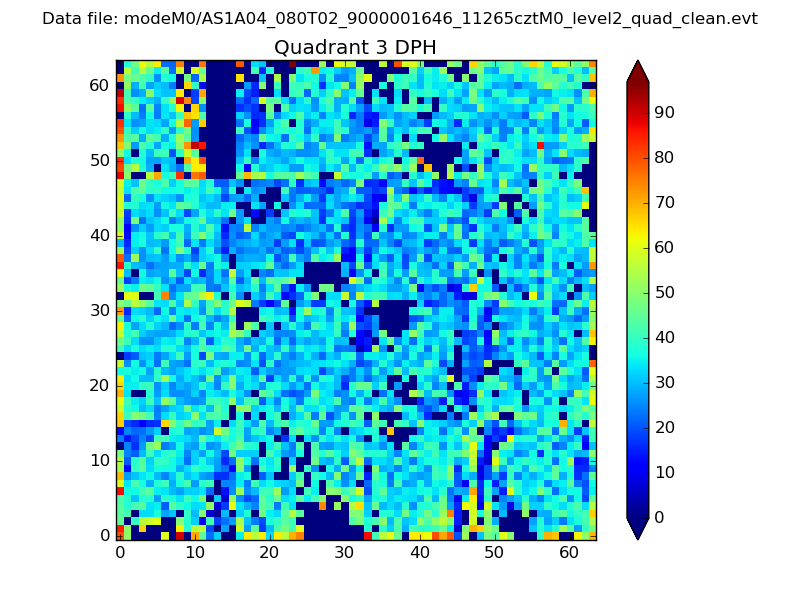 |
 |
Quadrant C |
| Plot type | Count rate plots | Images |
|---|---|---|
| Comparison with Poisson distribution Blue bars denote a histogram of data divided into 1 sec bins. Red curve is a Poisson curve with rate = median count rate of data. |
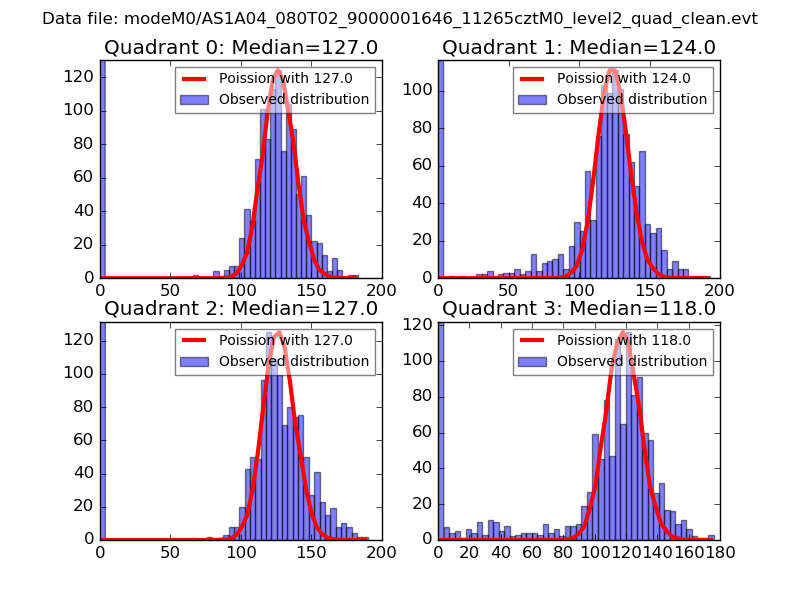 |
 |
| Quadrant-wise count rates Data is divided into 100 sec bins |
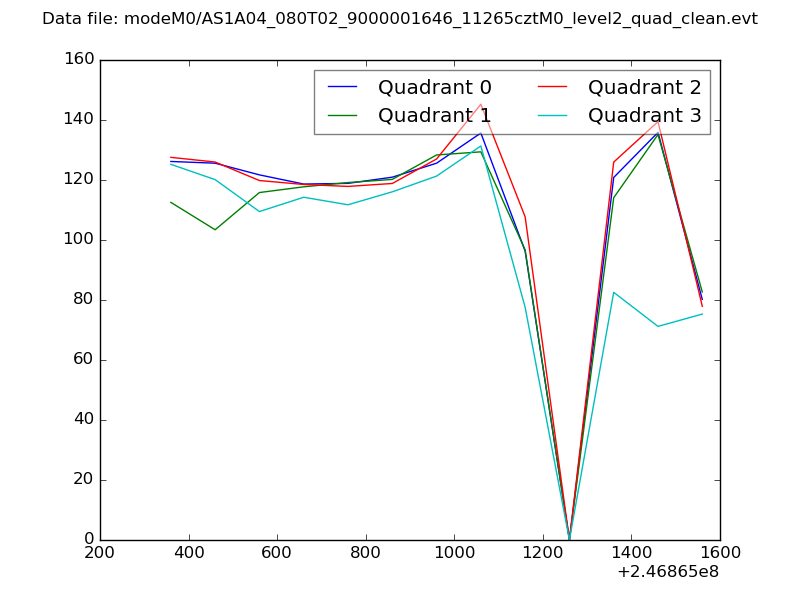 |
|
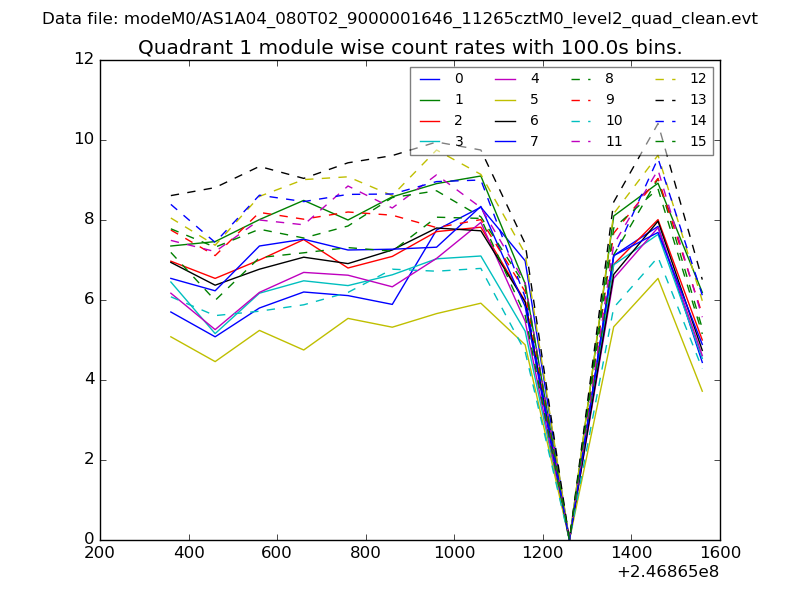
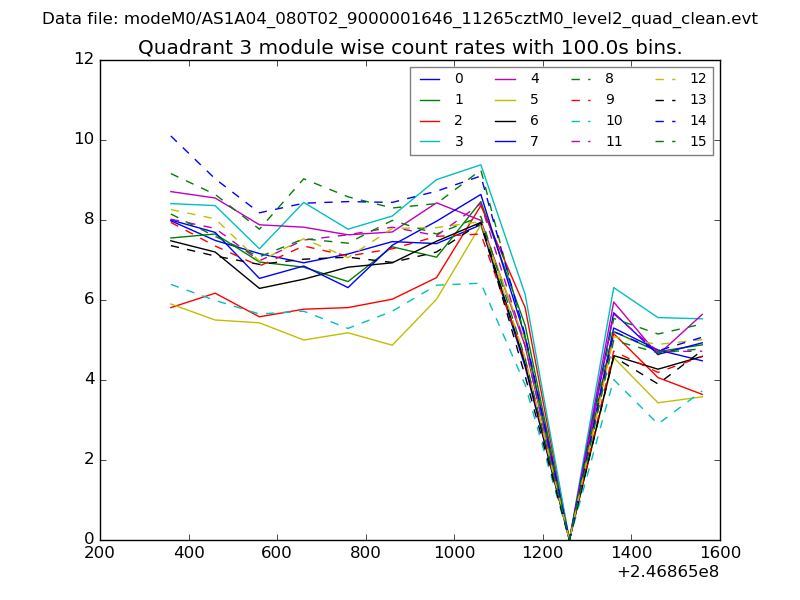
| Module-wise count rates for Quadrant A Data is divided into 100 sec bins |
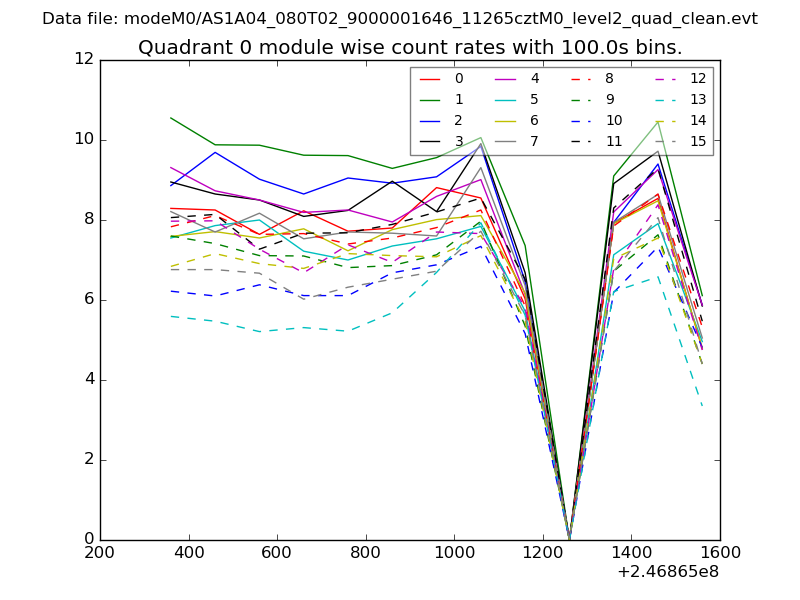 |
 |
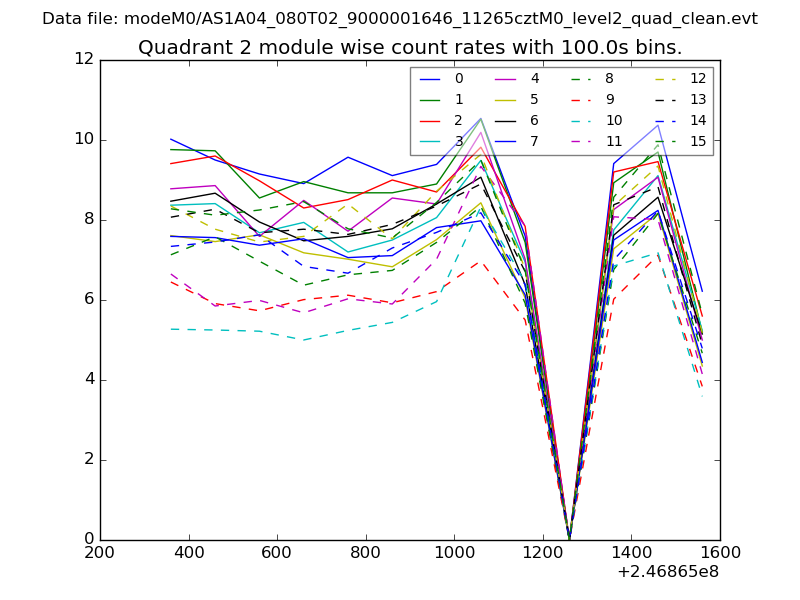
| Module-wise count rates for Quadrant B Data is divided into 100 sec bins |
 |
 |
| Module-wise count rates for Quadrant C Data is divided into 100 sec bins |
 |
 |
| Module-wise count rates for Quadrant D Data is divided into 100 sec bins |
 |
 |
| Parameter | Plot |
|---|---|
| CZT HV Monitor | 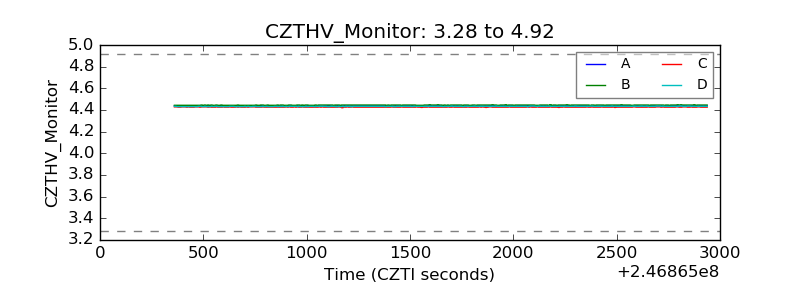 |
| D_VDD | 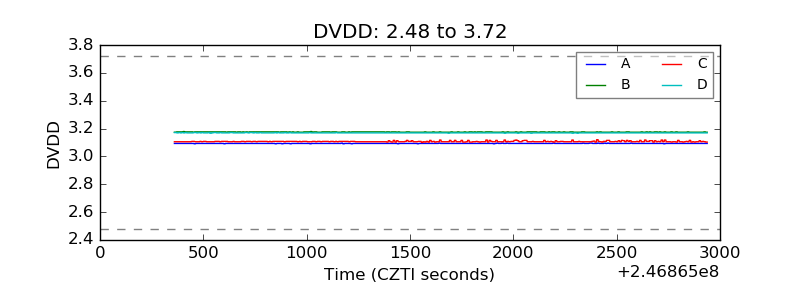 |
| Temperature 1 | 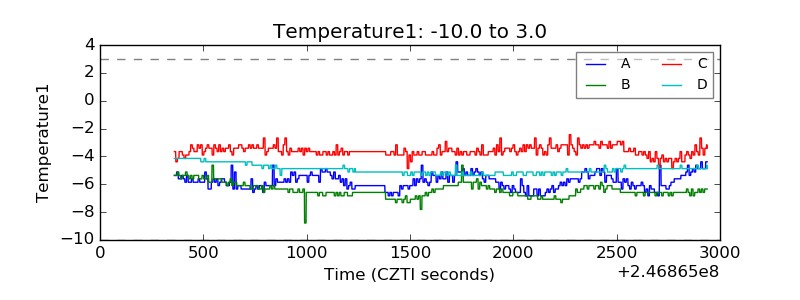 |
| Veto HV Monitor | 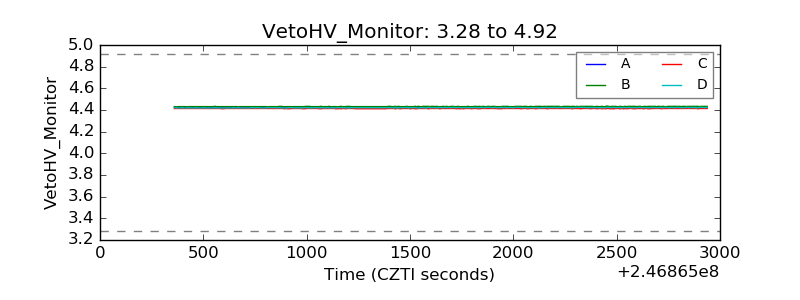 |
| Veto LLD | 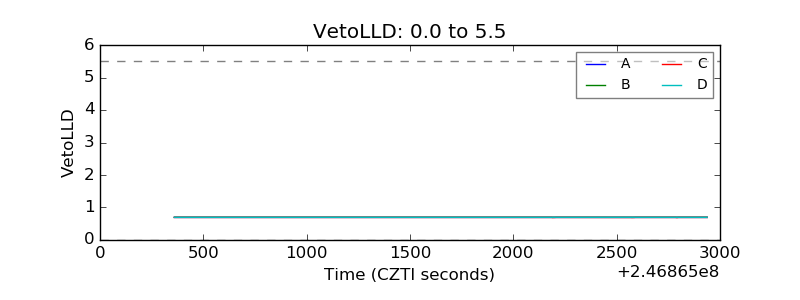 |
| Alpha Counter | 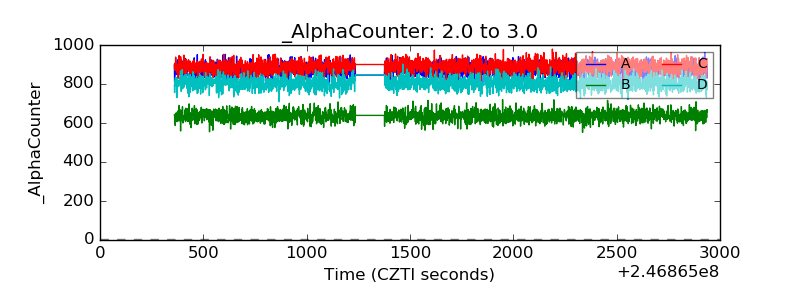 |
| _CPM_Rate | 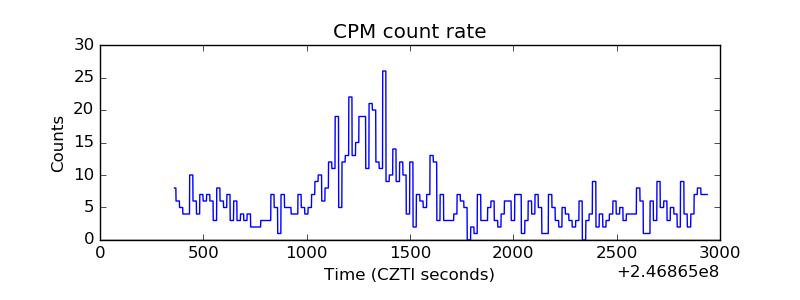 |
| CZT Counter | 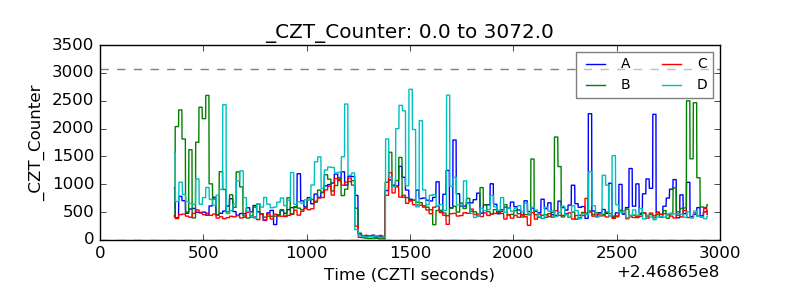 |
| +2.5 Volts monitor | 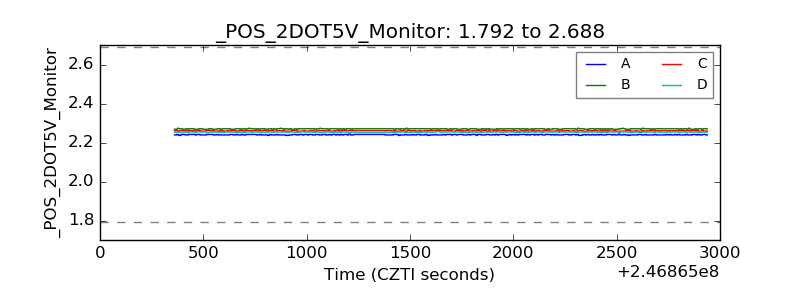 |
| +5 Volts monitor | 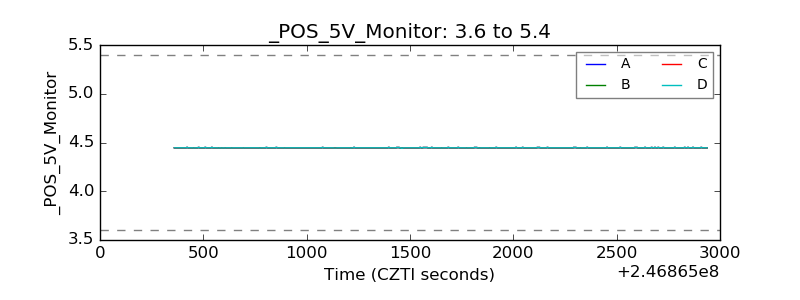 |
| _ROLL_ROT | 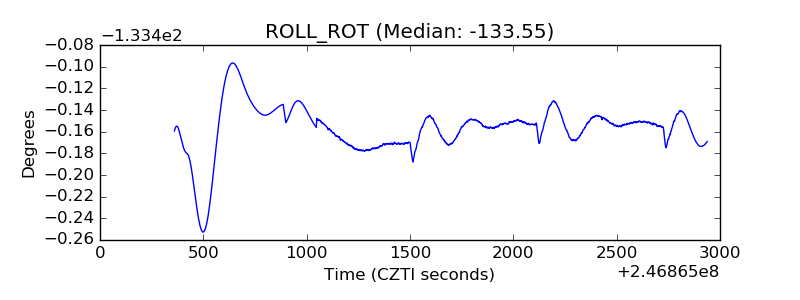 |
| _Roll_DEC | 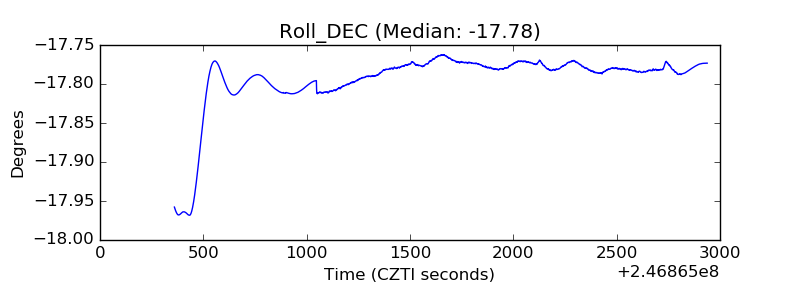 |
| _Roll_RA | 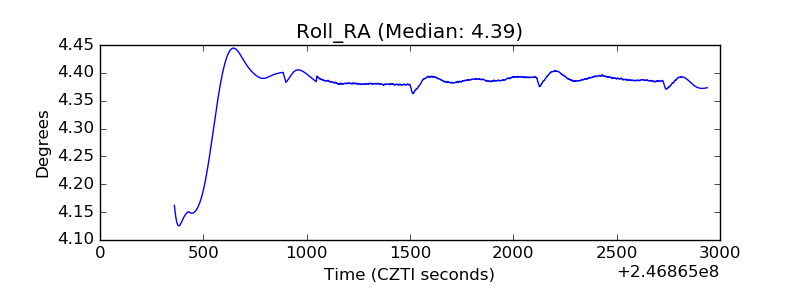 |
| Veto Counter | 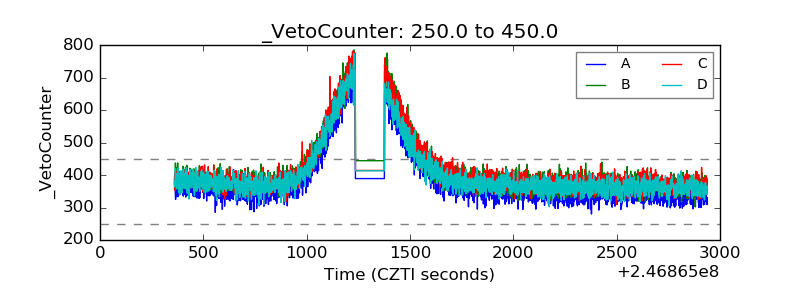 |