| Param | Original file | Final file |
|---|---|---|
| Filename | modeM0/AS1A04_080T02_9000001646_11270cztM0_level2.evt | modeM0/AS1A04_080T02_9000001646_11270cztM0_level2_quad_clean.evt |
| Size (bytes) | 524,718,720 | 68,595,840 |
| Size | 500.4 MB | 65.4 MB |
| Events in quadrant A | 3,883,766 | 417,810 |
| Events in quadrant B | 5,157,638 | 398,549 |
| Events in quadrant C | 2,798,154 | 427,438 |
| Events in quadrant D | 3,638,005 | 407,379 |
| Mode SS | |||
|---|---|---|---|
| Quadrant | BADHDUFLAG | Total packets | Discarded packets |
| A | 0 | 124 | 0 |
| B | 0 | 124 | 0 |
| C | 0 | 124 | 0 |
| D | 0 | 124 | 0 |
| Mode M0 | |||
|---|---|---|---|
| Quadrant | BADHDUFLAG | Total packets | Discarded packets |
| A | 0 | 15495 | 1 |
| B | 0 | 19327 | 1 |
| C | 0 | 12705 | 1 |
| D | 0 | 14892 | 1 |
| Mode M9 | |||
|---|---|---|---|
| Quadrant | BADHDUFLAG | Total packets | Discarded packets |
| A | 0 | 2 | 0 |
| B | 0 | 2 | 0 |
| C | 0 | 2 | 0 |
| D | 0 | 2 | 0 |
| Quadrant | Total seconds | Saturated seconds | Saturation percentage |
|---|---|---|---|
| A | 6093 | 297 | 4.874446% |
| B | 6093 | 866 | 14.213031% |
| C | 6093 | 126 | 2.067947% |
| D | 6093 | 242 | 3.971771% |
Noise dominated data is calculated using 1-second bins in cleaned event files. If a bin has >2000 counts, and if more than 50% of those come from <1% of pixels, then it is considered to be noise-dominated and hence unusable.
| Quadrant | # 1 sec bins | Bins with >0 counts | Bins with >2000 counts | High rate bins dominated by noise | Noise dominated (total time) | Noise dominated (detector-on time) | Marked lightcurve |
|---|---|---|---|---|---|---|---|
| A | 6308 | 6093 | 91 | 91 | 1.44% | 1.49% | 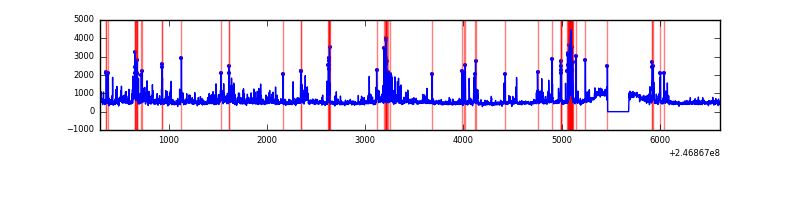 |
| B | 6308 | 6094 | 492 | 492 | 7.80% | 8.07% | 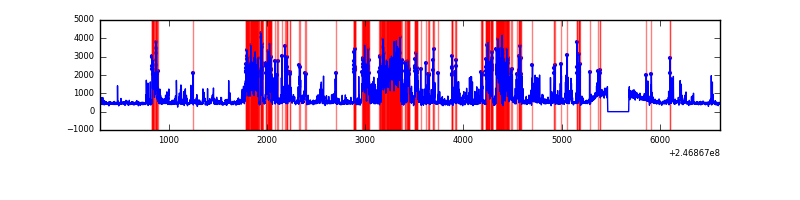 |
| C | 6308 | 6094 | 3 | 3 | 0.05% | 0.05% | 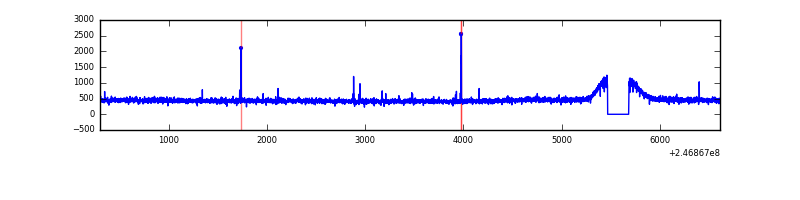 |
| D | 6308 | 6094 | 74 | 74 | 1.17% | 1.21% | 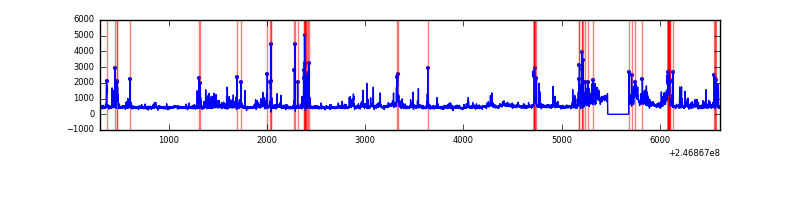 |
Top three noisy pixels from each quadrant. If the there are fewer than three noisy pixels in the level2.evt file, extra rows are filled as -1
| Pixel properties | Quadrant properties | ||||||
|---|---|---|---|---|---|---|---|
| Quadrant | DetID | PixID | Counts | Sigma | Mean | Median | Sigma |
| A | 13 | 251 | 435729 | 2920.54 | 718 | 701 | 149.0 |
| A | 8 | 5 | 286084 | 1915.91 | 718 | 701 | 149.0 |
| A | 14 | 238 | 274889 | 1840.75 | 718 | 701 | 149.0 |
| B | 3 | 64 | 1247107 | 9018.22 | 699 | 679 | 138.2 |
| B | 4 | 239 | 1057038 | 7643.02 | 699 | 679 | 138.2 |
| B | 0 | 230 | 29859 | 211.12 | 699 | 679 | 138.2 |
| C | 7 | 238 | 10062 | 55.41 | 710 | 713 | 168.7 |
| C | 5 | 128 | 9703 | 53.28 | 710 | 713 | 168.7 |
| C | 13 | 61 | 5193 | 26.55 | 710 | 713 | 168.7 |
| D | 13 | 249 | 224984 | 1323.81 | 698 | 678 | 169.4 |
| D | 8 | 195 | 178686 | 1050.57 | 698 | 678 | 169.4 |
| D | 1 | 52 | 160363 | 942.43 | 698 | 678 | 169.4 |
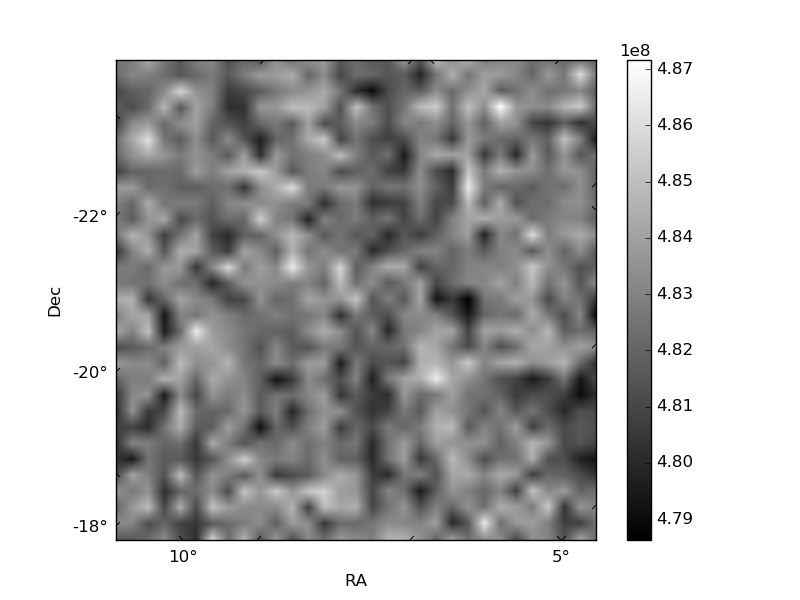
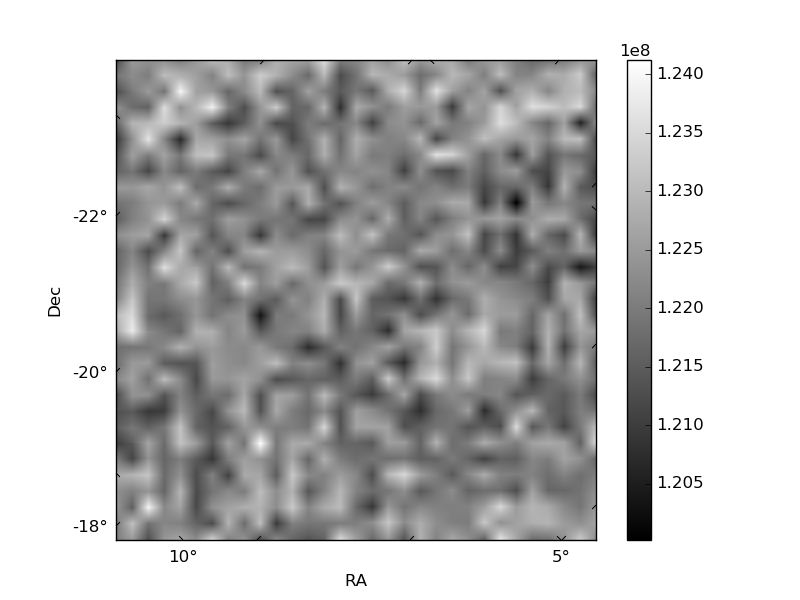
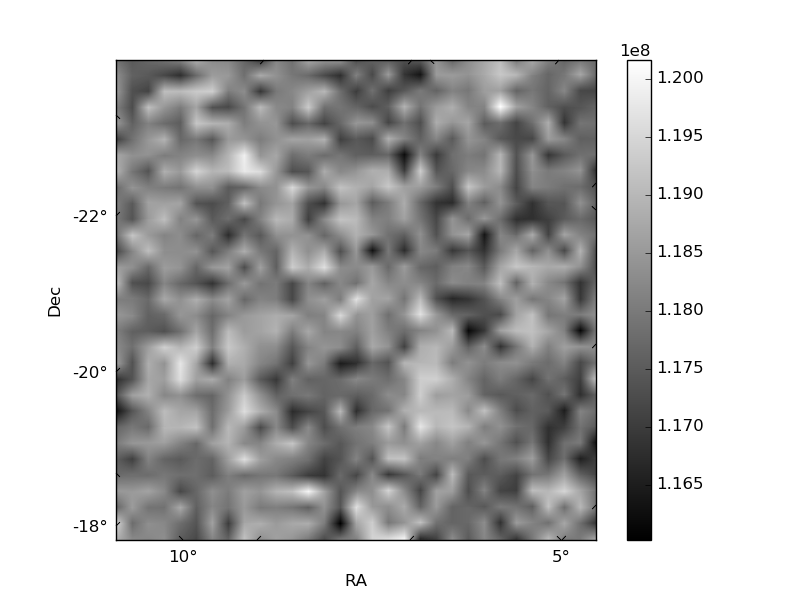
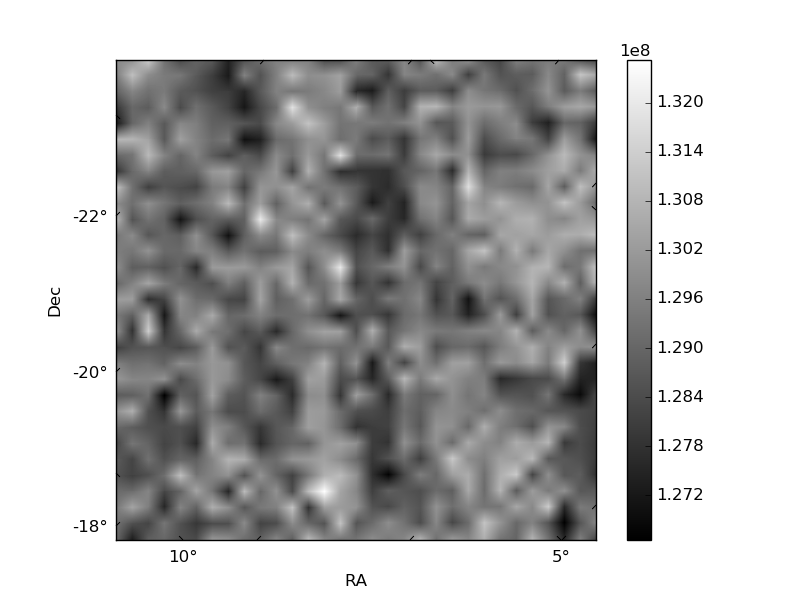
Histogram calculated using DETX and DETY for each event in the final _common_clean file
| Quadrant A | 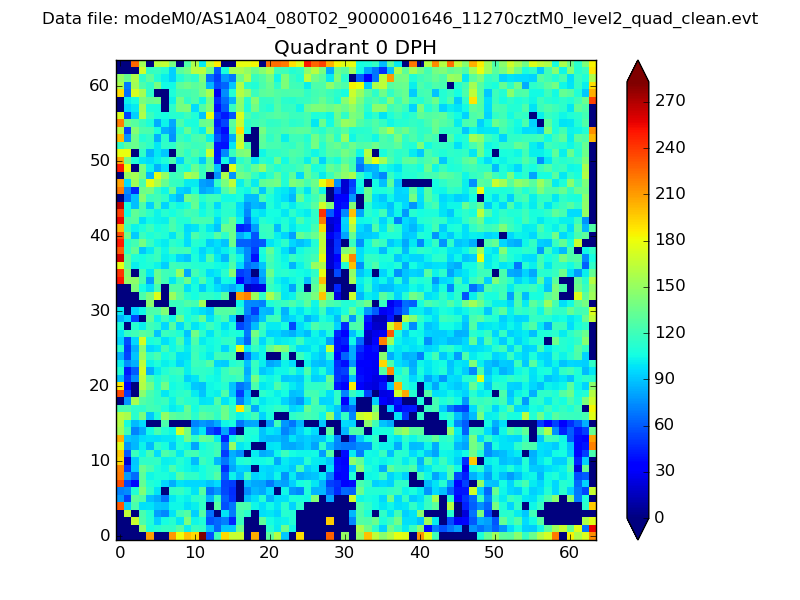 |
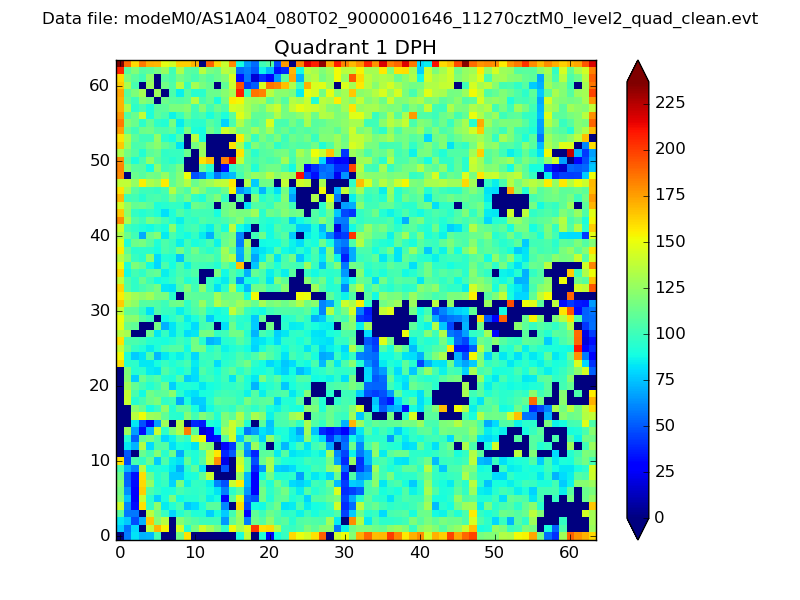 |
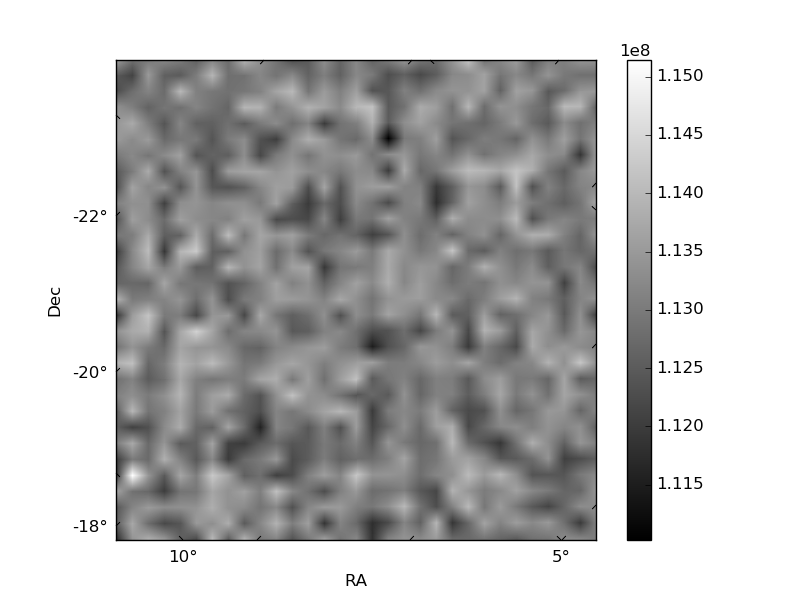
Quadrant B |
|---|---|---|---|
| Quadrant D | 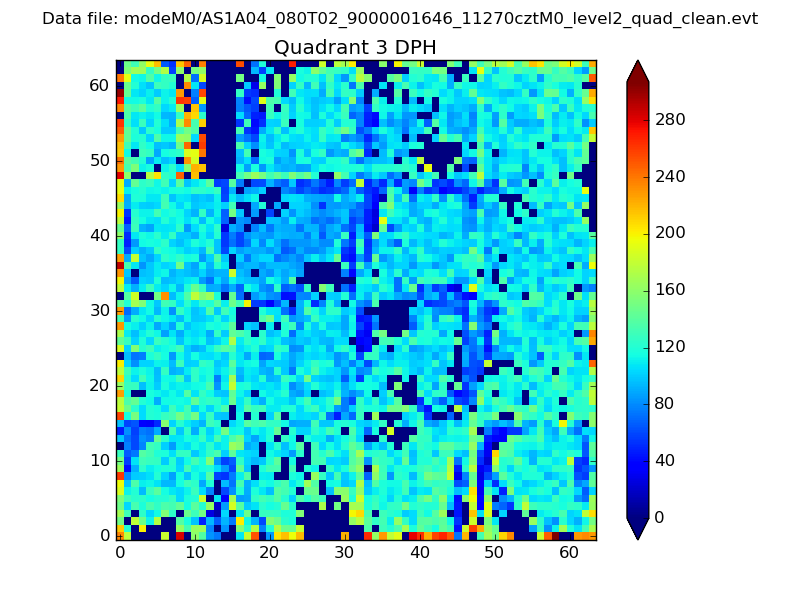 |
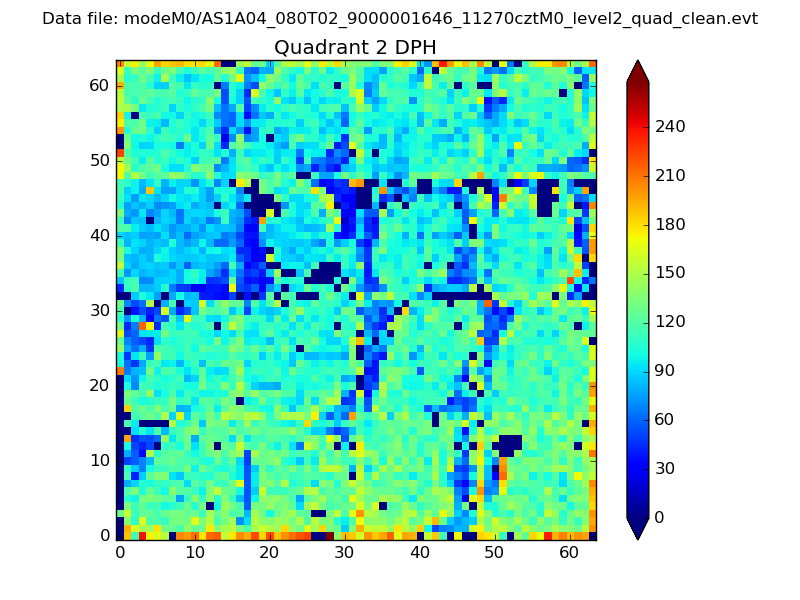 |
Quadrant C |
| Plot type | Count rate plots | Images |
|---|---|---|
| Comparison with Poisson distribution Blue bars denote a histogram of data divided into 1 sec bins. Red curve is a Poisson curve with rate = median count rate of data. |
 |
 |
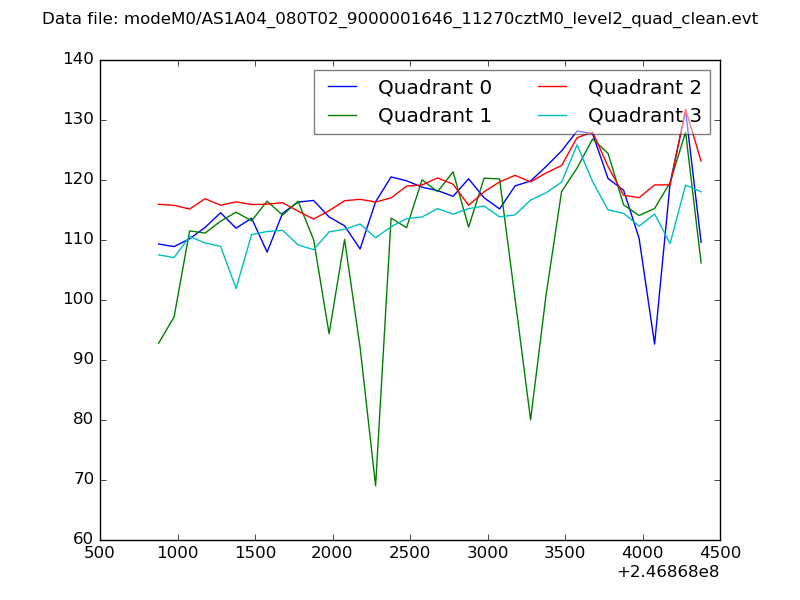
| Quadrant-wise count rates Data is divided into 100 sec bins |
 |
|
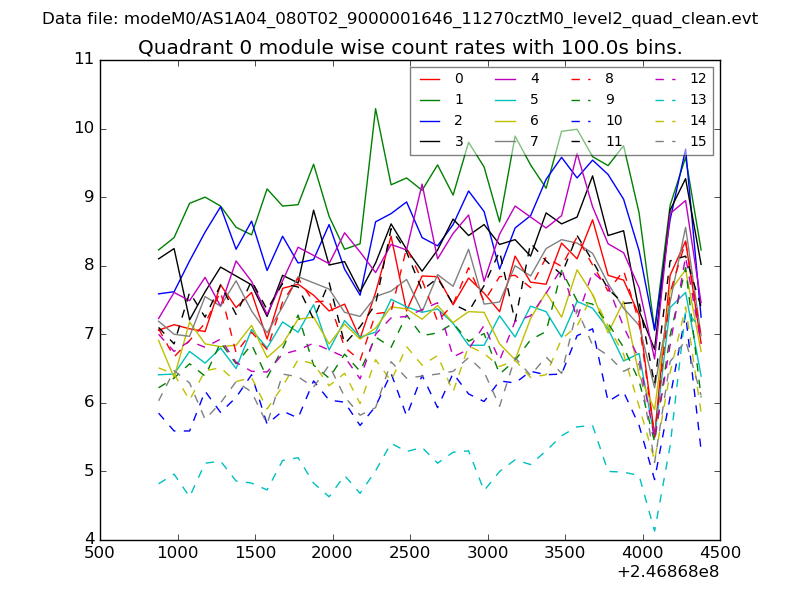
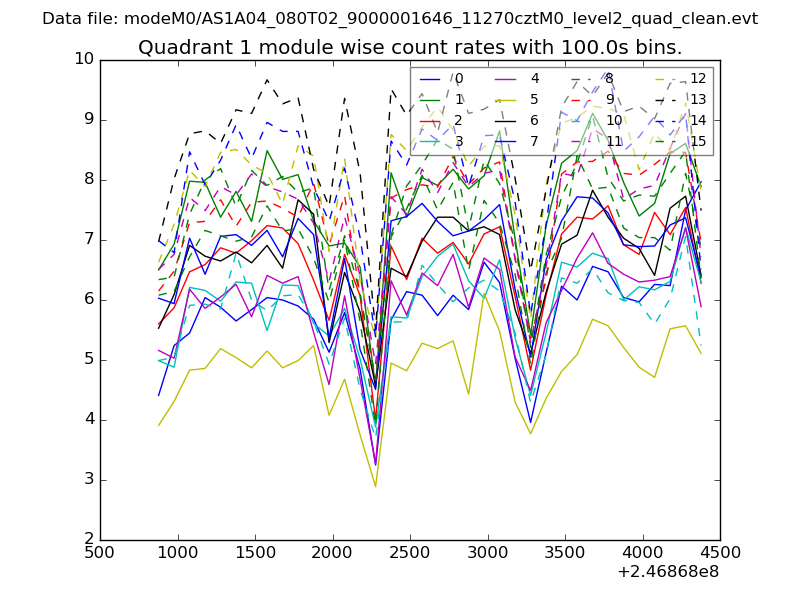
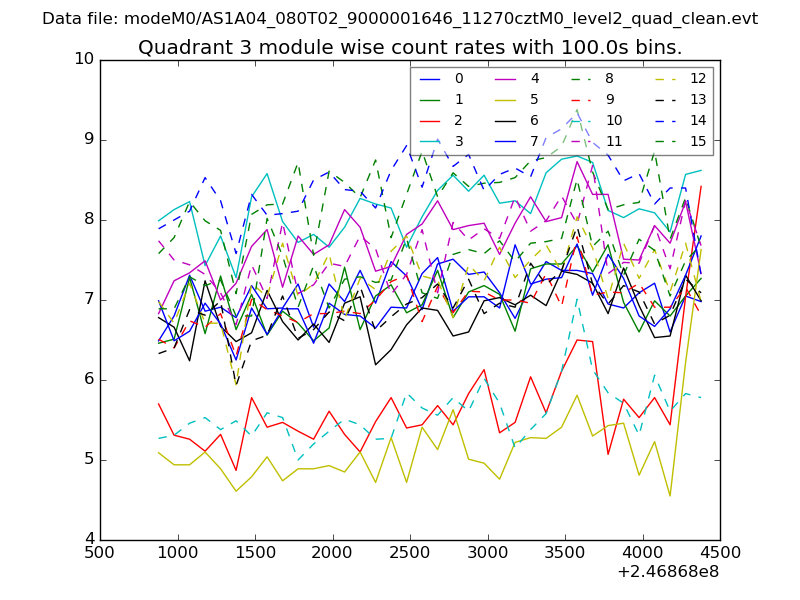
| Module-wise count rates for Quadrant A Data is divided into 100 sec bins |
 |
 |
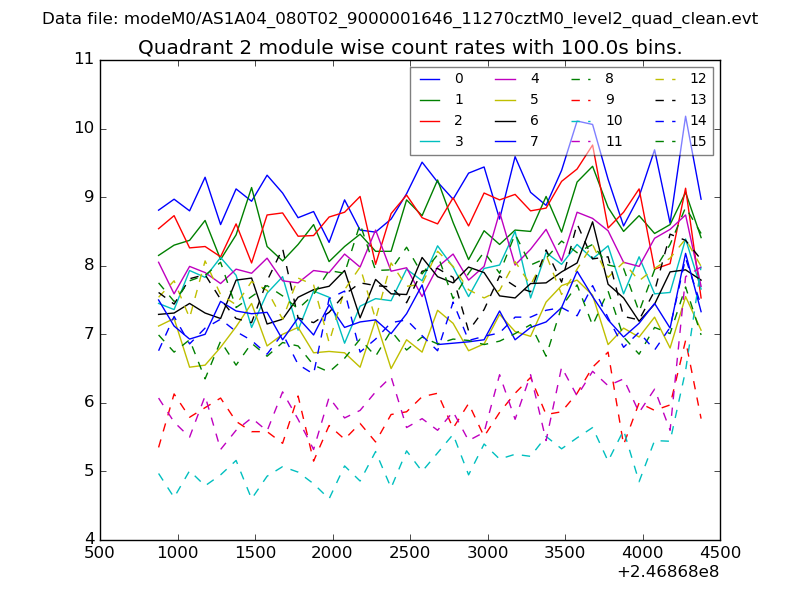
| Module-wise count rates for Quadrant B Data is divided into 100 sec bins |
 |
 |
| Module-wise count rates for Quadrant C Data is divided into 100 sec bins |
 |
 |
| Module-wise count rates for Quadrant D Data is divided into 100 sec bins |
 |
 |
| Parameter | Plot |
|---|---|
| CZT HV Monitor | 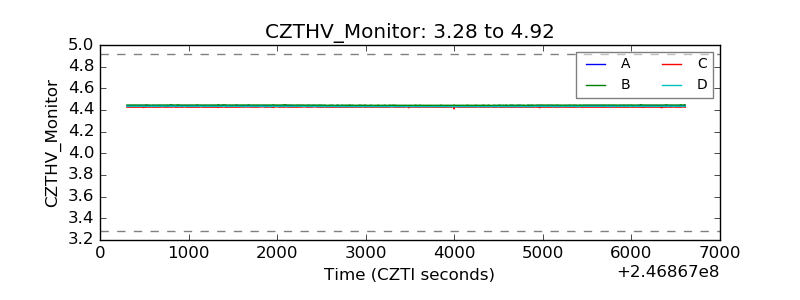 |
| D_VDD | 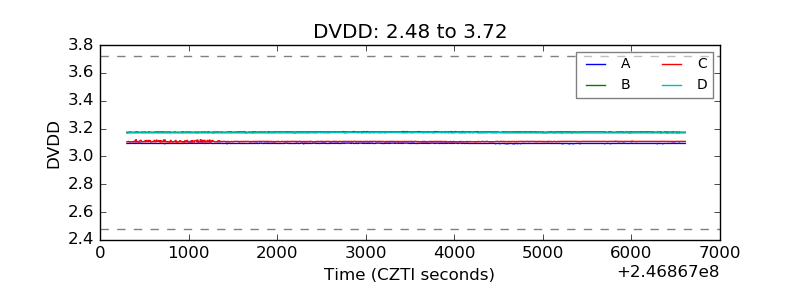 |
| Temperature 1 |  |
| Veto HV Monitor | 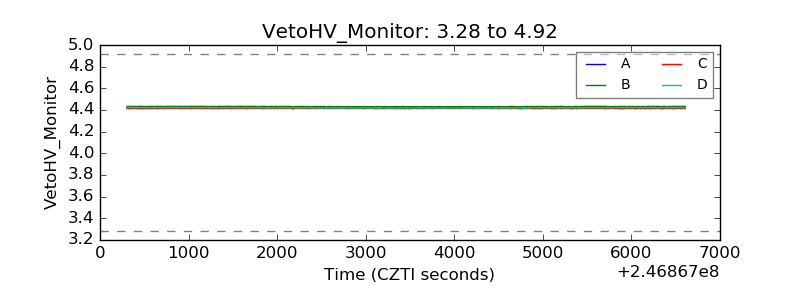 |
| Veto LLD |  |
| Alpha Counter | 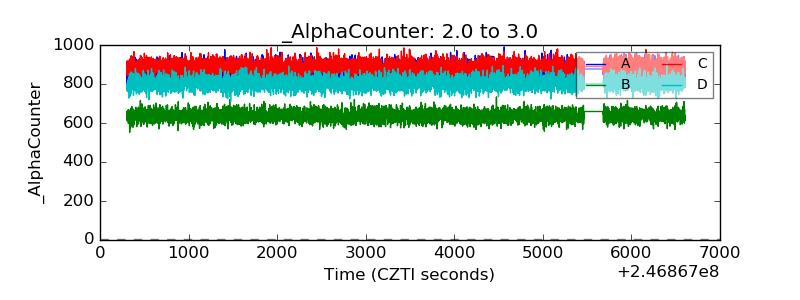 |
| _CPM_Rate | 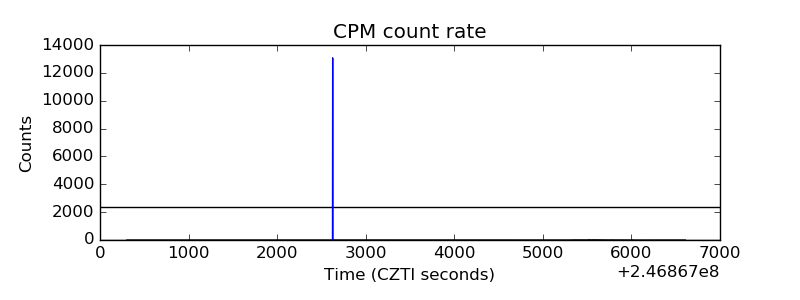 |
| CZT Counter | 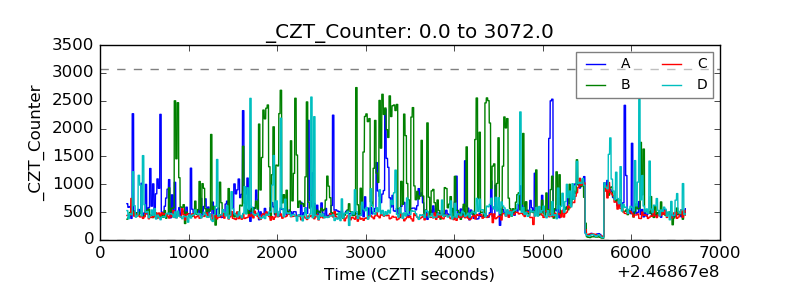 |
| +2.5 Volts monitor |  |
| +5 Volts monitor |  |
| _ROLL_ROT | 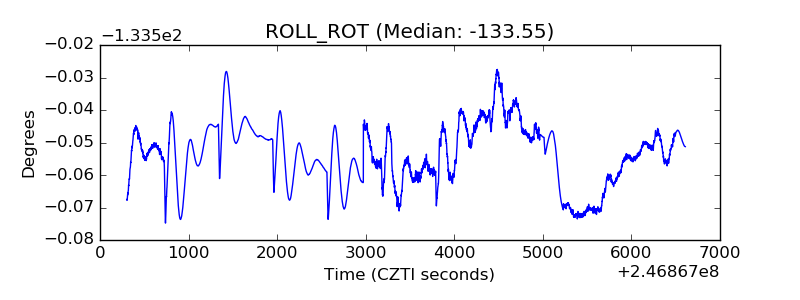 |
| _Roll_DEC | 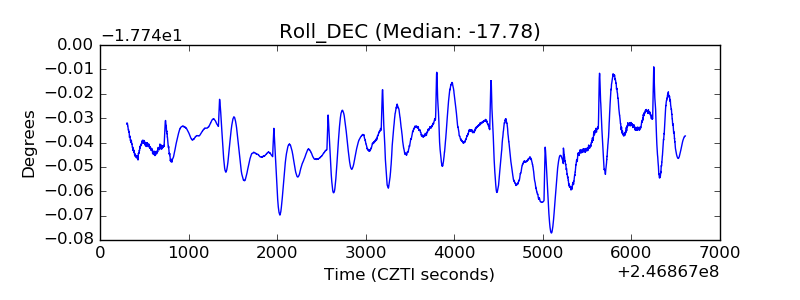 |
| _Roll_RA | 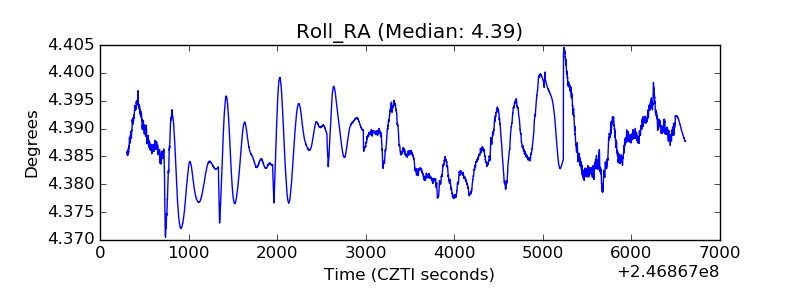 |
| Veto Counter | 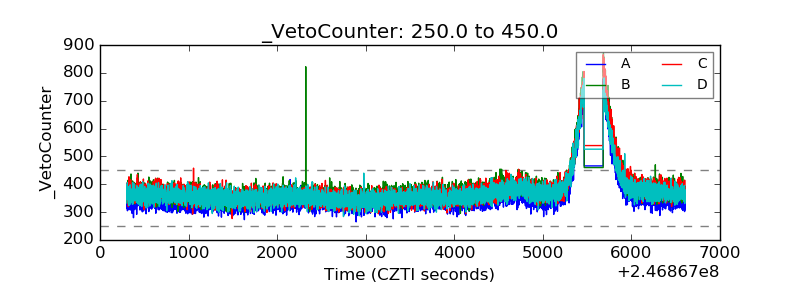 |