| Param | Original file | Final file |
|---|---|---|
| Filename | modeM0/AS1A04_080T03_9000001650cztM0_level2.fits | modeM0/AS1A04_080T03_9000001650cztM0_level2_quad_clean.evt |
| Size (bytes) | 51,183,360 | 45,918,720 |
| Size | 48.8 MB | 43.8 MB |
| Events in quadrant A | 257,444 | 205,640 |
| Events in quadrant B | 296,540 | 261,519 |
| Events in quadrant C | 314,578 | 266,143 |
| Events in quadrant D | 264,930 | 240,636 |
| Mode M0 | |||
|---|---|---|---|
| Quadrant | BADHDUFLAG | Total packets | Discarded packets |
| A | 0 | 28488 | 0 |
| B | 0 | 16290 | 0 |
| C | 0 | 12258 | 0 |
| D | 0 | 16114 | 0 |
| Mode SS | |||
|---|---|---|---|
| Quadrant | BADHDUFLAG | Total packets | Discarded packets |
| A | 0 | 118 | 0 |
| B | 0 | 118 | 0 |
| C | 0 | 118 | 0 |
| D | 0 | 118 | 0 |
| Quadrant | Total seconds | Saturated seconds | Saturation percentage |
|---|---|---|---|
| A | 5951 | 2028 | 34.078306% |
| B | 5951 | 504 | 8.469165% |
| C | 5951 | 96 | 1.613174% |
| D | 5951 | 260 | 4.369014% |
Noise dominated data is calculated using 1-second bins in cleaned event files. If a bin has >2000 counts, and if more than 50% of those come from <1% of pixels, then it is considered to be noise-dominated and hence unusable.
| Quadrant | # 1 sec bins | Bins with >0 counts | Bins with >2000 counts | High rate bins dominated by noise | Noise dominated (total time) | Noise dominated (detector-on time) | Marked lightcurve |
|---|---|---|---|---|---|---|---|
| A | 5966 | 5933 | 0 | 0 | 0.00% | 0.00% | 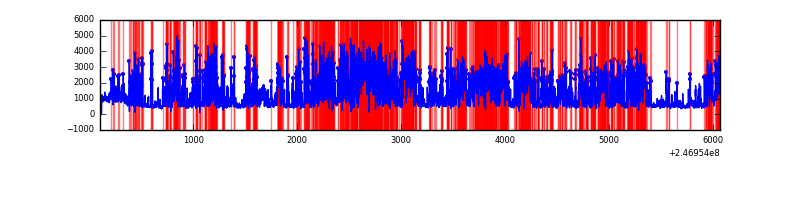 |
| B | 5966 | 5950 | 0 | 0 | 0.00% | 0.00% | 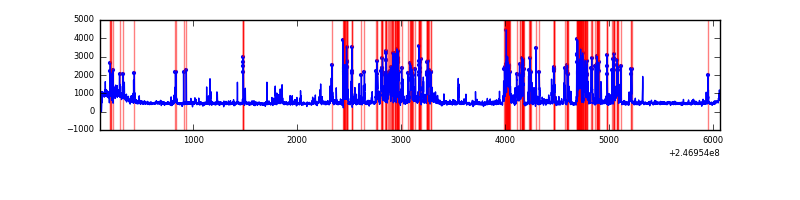 |
| C | 5966 | 5951 | 0 | 0 | 0.00% | 0.00% | 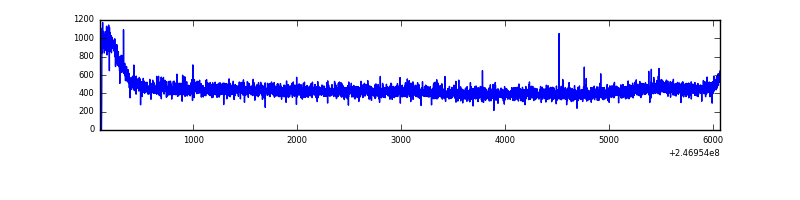 |
| D | 5966 | 5949 | 0 | 0 | 0.00% | 0.00% | 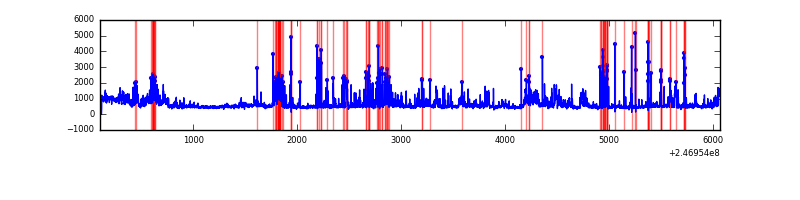 |
Top three noisy pixels from each quadrant. If the there are fewer than three noisy pixels in the level2.evt file, extra rows are filled as -1
| Pixel properties | Quadrant properties | ||||||
|---|---|---|---|---|---|---|---|
| Quadrant | DetID | PixID | Counts | Sigma | Mean | Median | Sigma |
| A | 0 | 29 | 239 | 9.26 | 66 | 62 | 19.1 |
| A | 14 | 188 | 227 | 8.63 | 66 | 62 | 19.1 |
| A | 7 | 110 | 212 | 7.85 | 66 | 62 | 19.1 |
| B | 2 | 9 | 248 | 9.55 | 78 | 74 | 18.2 |
| B | 14 | 254 | 224 | 8.23 | 78 | 74 | 18.2 |
| B | 3 | 17 | 215 | 7.74 | 78 | 74 | 18.2 |
| C | 1 | 80 | 243 | 7.07 | 83 | 77 | 23.5 |
| C | 1 | 81 | 232 | 6.6 | 83 | 77 | 23.5 |
| C | 2 | 191 | 226 | 6.34 | 83 | 77 | 23.5 |
| D | 3 | 31 | 217 | 6.63 | 75 | 68 | 22.5 |
| D | 7 | 5 | 201 | 5.92 | 75 | 68 | 22.5 |
| D | 3 | 14 | 201 | 5.92 | 75 | 68 | 22.5 |
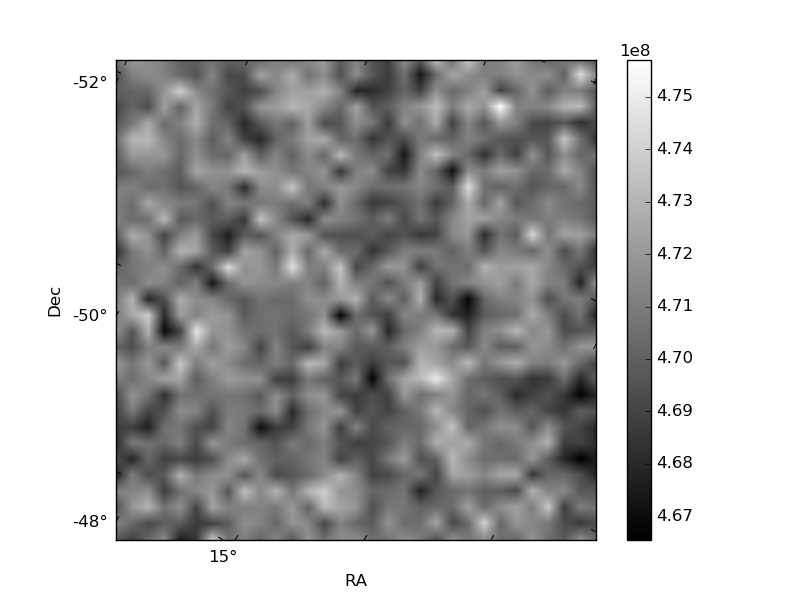
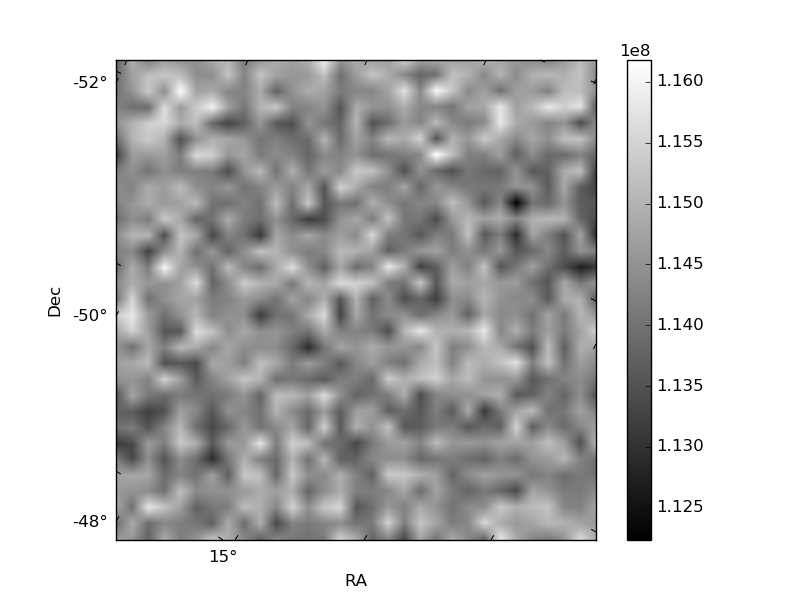
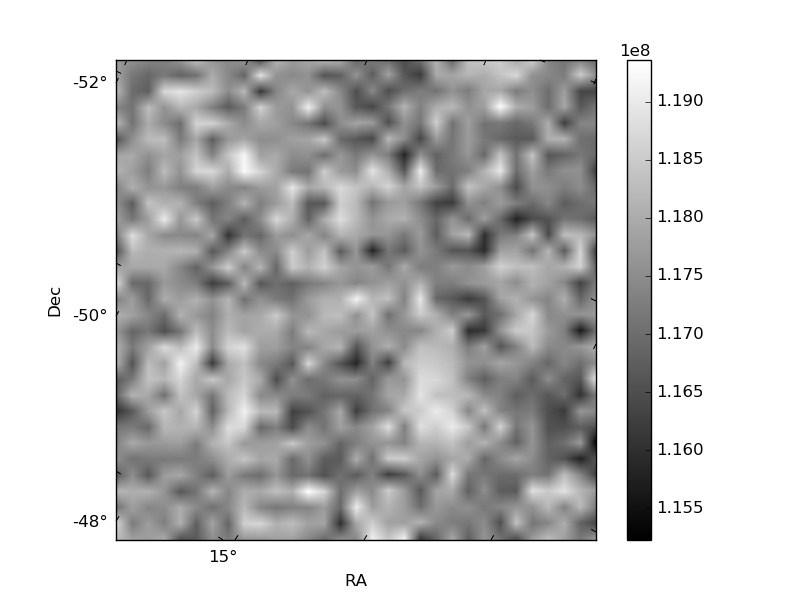
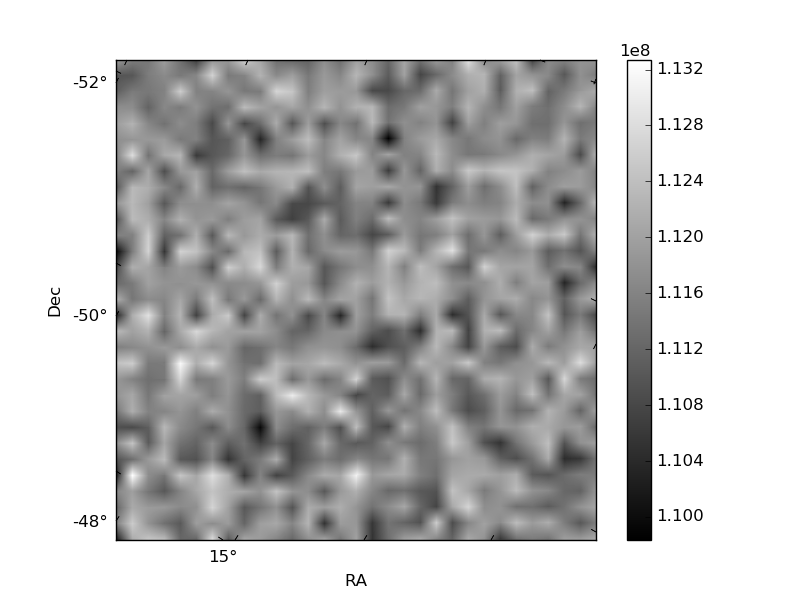
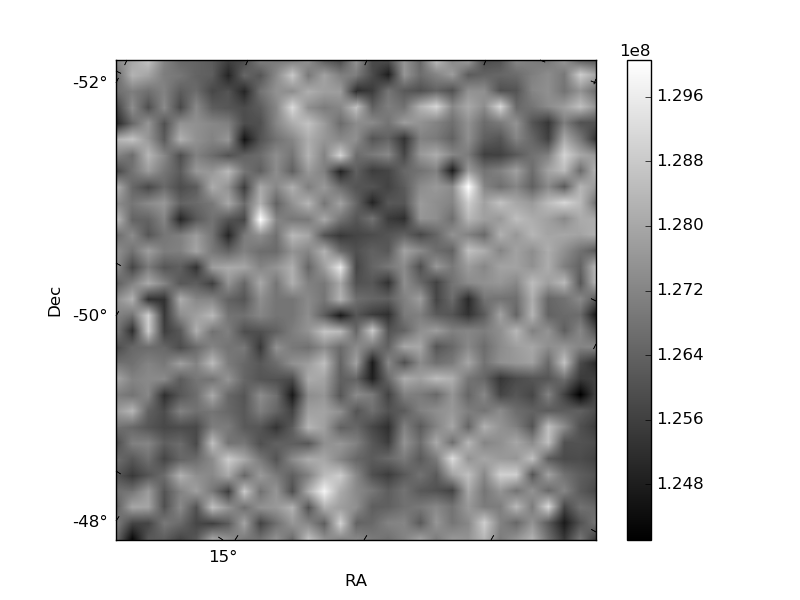
Histogram calculated using DETX and DETY for each event in the final _common_clean file
| Quadrant A | 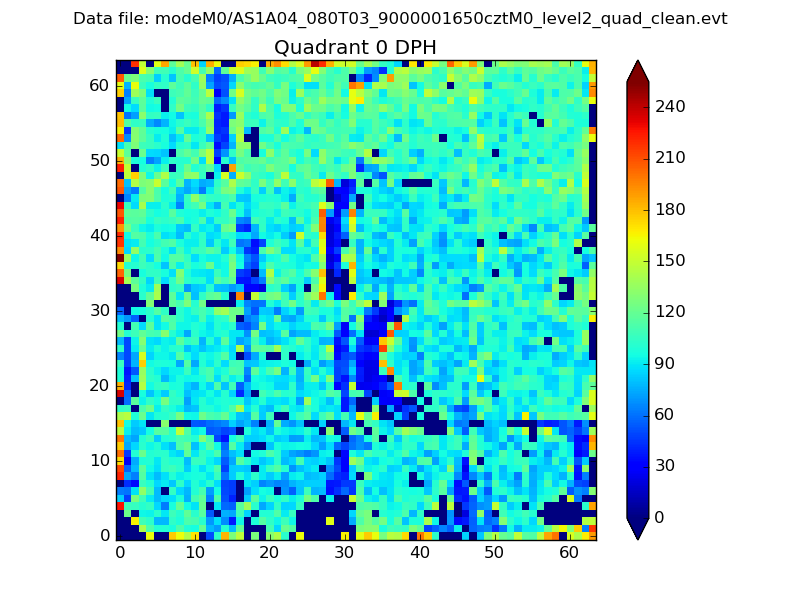 |
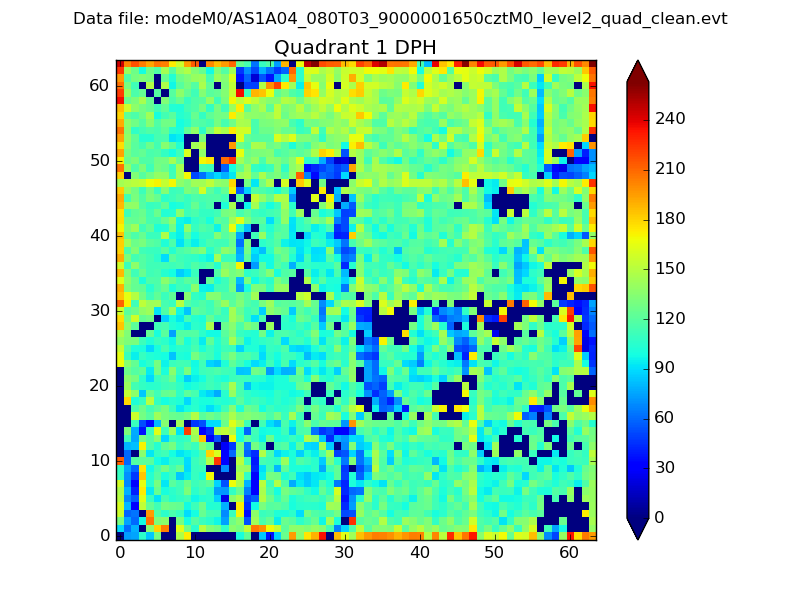 |
Quadrant B |
|---|---|---|---|
| Quadrant D | 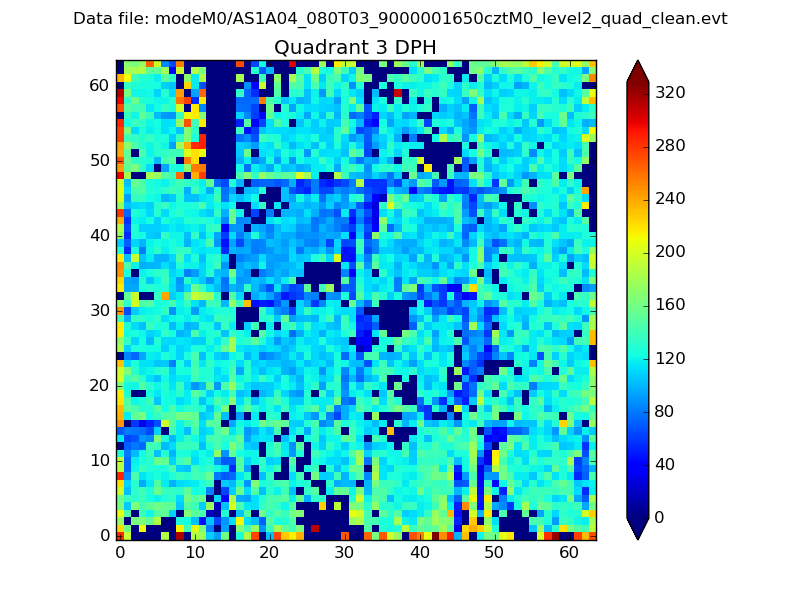 |
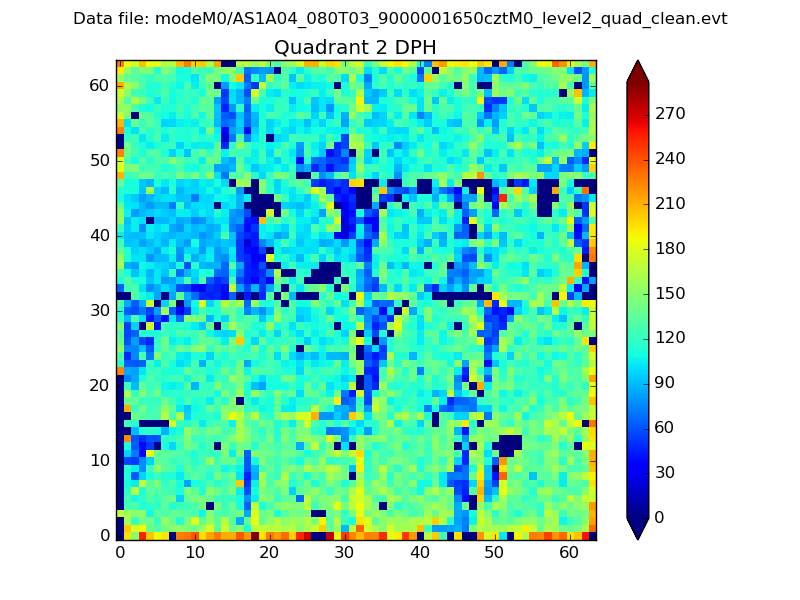 |
Quadrant C |
| Plot type | Count rate plots | Images |
|---|---|---|
| Comparison with Poisson distribution Blue bars denote a histogram of data divided into 1 sec bins. Red curve is a Poisson curve with rate = median count rate of data. |
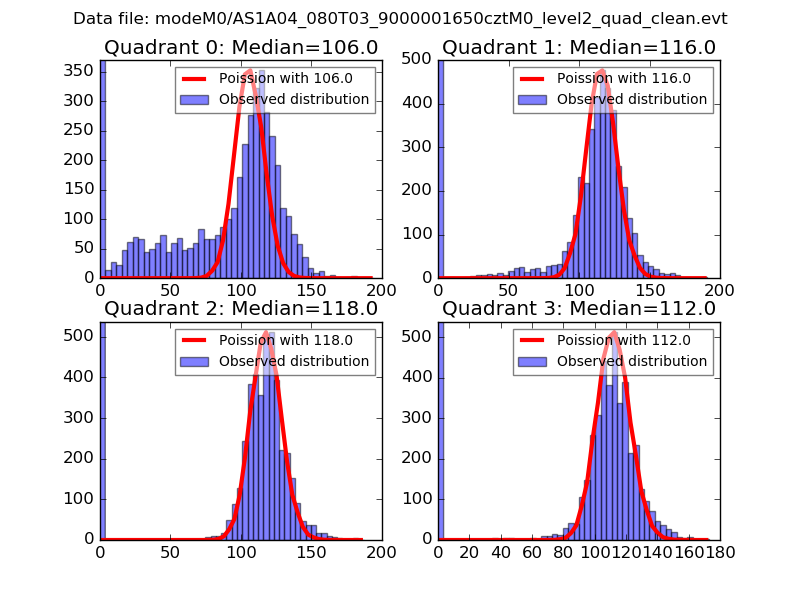 |
 |
| Quadrant-wise count rates Data is divided into 100 sec bins |
 |
|
| Module-wise count rates for Quadrant A Data is divided into 100 sec bins |
 |
 |
| Module-wise count rates for Quadrant B Data is divided into 100 sec bins |
 |
 |
| Module-wise count rates for Quadrant C Data is divided into 100 sec bins |
 |
 |
| Module-wise count rates for Quadrant D Data is divided into 100 sec bins |
 |
 |
| Parameter | Plot |
|---|---|
| CZT HV Monitor |  |
| D_VDD | 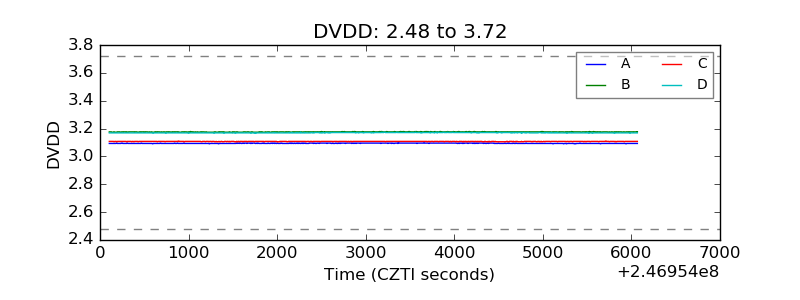 |
| Temperature 1 | 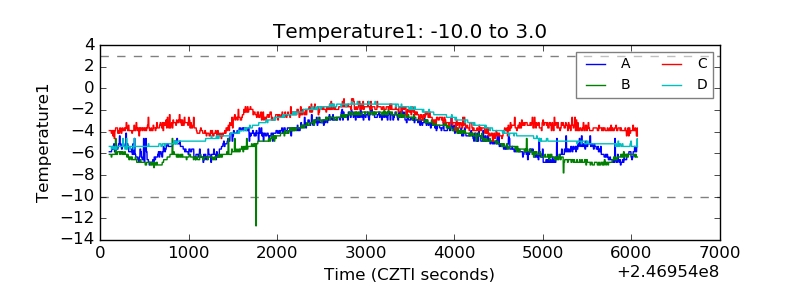 |
| Veto HV Monitor |  |
| Veto LLD | 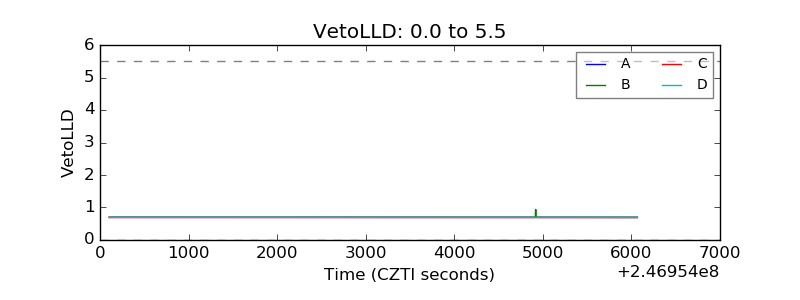 |
| Alpha Counter | 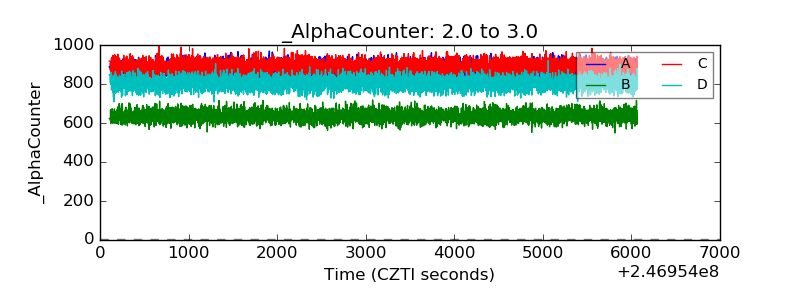 |
| _CPM_Rate | 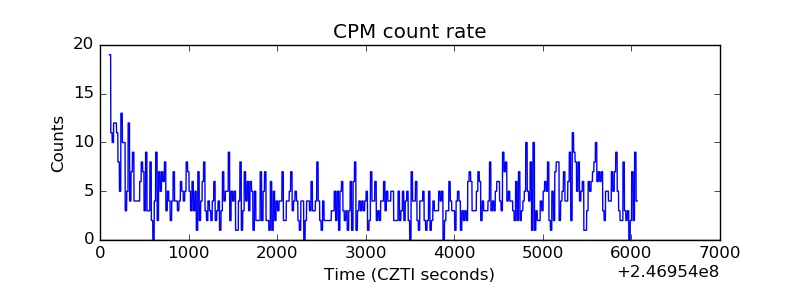 |
| CZT Counter |  |
| +2.5 Volts monitor |  |
| +5 Volts monitor | 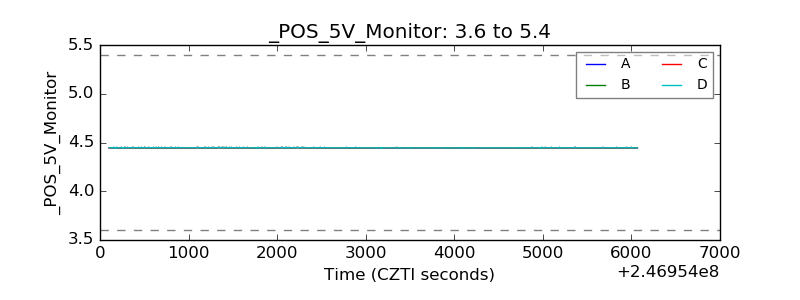 |
| _ROLL_ROT | 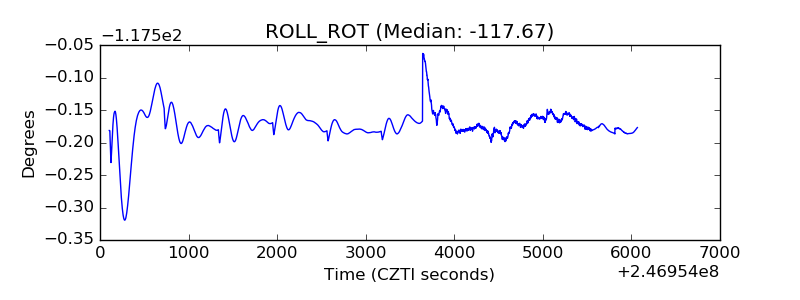 |
| _Roll_DEC | 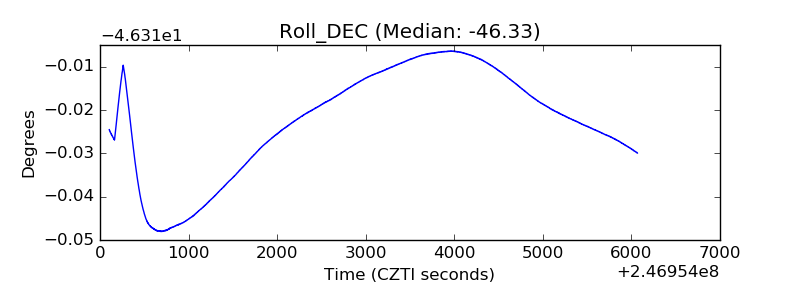 |
| _Roll_RA | 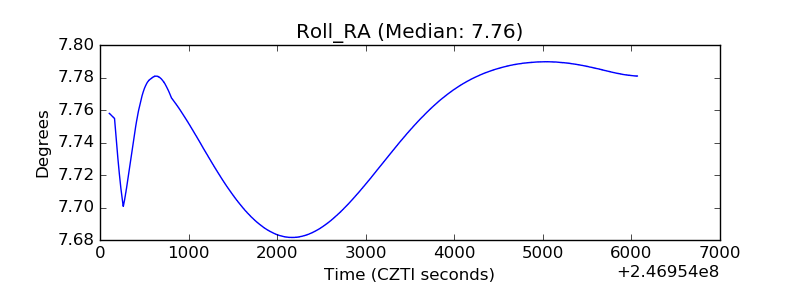 |
| Veto Counter |  |