| Param | Original file | Final file |
|---|---|---|
| Filename | modeM0/AS1A04_080T03_9000001650_11280cztM0_level2.evt | modeM0/AS1A04_080T03_9000001650_11280cztM0_level2_quad_clean.evt |
| Size (bytes) | 170,847,360 | 9,636,480 |
| Size | 162.9 MB | 9.2 MB |
| Events in quadrant A | 1,926,425 | 39,667 |
| Events in quadrant B | 1,005,226 | 41,296 |
| Events in quadrant C | 868,396 | 43,282 |
| Events in quadrant D | 1,255,080 | 40,674 |
| Mode M0 | |||
|---|---|---|---|
| Quadrant | BADHDUFLAG | Total packets | Discarded packets |
| A | 0 | 6916 | 2 |
| B | 0 | 4149 | 1 |
| C | 0 | 3777 | 1 |
| D | 0 | 4850 | 1 |
| Mode SS | |||
|---|---|---|---|
| Quadrant | BADHDUFLAG | Total packets | Discarded packets |
| A | 0 | 34 | 0 |
| B | 0 | 34 | 0 |
| C | 0 | 34 | 0 |
| D | 0 | 34 | 0 |
| Quadrant | Total seconds | Saturated seconds | Saturation percentage |
|---|---|---|---|
| A | 1718 | 459 | 26.717113% |
| B | 1718 | 160 | 9.313155% |
| C | 1718 | 96 | 5.587893% |
| D | 1718 | 144 | 8.381839% |
Noise dominated data is calculated using 1-second bins in cleaned event files. If a bin has >2000 counts, and if more than 50% of those come from <1% of pixels, then it is considered to be noise-dominated and hence unusable.
| Quadrant | # 1 sec bins | Bins with >0 counts | Bins with >2000 counts | High rate bins dominated by noise | Noise dominated (total time) | Noise dominated (detector-on time) | Marked lightcurve |
|---|---|---|---|---|---|---|---|
| A | 1733 | 1719 | 206 | 206 | 11.89% | 11.98% | 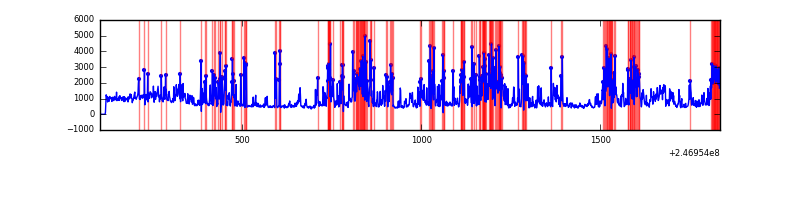 |
| B | 1733 | 1719 | 16 | 16 | 0.92% | 0.93% | 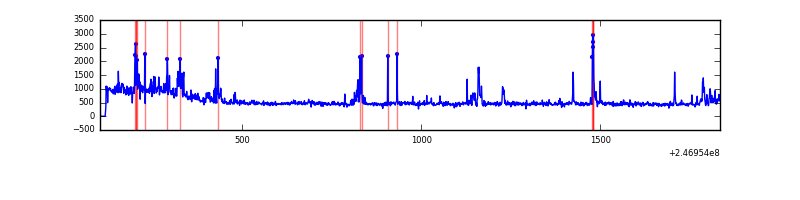 |
| C | 1733 | 1719 | 0 | 0 | 0.00% | 0.00% | 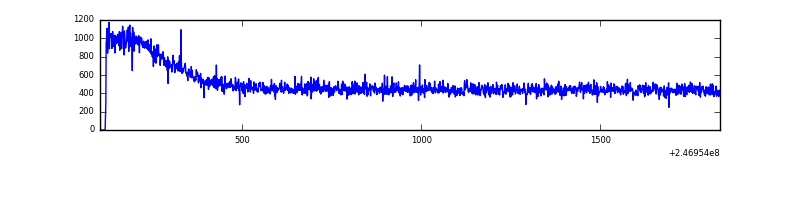 |
| D | 1733 | 1719 | 35 | 35 | 2.02% | 2.04% | 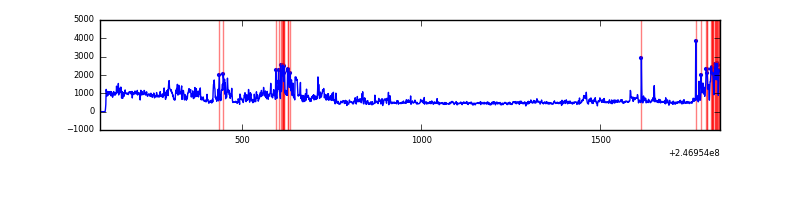 |
Top three noisy pixels from each quadrant. If the there are fewer than three noisy pixels in the level2.evt file, extra rows are filled as -1
| Pixel properties | Quadrant properties | ||||||
|---|---|---|---|---|---|---|---|
| Quadrant | DetID | PixID | Counts | Sigma | Mean | Median | Sigma |
| A | 8 | 5 | 993858 | 22536.54 | 202 | 197 | 44.1 |
| A | 14 | 238 | 121710 | 2755.95 | 202 | 197 | 44.1 |
| A | 8 | 15 | 8741 | 193.78 | 202 | 197 | 44.1 |
| B | 3 | 64 | 74562 | 1672.7 | 216 | 209 | 44.5 |
| B | 4 | 239 | 68629 | 1539.23 | 216 | 209 | 44.5 |
| B | 4 | 81 | 11322 | 250.01 | 216 | 209 | 44.5 |
| C | 9 | 204 | 2526 | 42.98 | 221 | 221 | 53.6 |
| C | 13 | 61 | 1539 | 24.57 | 221 | 221 | 53.6 |
| C | 14 | 234 | 621 | 7.46 | 221 | 221 | 53.6 |
| D | 13 | 152 | 141540 | 2585.48 | 216 | 208 | 54.7 |
| D | 12 | 157 | 128945 | 2355.07 | 216 | 208 | 54.7 |
| D | 1 | 52 | 71963 | 1312.66 | 216 | 208 | 54.7 |
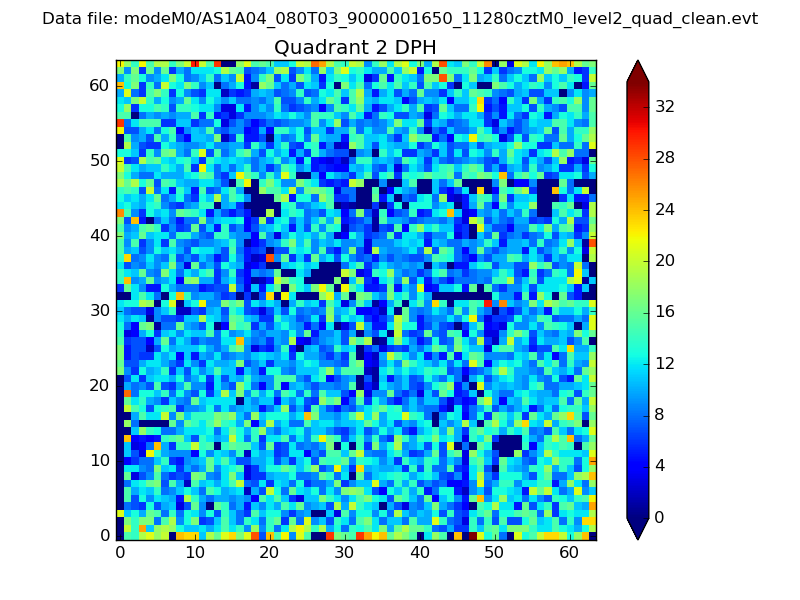
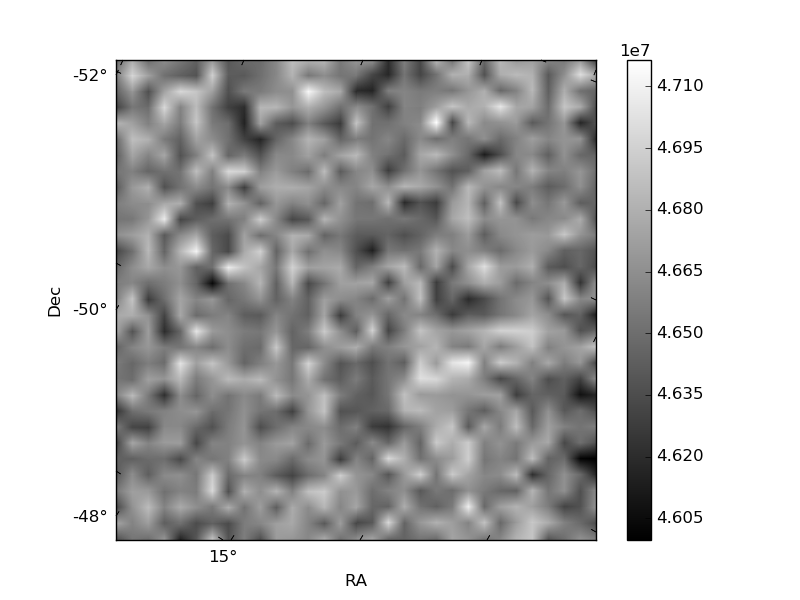
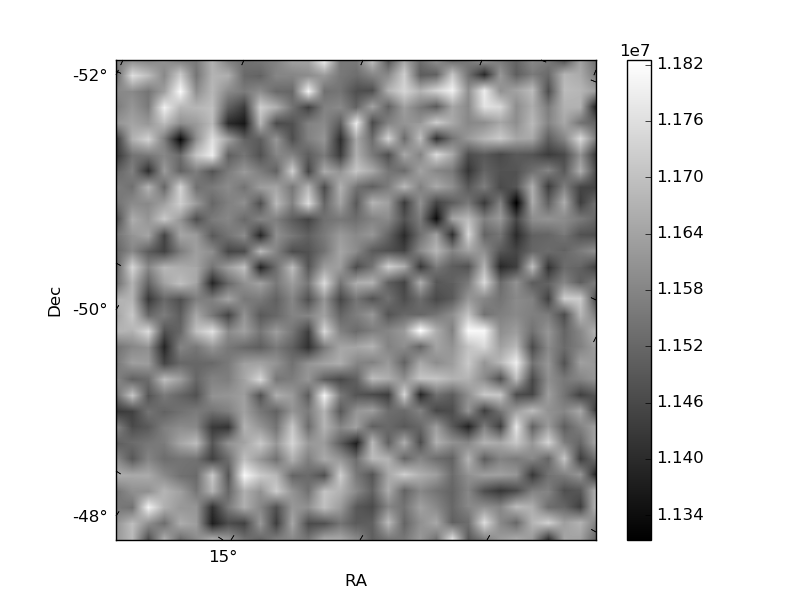
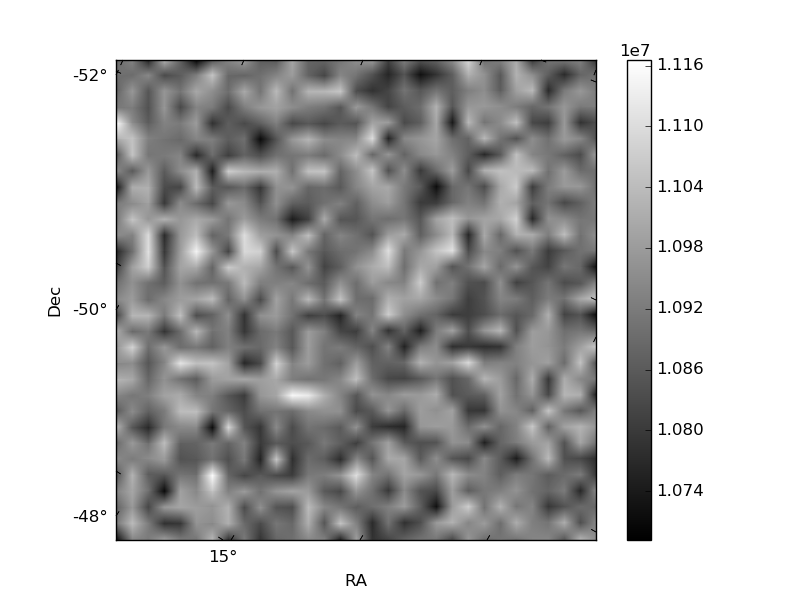
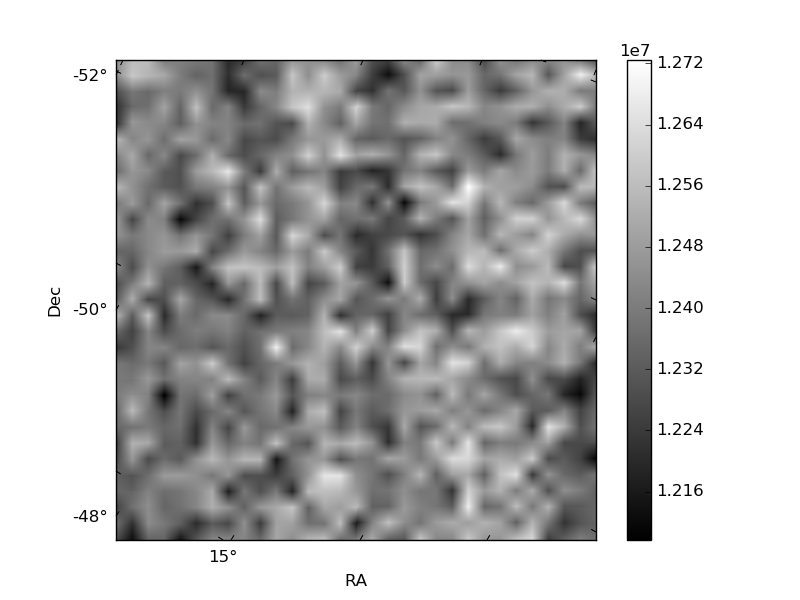
Histogram calculated using DETX and DETY for each event in the final _common_clean file
| Quadrant A | 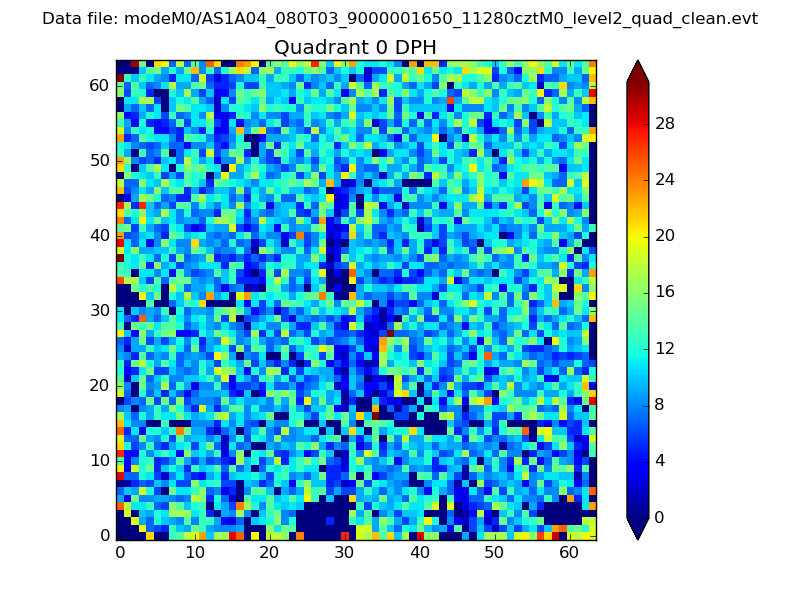 |
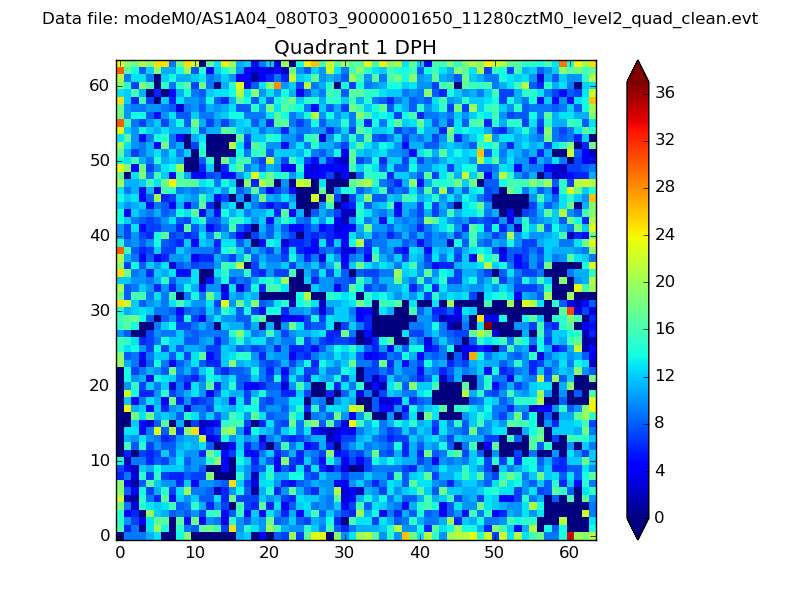 |
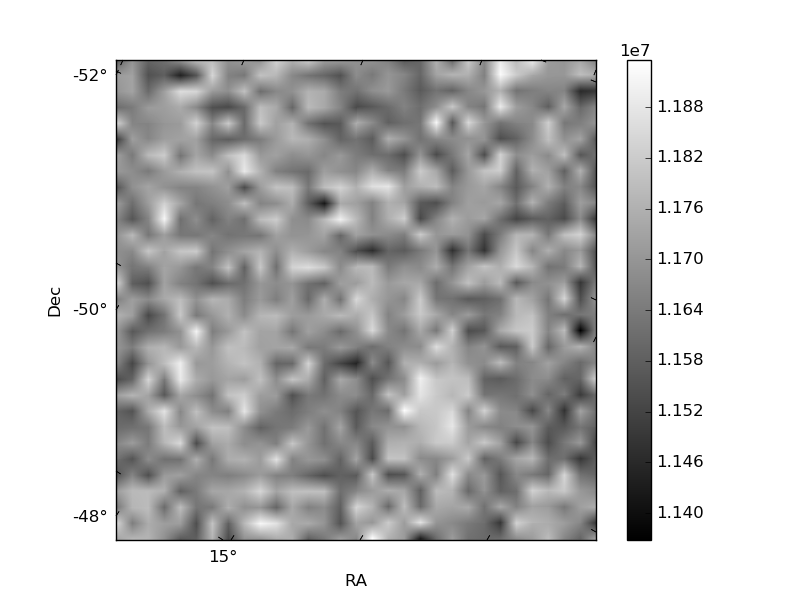
Quadrant B |
|---|---|---|---|
| Quadrant D | 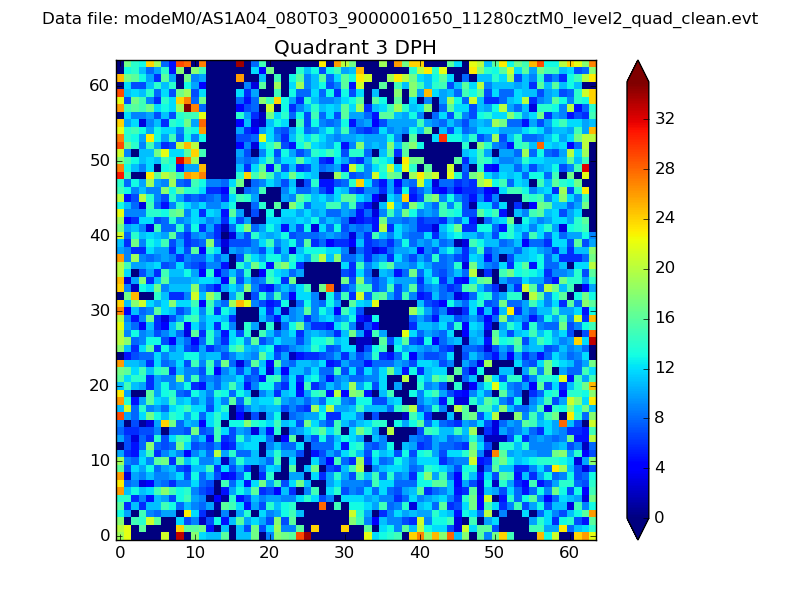 |
 |
Quadrant C |
| Plot type | Count rate plots | Images |
|---|---|---|
| Comparison with Poisson distribution Blue bars denote a histogram of data divided into 1 sec bins. Red curve is a Poisson curve with rate = median count rate of data. |
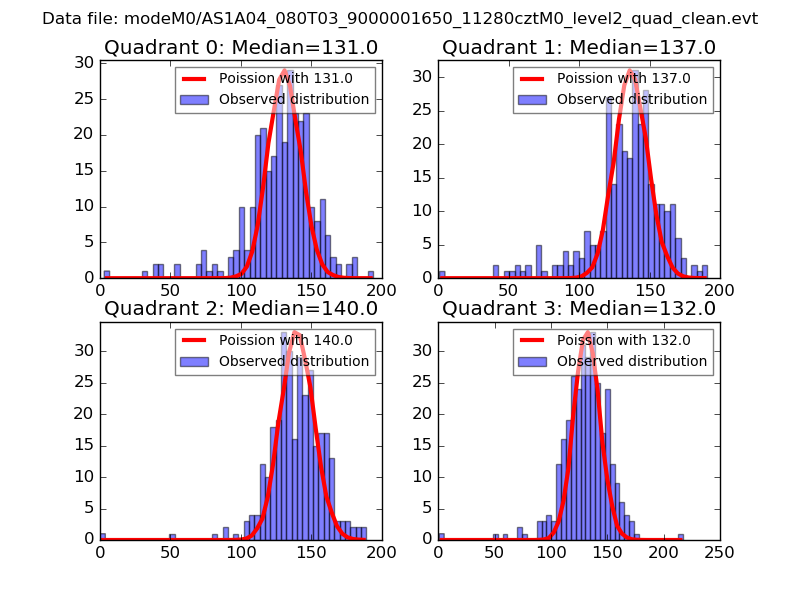 |
 |
| Quadrant-wise count rates Data is divided into 100 sec bins |
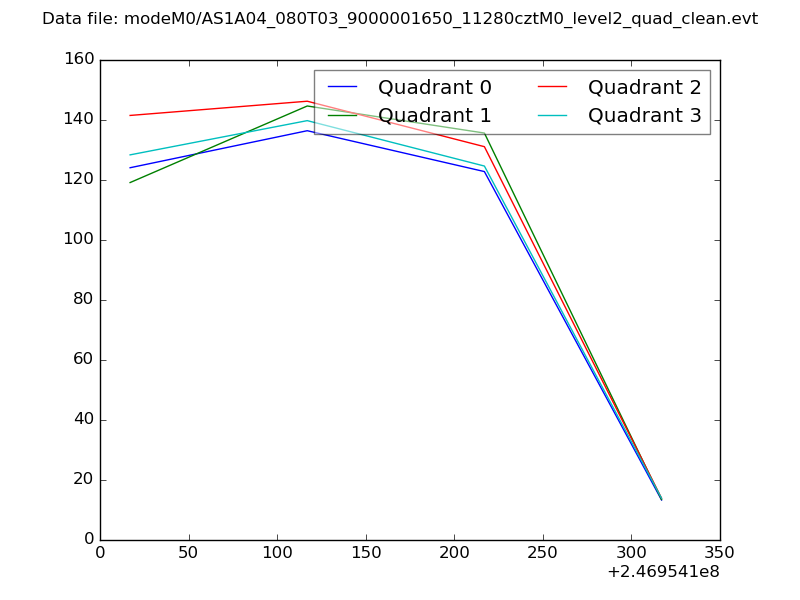 |
|
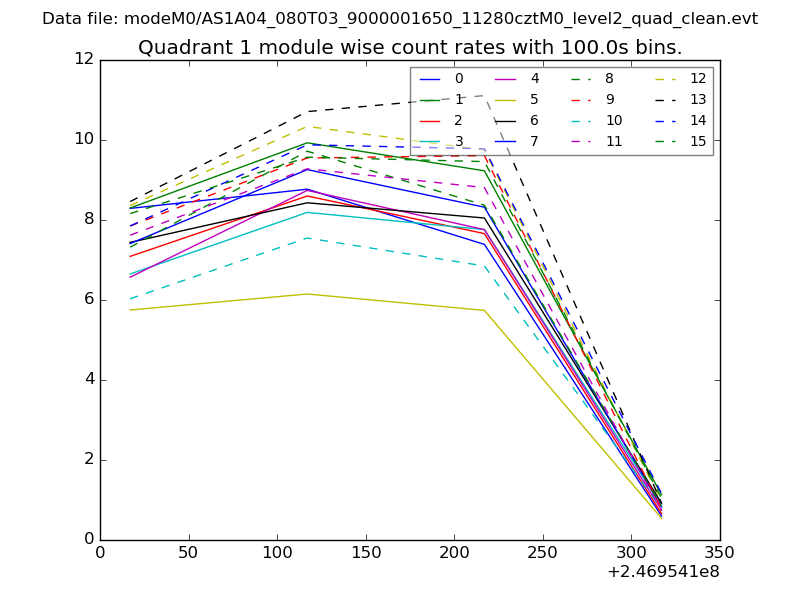
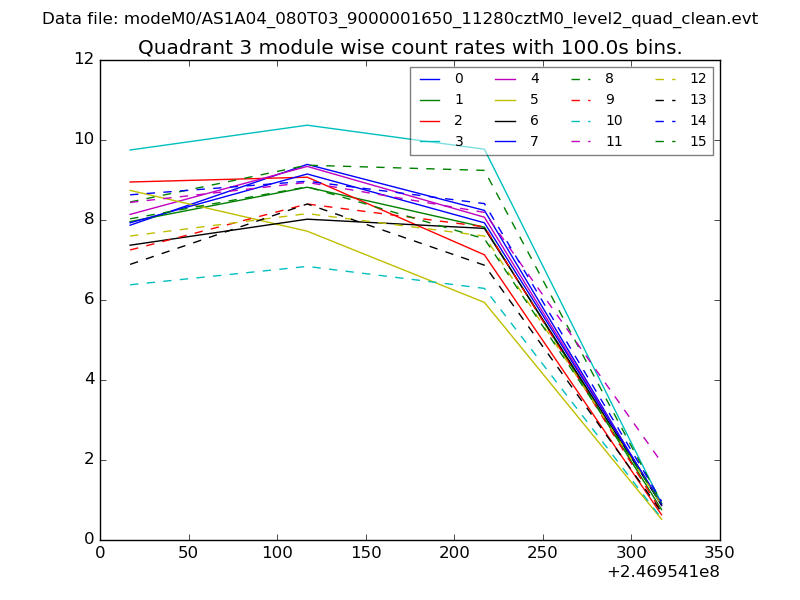
| Module-wise count rates for Quadrant A Data is divided into 100 sec bins |
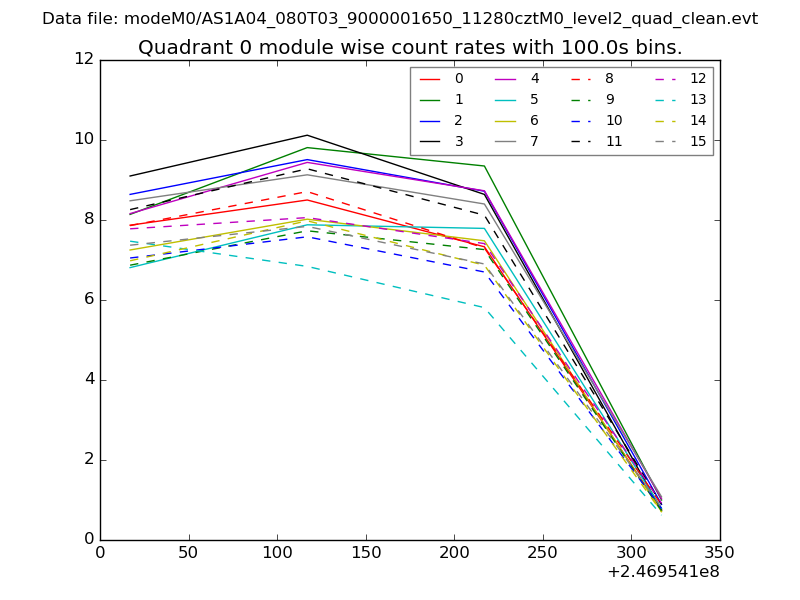 |
 |
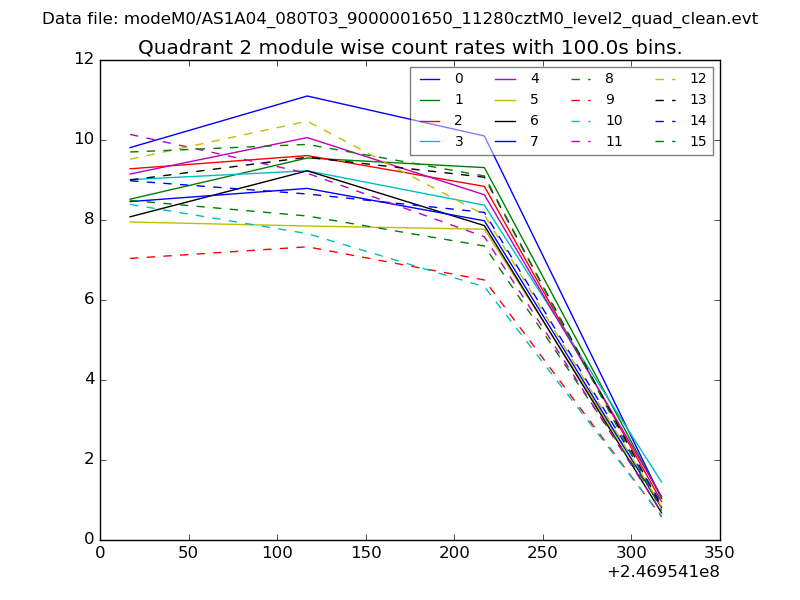
| Module-wise count rates for Quadrant B Data is divided into 100 sec bins |
 |
 |
| Module-wise count rates for Quadrant C Data is divided into 100 sec bins |
 |
 |
| Module-wise count rates for Quadrant D Data is divided into 100 sec bins |
 |
 |
| Parameter | Plot |
|---|---|
| CZT HV Monitor | 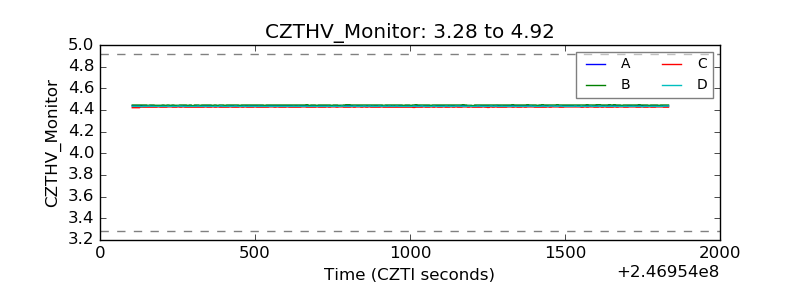 |
| D_VDD | 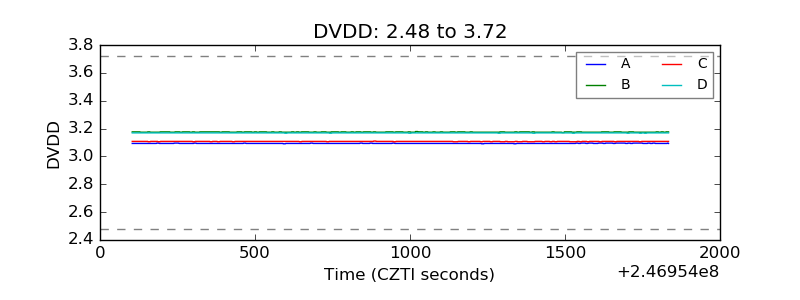 |
| Temperature 1 | 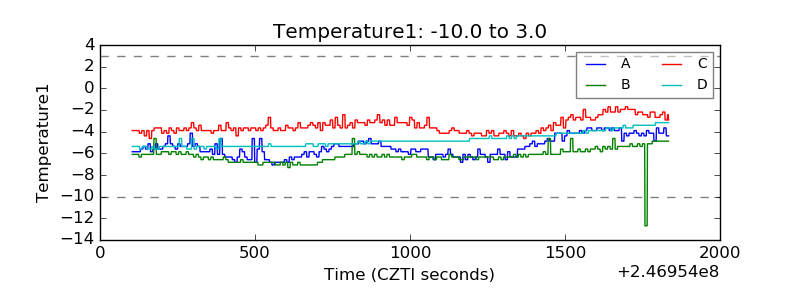 |
| Veto HV Monitor | 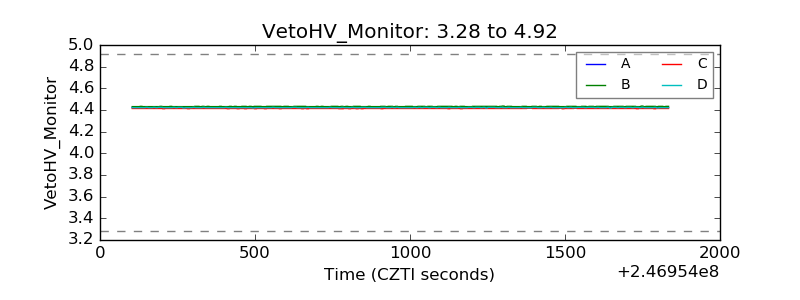 |
| Veto LLD | 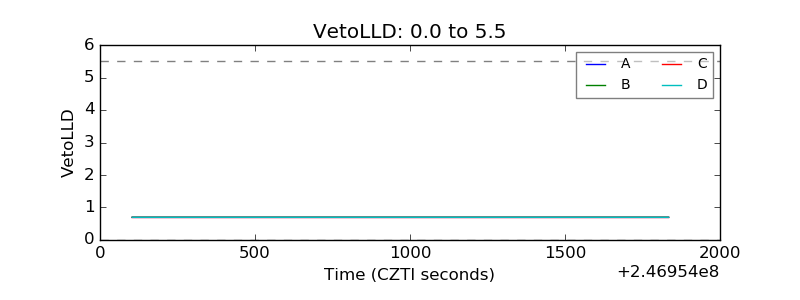 |
| Alpha Counter | 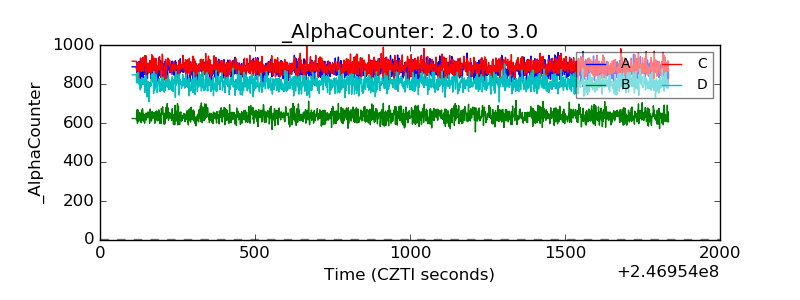 |
| _CPM_Rate | 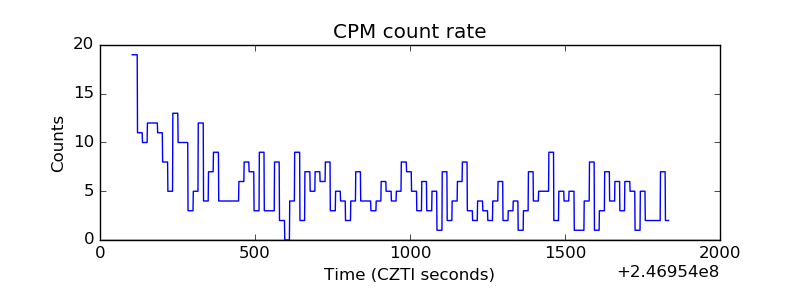 |
| CZT Counter | 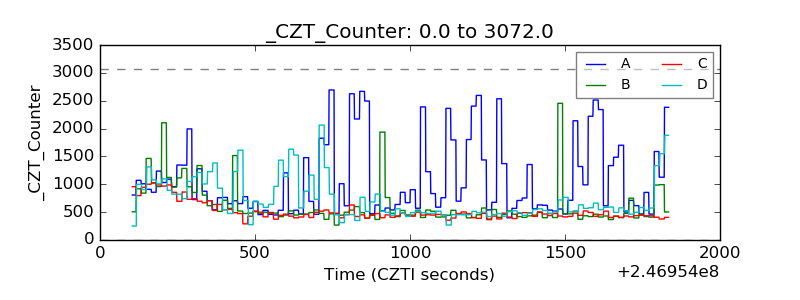 |
| +2.5 Volts monitor |  |
| +5 Volts monitor |  |
| _ROLL_ROT | 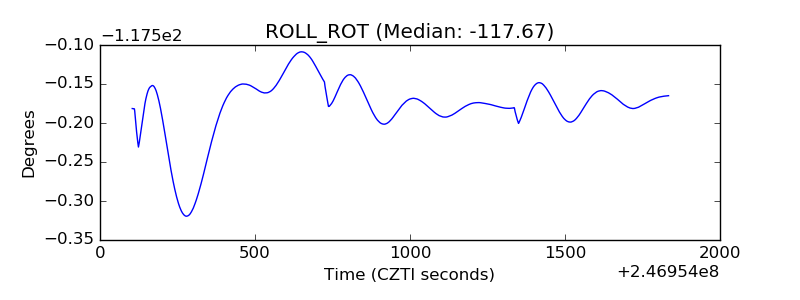 |
| _Roll_DEC | 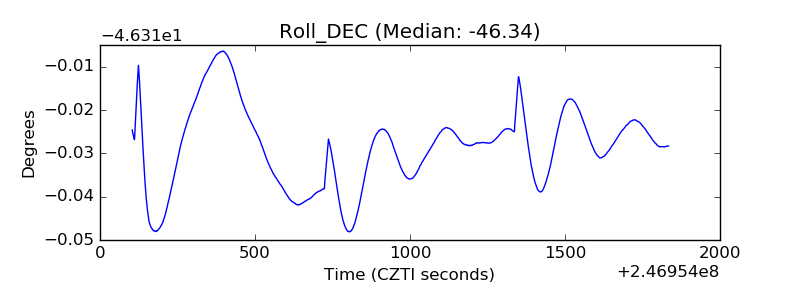 |
| _Roll_RA | 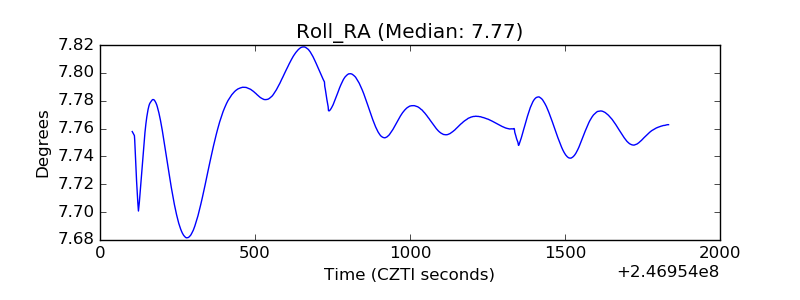 |
| Veto Counter | 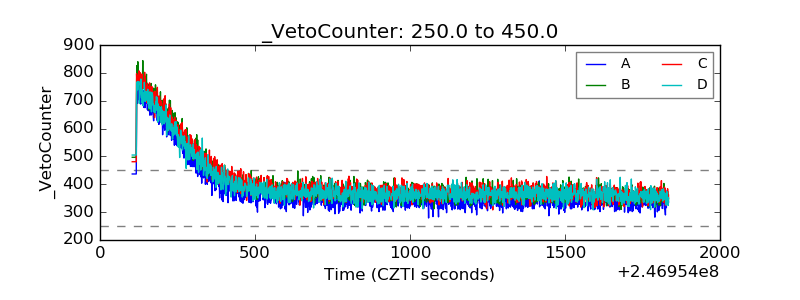 |