| Param | Original file | Final file |
|---|---|---|
| Filename | modeM0/AS1A04_080T03_9000001650_11281cztM0_level2.evt | modeM0/AS1A04_080T03_9000001650_11281cztM0_level2_quad_clean.evt |
| Size (bytes) | 634,613,760 | 70,084,800 |
| Size | 605.2 MB | 66.8 MB |
| Events in quadrant A | 8,143,778 | 370,847 |
| Events in quadrant B | 4,071,709 | 443,899 |
| Events in quadrant C | 2,560,543 | 460,149 |
| Events in quadrant D | 4,045,426 | 435,525 |
| Mode M0 | |||
|---|---|---|---|
| Quadrant | BADHDUFLAG | Total packets | Discarded packets |
| A | 0 | 28206 | 1 |
| B | 0 | 16020 | 1 |
| C | 0 | 11978 | 1 |
| D | 0 | 15825 | 1 |
| Mode SS | |||
|---|---|---|---|
| Quadrant | BADHDUFLAG | Total packets | Discarded packets |
| A | 0 | 118 | 0 |
| B | 0 | 118 | 0 |
| C | 0 | 118 | 0 |
| D | 0 | 118 | 0 |
| Quadrant | Total seconds | Saturated seconds | Saturation percentage |
|---|---|---|---|
| A | 5876 | 1953 | 33.236896% |
| B | 5876 | 430 | 7.317903% |
| C | 5876 | 26 | 0.442478% |
| D | 5876 | 186 | 3.165419% |
Noise dominated data is calculated using 1-second bins in cleaned event files. If a bin has >2000 counts, and if more than 50% of those come from <1% of pixels, then it is considered to be noise-dominated and hence unusable.
| Quadrant | # 1 sec bins | Bins with >0 counts | Bins with >2000 counts | High rate bins dominated by noise | Noise dominated (total time) | Noise dominated (detector-on time) | Marked lightcurve |
|---|---|---|---|---|---|---|---|
| A | 5876 | 5876 | 1485 | 1485 | 25.27% | 25.27% | 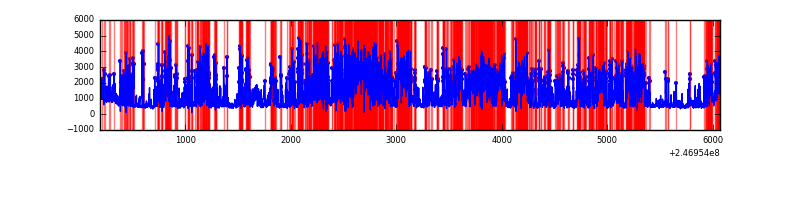 |
| B | 5876 | 5876 | 248 | 248 | 4.22% | 4.22% | 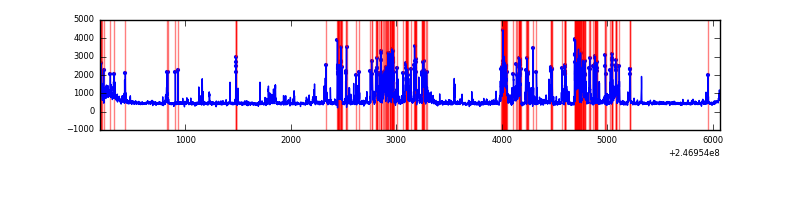 |
| C | 5876 | 5876 | 0 | 0 | 0.00% | 0.00% | 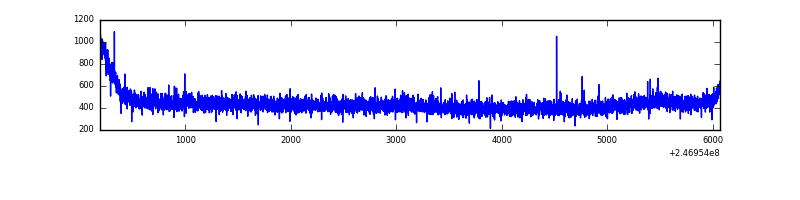 |
| D | 5876 | 5876 | 123 | 123 | 2.09% | 2.09% | 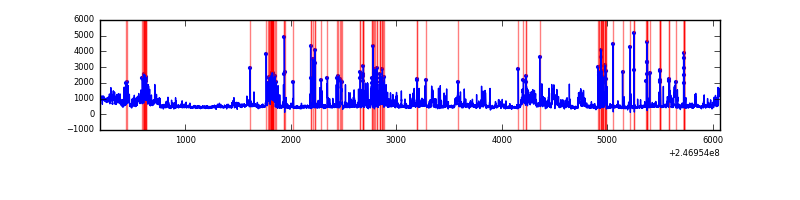 |
Top three noisy pixels from each quadrant. If the there are fewer than three noisy pixels in the level2.evt file, extra rows are filled as -1
| Pixel properties | Quadrant properties | ||||||
|---|---|---|---|---|---|---|---|
| Quadrant | DetID | PixID | Counts | Sigma | Mean | Median | Sigma |
| A | 8 | 5 | 5601543 | 46851.24 | 577 | 564 | 119.5 |
| A | 14 | 238 | 186790 | 1557.75 | 577 | 564 | 119.5 |
| A | 1 | 162 | 33507 | 275.56 | 577 | 564 | 119.5 |
| B | 4 | 239 | 1016716 | 8075.57 | 657 | 641 | 125.8 |
| B | 3 | 64 | 357253 | 2834.28 | 657 | 641 | 125.8 |
| B | 11 | 51 | 73314 | 577.59 | 657 | 641 | 125.8 |
| C | 13 | 61 | 4823 | 27.24 | 655 | 657 | 152.9 |
| C | 9 | 204 | 3265 | 17.05 | 655 | 657 | 152.9 |
| C | 14 | 234 | 2447 | 11.7 | 655 | 657 | 152.9 |
| D | 13 | 152 | 562291 | 3581.95 | 642 | 622 | 156.8 |
| D | 7 | 80 | 238595 | 1517.63 | 642 | 622 | 156.8 |
| D | 1 | 52 | 210252 | 1336.88 | 642 | 622 | 156.8 |
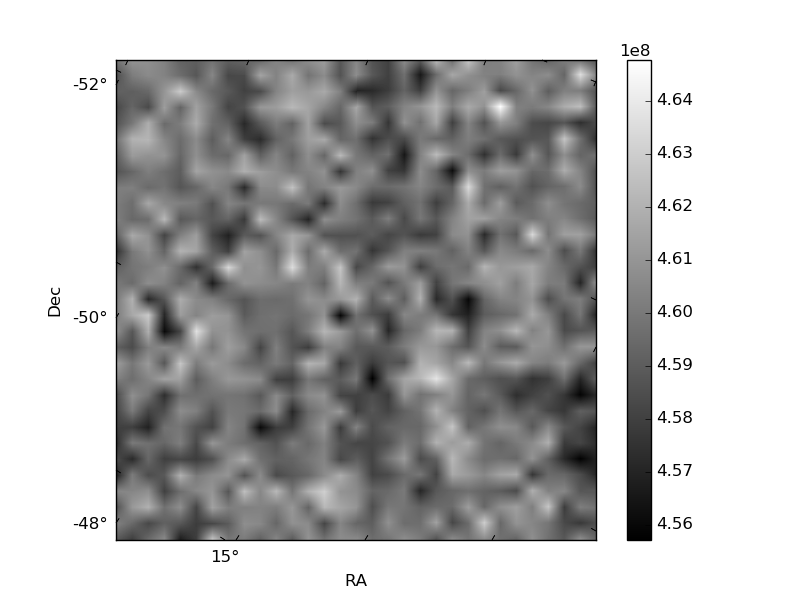
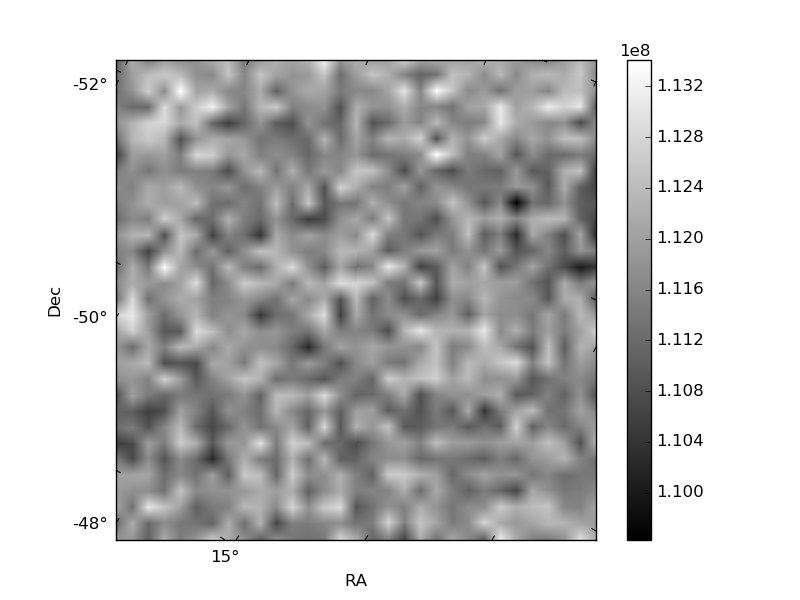
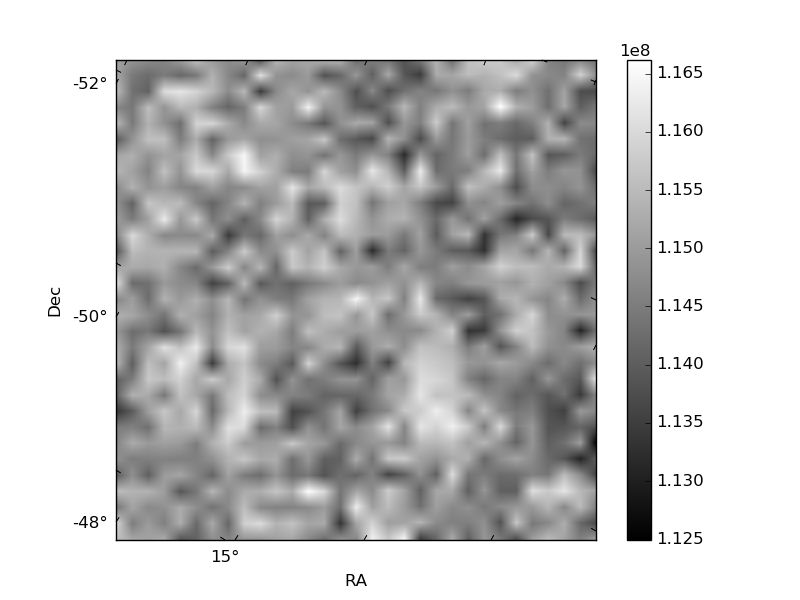
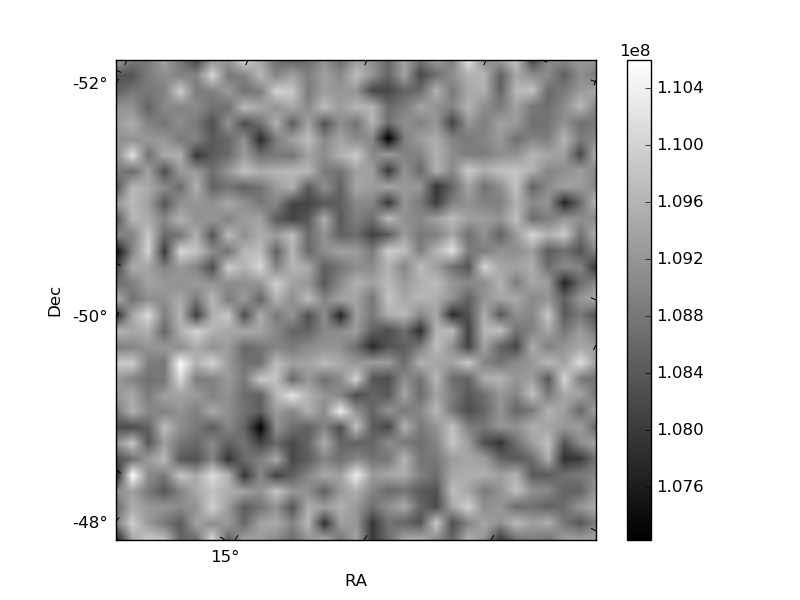
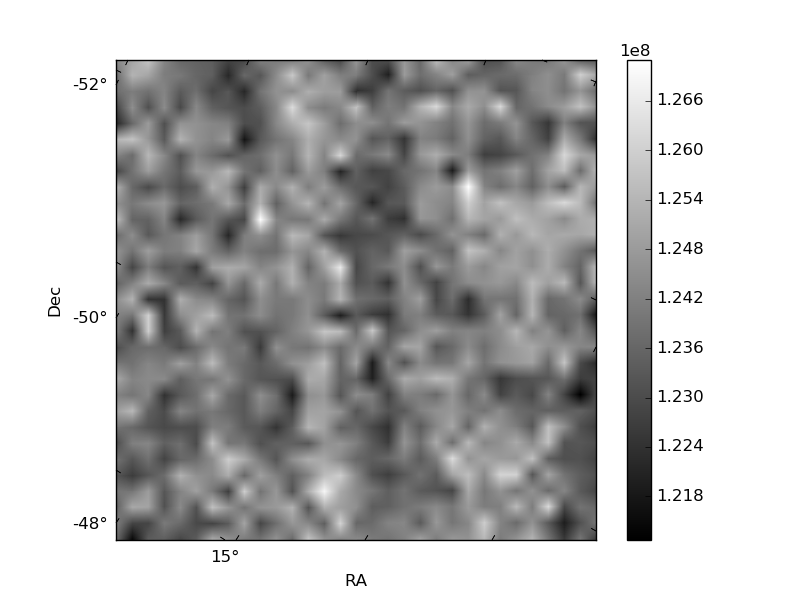
Histogram calculated using DETX and DETY for each event in the final _common_clean file
| Quadrant A | 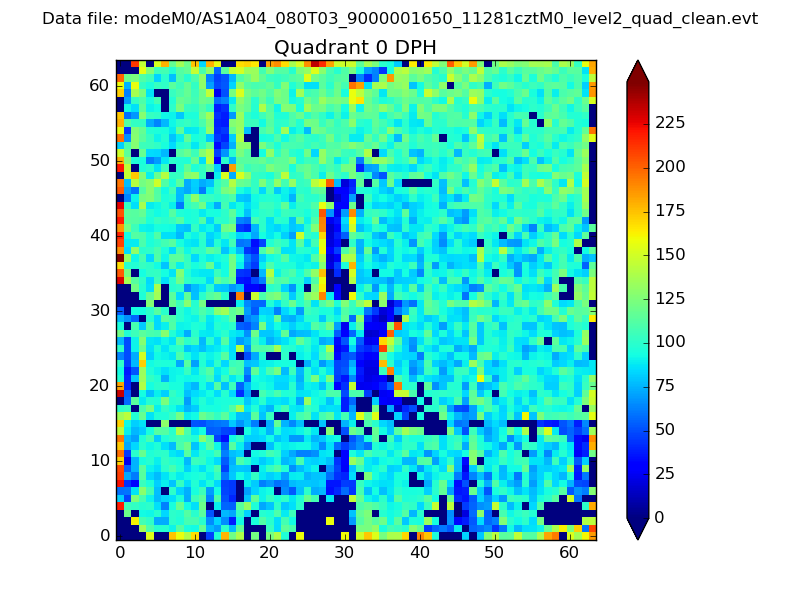 |
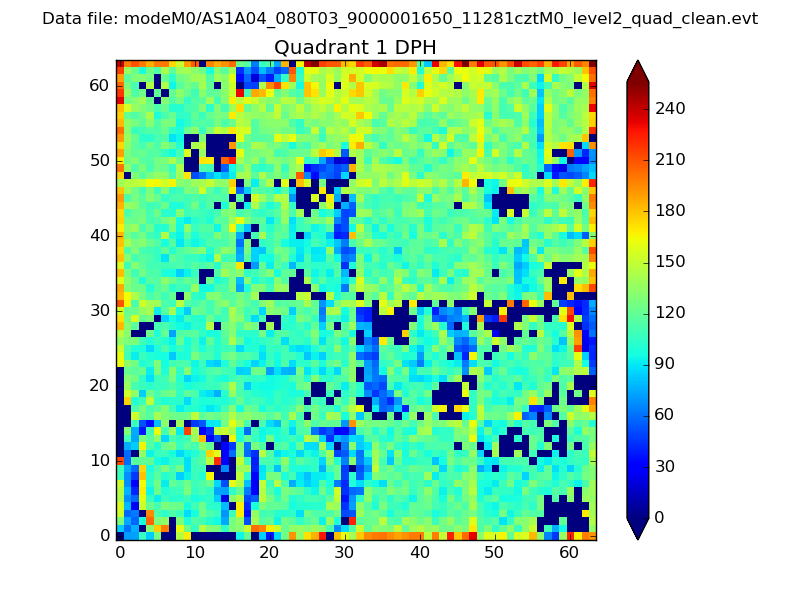 |
Quadrant B |
|---|---|---|---|
| Quadrant D | 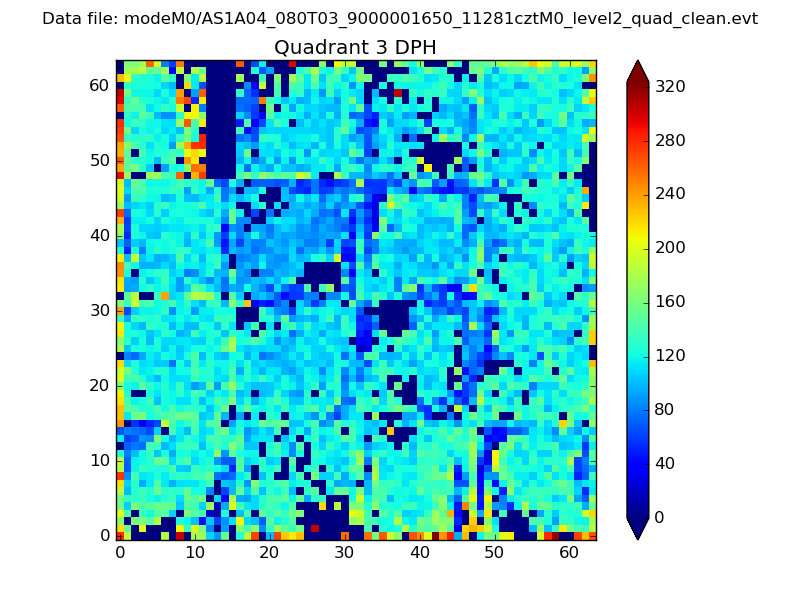 |
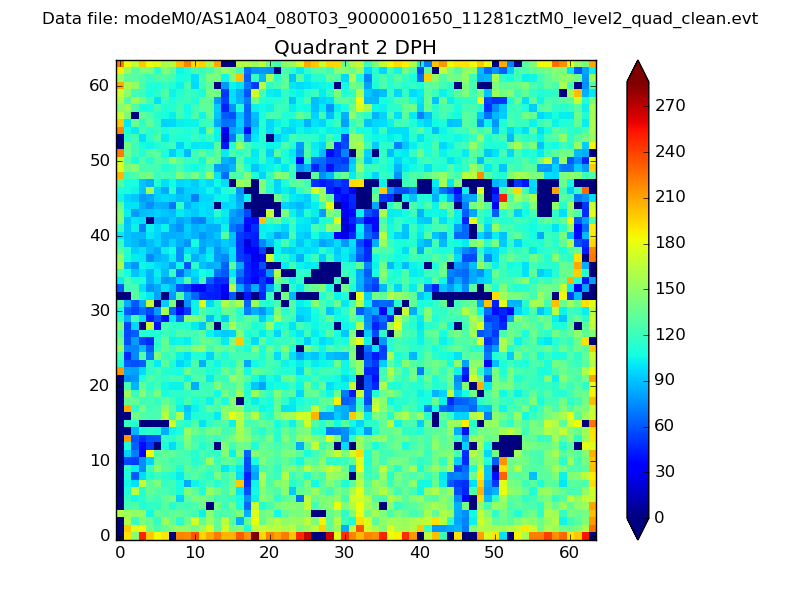 |
Quadrant C |
| Plot type | Count rate plots | Images |
|---|---|---|
| Comparison with Poisson distribution Blue bars denote a histogram of data divided into 1 sec bins. Red curve is a Poisson curve with rate = median count rate of data. |
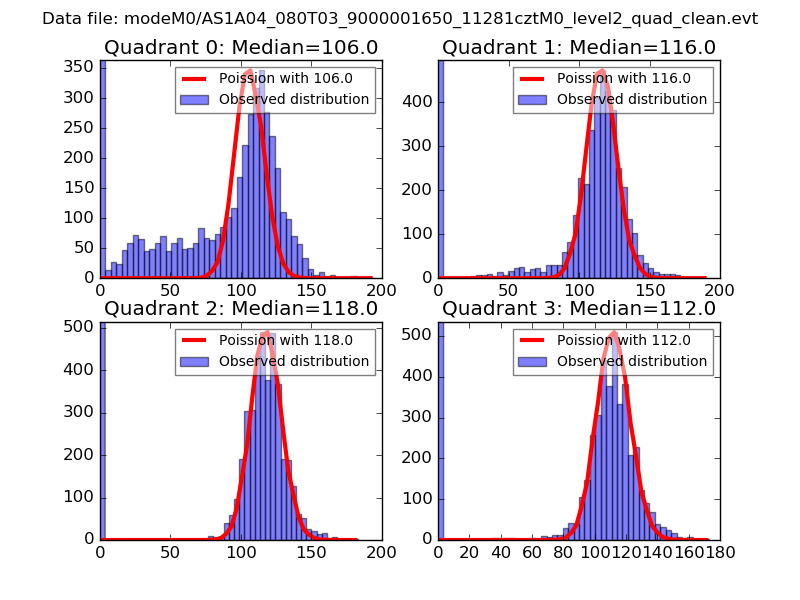 |
 |
| Quadrant-wise count rates Data is divided into 100 sec bins |
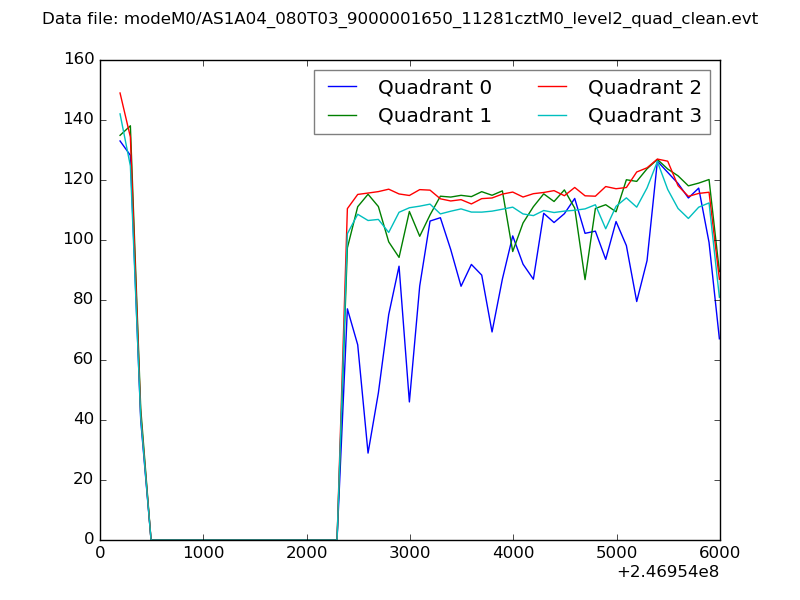 |
|
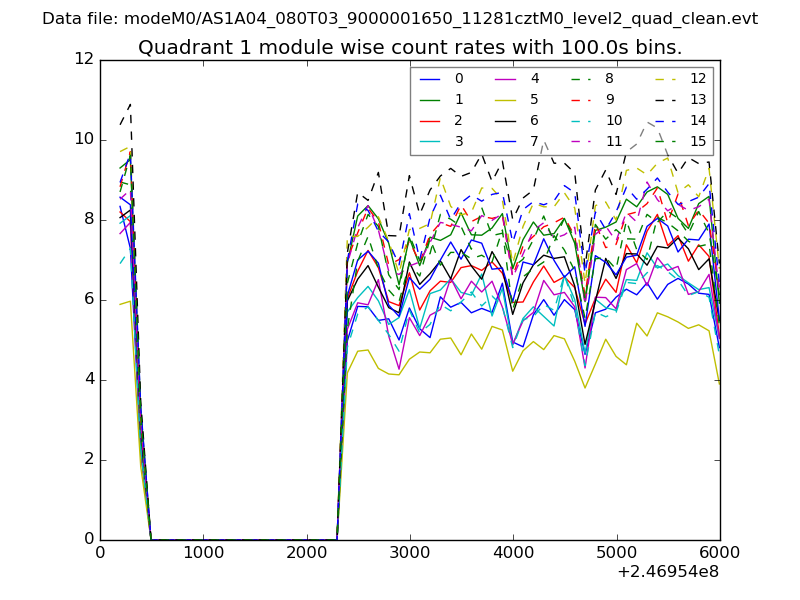
| Module-wise count rates for Quadrant A Data is divided into 100 sec bins |
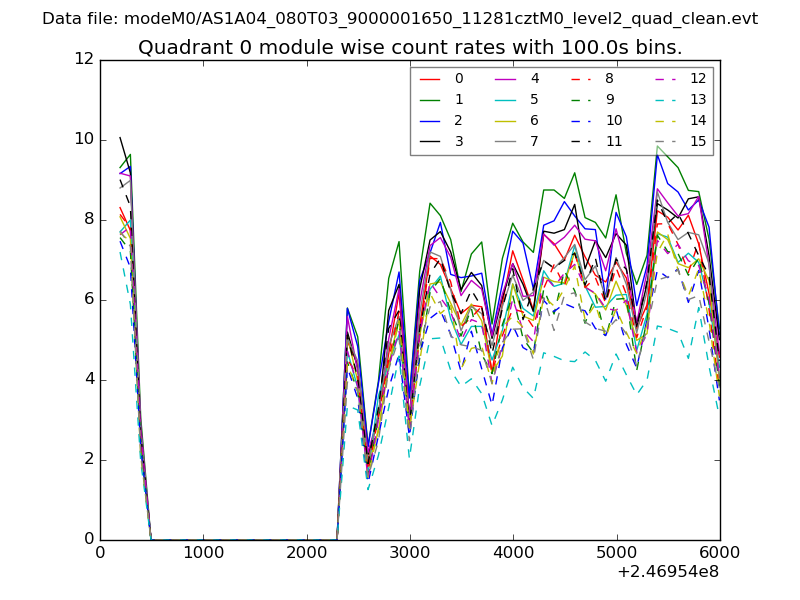 |
 |
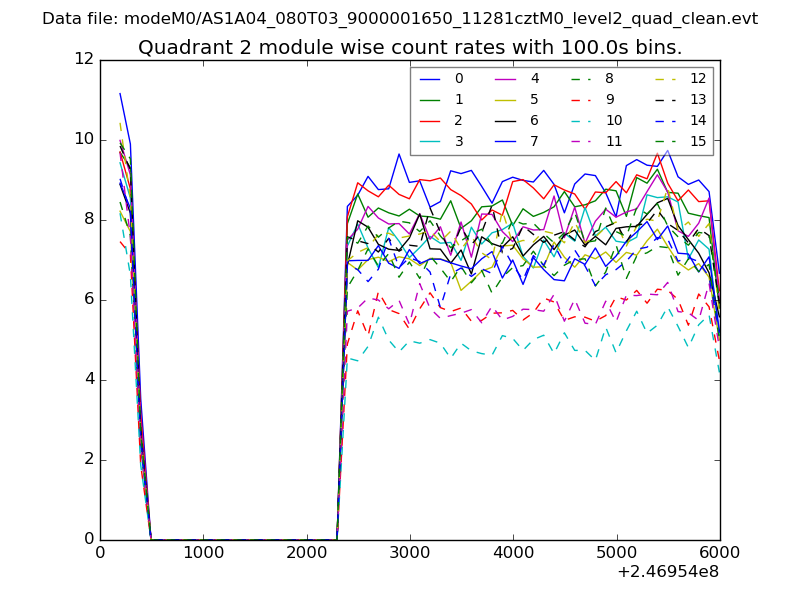
| Module-wise count rates for Quadrant B Data is divided into 100 sec bins |
 |
 |
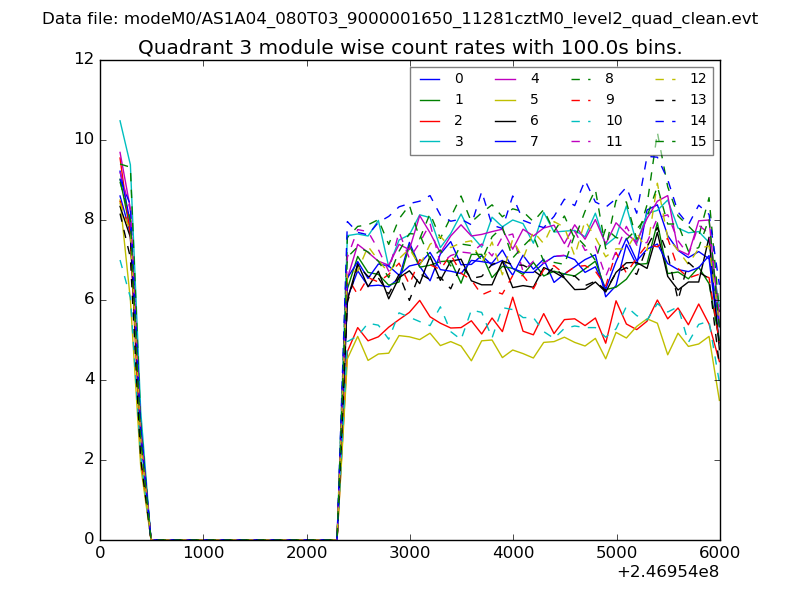
| Module-wise count rates for Quadrant C Data is divided into 100 sec bins |
 |
 |
| Module-wise count rates for Quadrant D Data is divided into 100 sec bins |
 |
 |
| Parameter | Plot |
|---|---|
| CZT HV Monitor | 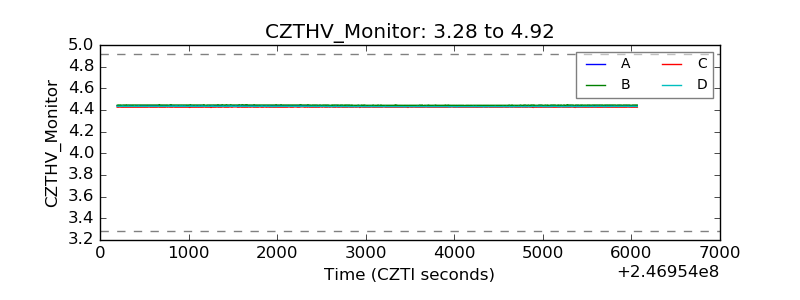 |
| D_VDD | 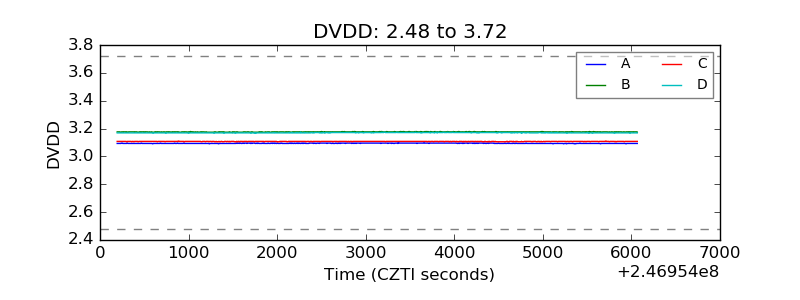 |
| Temperature 1 | 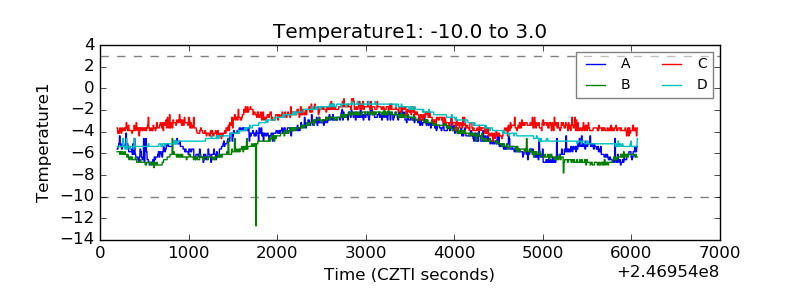 |
| Veto HV Monitor | 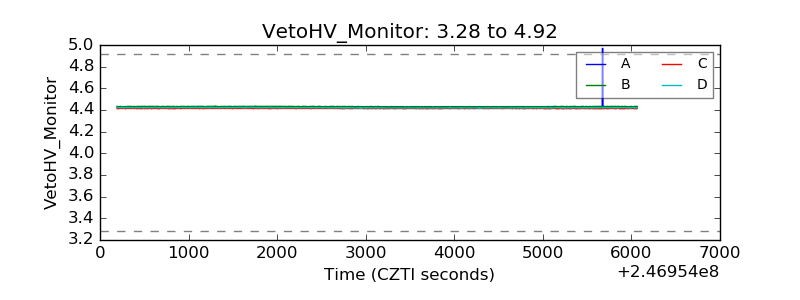 |
| Veto LLD |  |
| Alpha Counter | 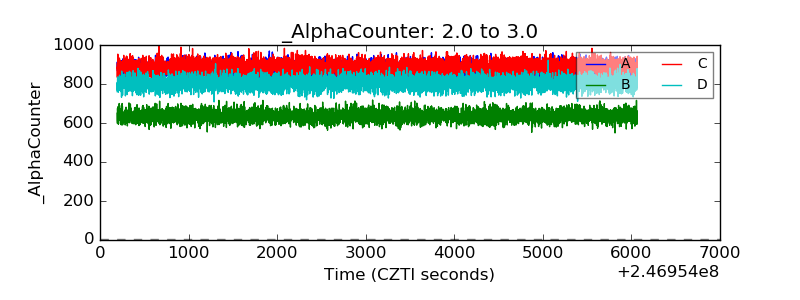 |
| _CPM_Rate | 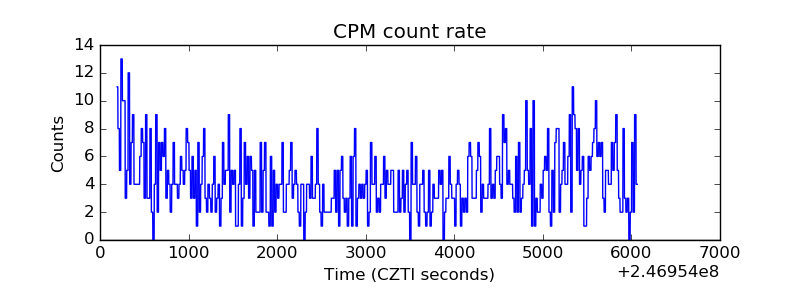 |
| CZT Counter | 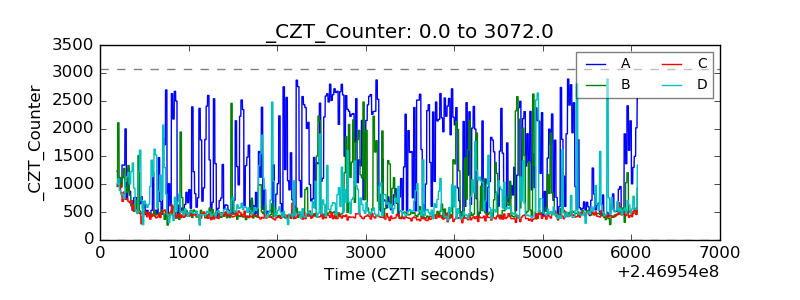 |
| +2.5 Volts monitor |  |
| +5 Volts monitor |  |
| _ROLL_ROT | 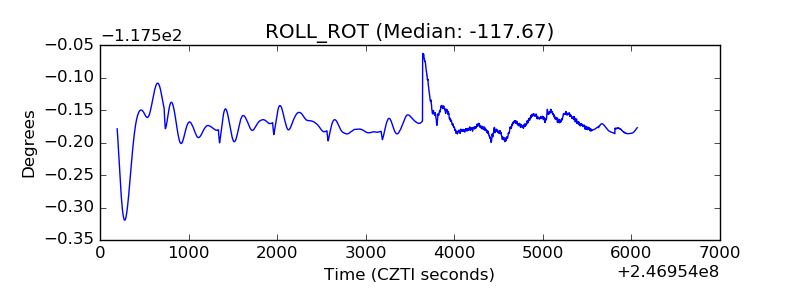 |
| _Roll_DEC | 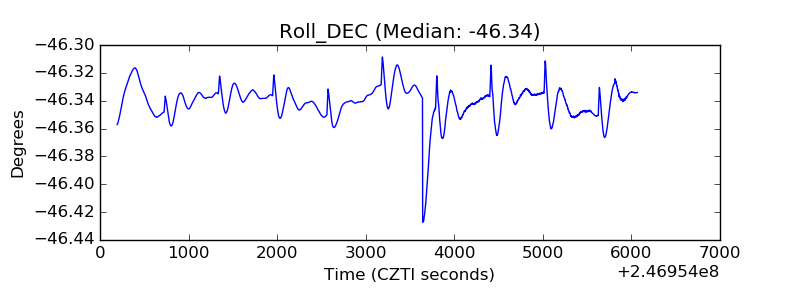 |
| _Roll_RA | 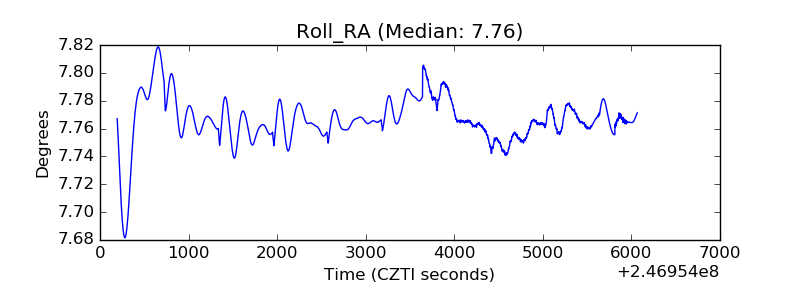 |
| Veto Counter | 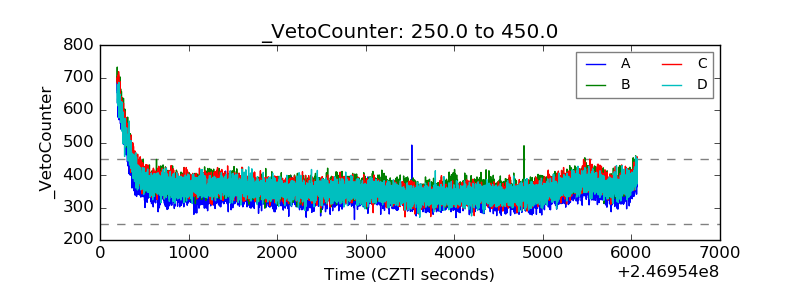 |