| Param | Original file | Final file |
|---|---|---|
| Filename | modeM0/AS1A04_144T01_9000001652_11284cztM0_level2.evt | modeM0/AS1A04_144T01_9000001652_11284cztM0_level2_quad_clean.evt |
| Size (bytes) | 640,517,760 | 75,625,920 |
| Size | 610.8 MB | 72.1 MB |
| Events in quadrant A | 5,581,709 | 453,606 |
| Events in quadrant B | 4,881,733 | 465,665 |
| Events in quadrant C | 3,258,502 | 459,027 |
| Events in quadrant D | 5,196,811 | 418,143 |
| Mode SS | |||
|---|---|---|---|
| Quadrant | BADHDUFLAG | Total packets | Discarded packets |
| A | 0 | 144 | 0 |
| B | 0 | 144 | 0 |
| C | 0 | 144 | 0 |
| D | 0 | 144 | 0 |
| Mode M0 | |||
|---|---|---|---|
| Quadrant | BADHDUFLAG | Total packets | Discarded packets |
| A | 0 | 21379 | 3 |
| B | 0 | 19128 | 2 |
| C | 0 | 14500 | 2 |
| D | 0 | 20204 | 2 |
| Mode M9 | |||
|---|---|---|---|
| Quadrant | BADHDUFLAG | Total packets | Discarded packets |
| A | 0 | 17 | 0 |
| B | 0 | 17 | 0 |
| C | 0 | 17 | 0 |
| D | 0 | 17 | 0 |
| Quadrant | Total seconds | Saturated seconds | Saturation percentage |
|---|---|---|---|
| A | 7086 | 525 | 7.408975% |
| B | 7086 | 549 | 7.747671% |
| C | 7086 | 76 | 1.072537% |
| D | 7086 | 438 | 6.181202% |
Noise dominated data is calculated using 1-second bins in cleaned event files. If a bin has >2000 counts, and if more than 50% of those come from <1% of pixels, then it is considered to be noise-dominated and hence unusable.
| Quadrant | # 1 sec bins | Bins with >0 counts | Bins with >2000 counts | High rate bins dominated by noise | Noise dominated (total time) | Noise dominated (detector-on time) | Marked lightcurve |
|---|---|---|---|---|---|---|---|
| A | 8777 | 7088 | 293 | 293 | 3.34% | 4.13% | 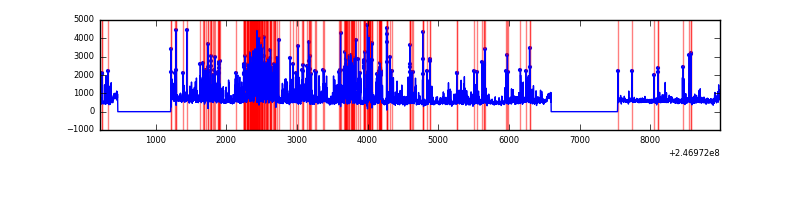 |
| B | 8777 | 7088 | 253 | 253 | 2.88% | 3.57% | 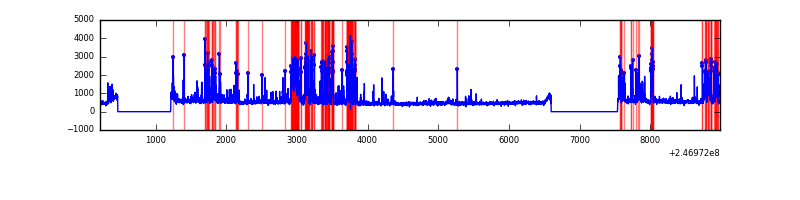 |
| C | 8777 | 7088 | 5 | 5 | 0.06% | 0.07% | 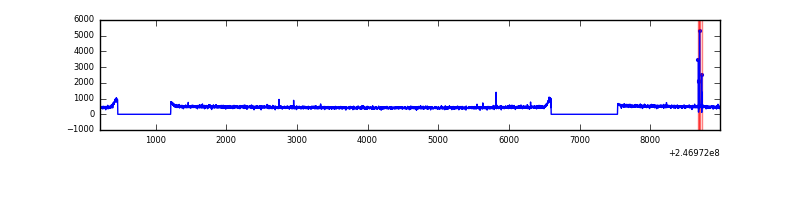 |
| D | 8777 | 7088 | 260 | 260 | 2.96% | 3.67% | 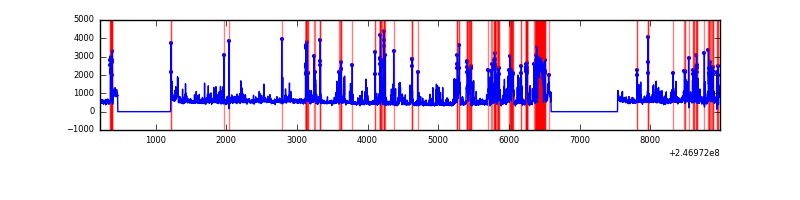 |
Top three noisy pixels from each quadrant. If the there are fewer than three noisy pixels in the level2.evt file, extra rows are filled as -1
| Pixel properties | Quadrant properties | ||||||
|---|---|---|---|---|---|---|---|
| Quadrant | DetID | PixID | Counts | Sigma | Mean | Median | Sigma |
| A | 8 | 5 | 1982058 | 11472.07 | 842 | 824 | 172.7 |
| A | 8 | 15 | 75458 | 432.16 | 842 | 824 | 172.7 |
| A | 1 | 162 | 64185 | 366.88 | 842 | 824 | 172.7 |
| B | 4 | 239 | 1375162 | 8398.33 | 847 | 827 | 163.6 |
| B | 11 | 51 | 73130 | 441.83 | 847 | 827 | 163.6 |
| B | 15 | 204 | 38324 | 229.14 | 847 | 827 | 163.6 |
| C | 14 | 234 | 22937 | 114.03 | 830 | 833 | 193.8 |
| C | 13 | 61 | 6008 | 26.7 | 830 | 833 | 193.8 |
| C | 3 | 202 | 2100 | 6.54 | 830 | 833 | 193.8 |
| D | 1 | 52 | 1124024 | 5689.08 | 811 | 784 | 197.4 |
| D | 8 | 195 | 253023 | 1277.56 | 811 | 784 | 197.4 |
| D | 7 | 80 | 223076 | 1125.88 | 811 | 784 | 197.4 |
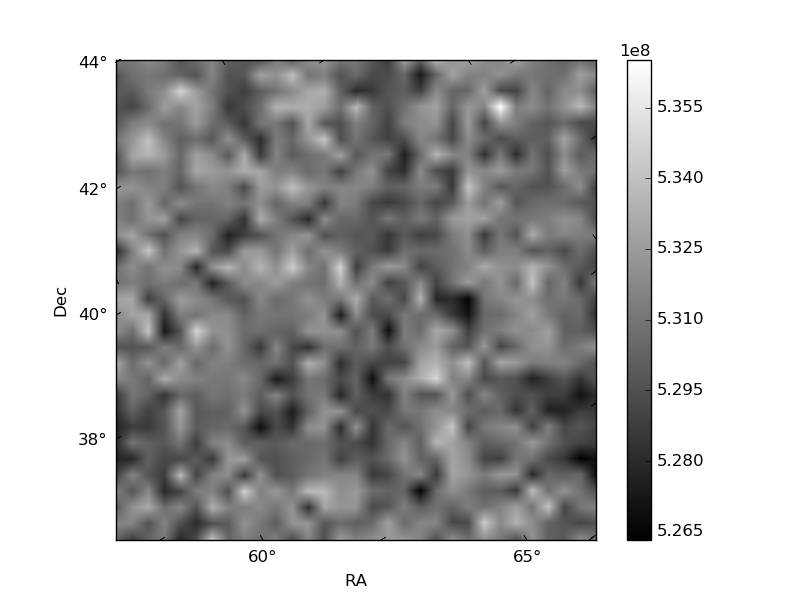
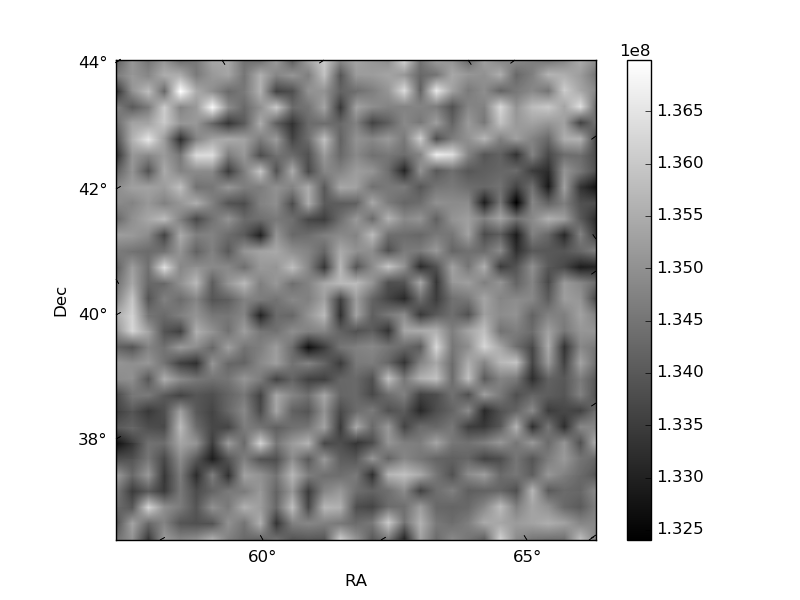
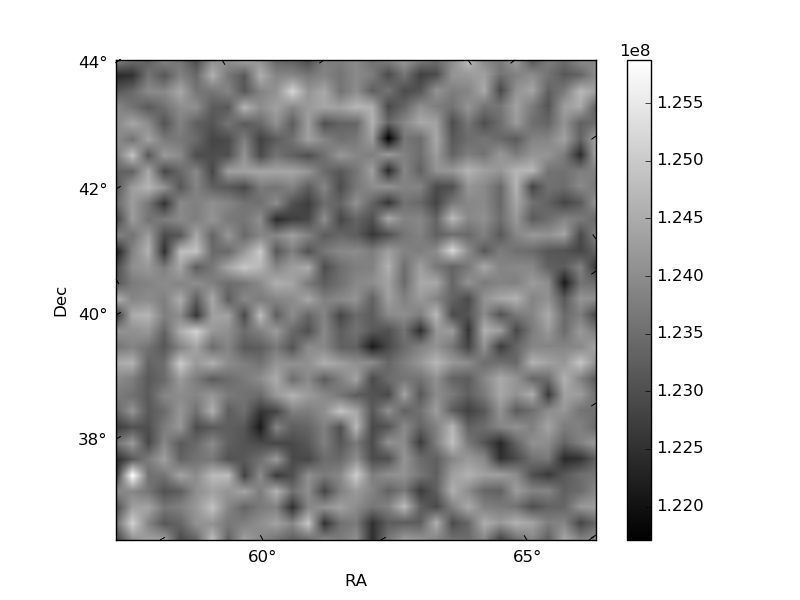
Histogram calculated using DETX and DETY for each event in the final _common_clean file
| Quadrant A | 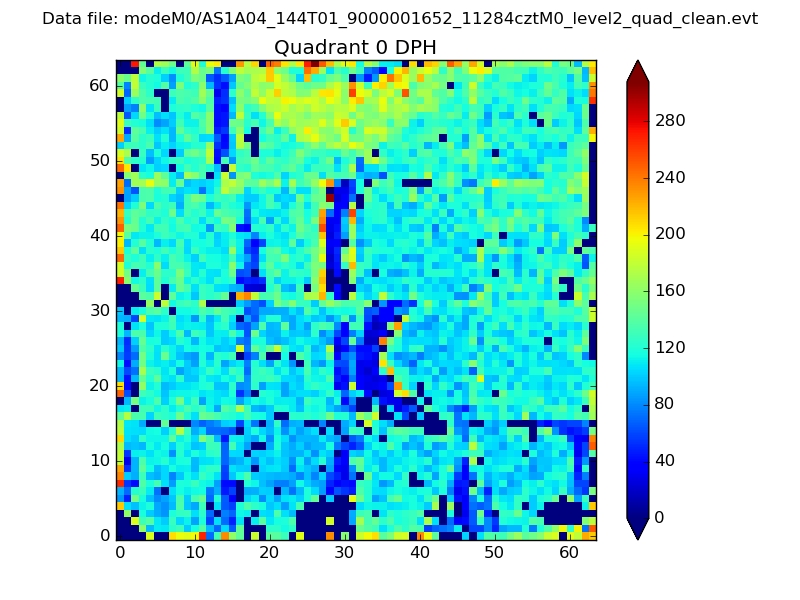 |
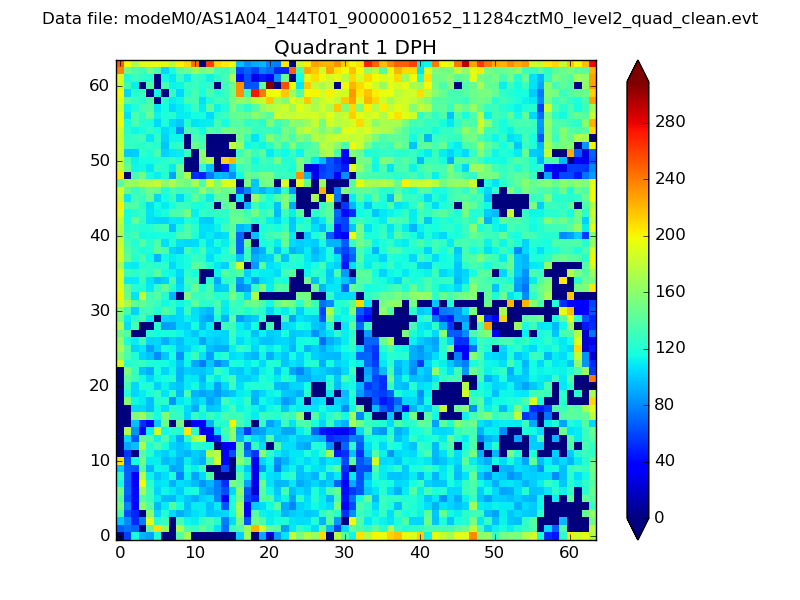 |
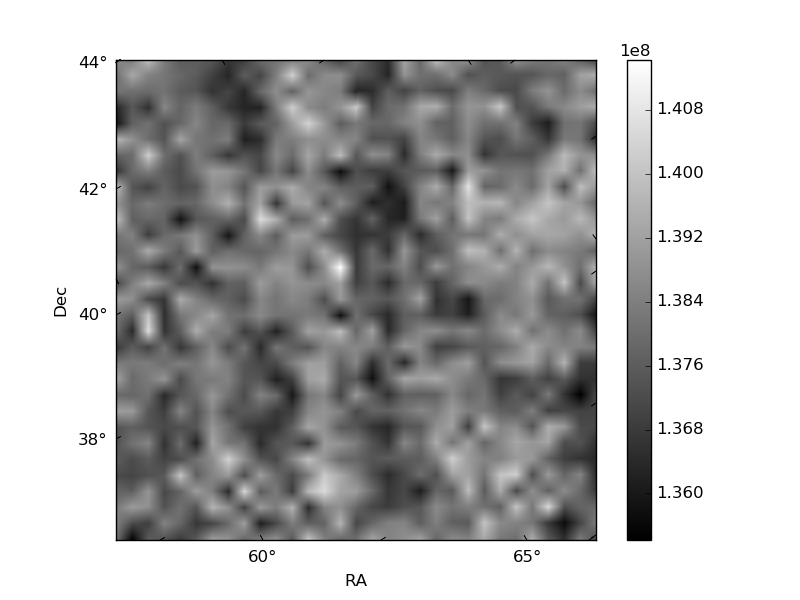
Quadrant B |
|---|---|---|---|
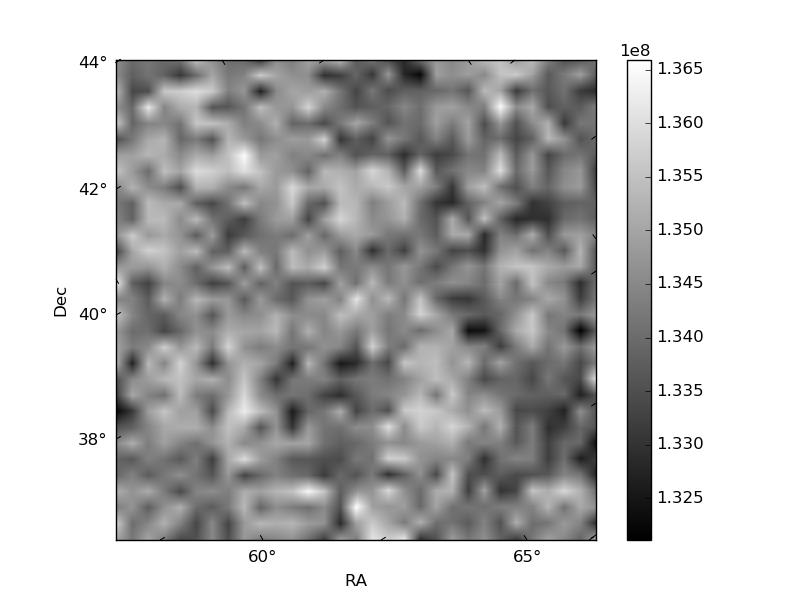
| Quadrant D | 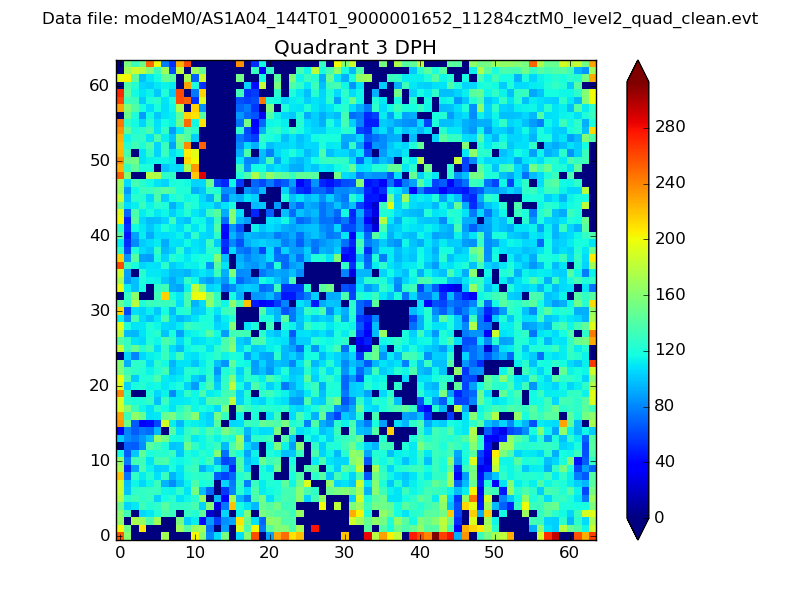 |
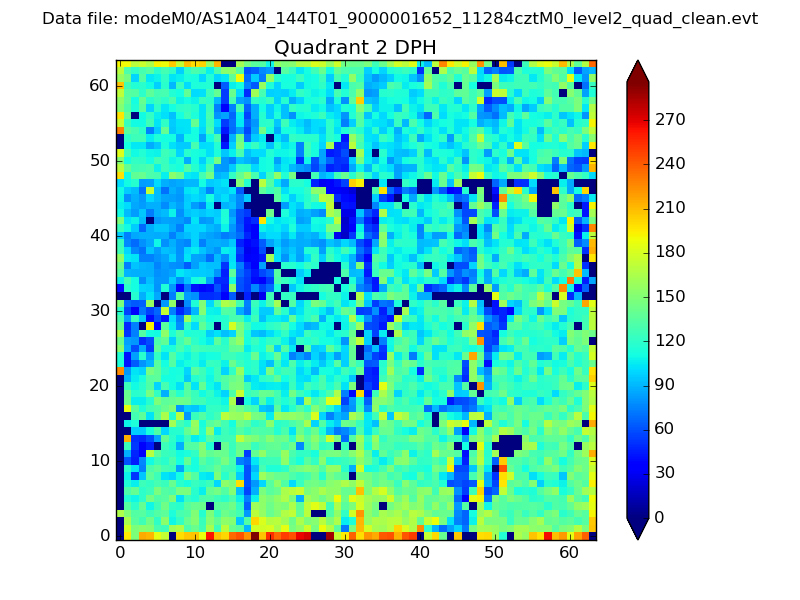 |
Quadrant C |
| Plot type | Count rate plots | Images |
|---|---|---|
| Comparison with Poisson distribution Blue bars denote a histogram of data divided into 1 sec bins. Red curve is a Poisson curve with rate = median count rate of data. |
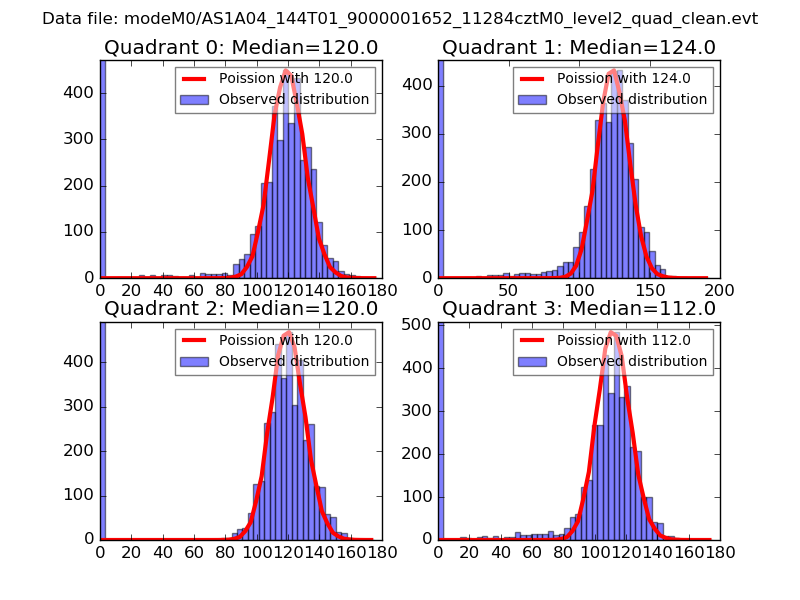 |
 |
| Quadrant-wise count rates Data is divided into 100 sec bins |
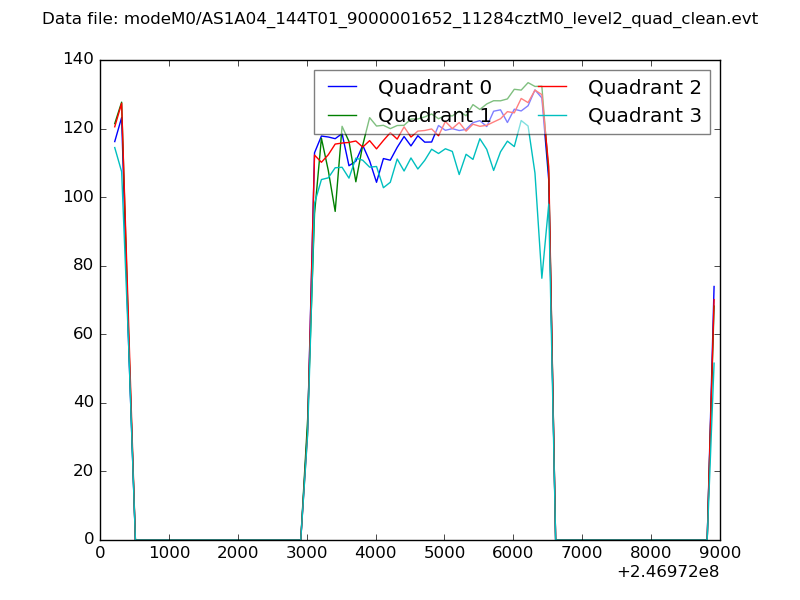 |
|
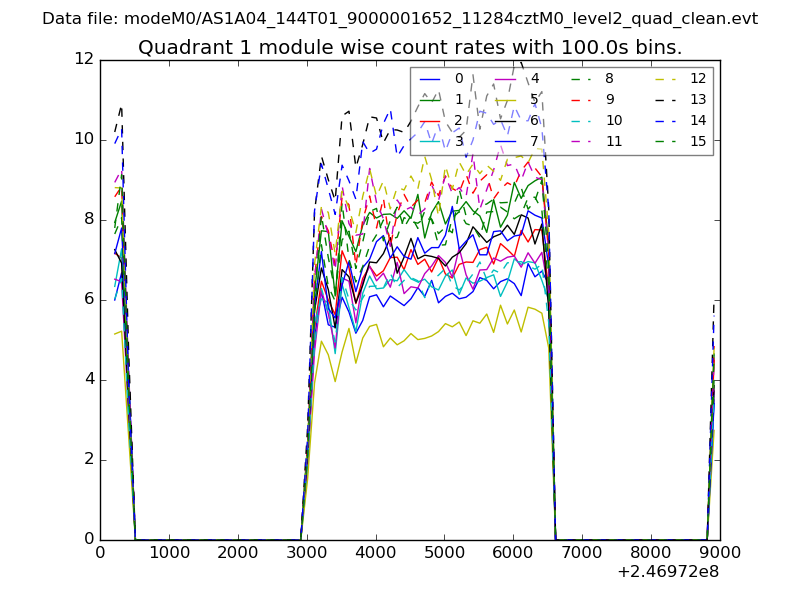
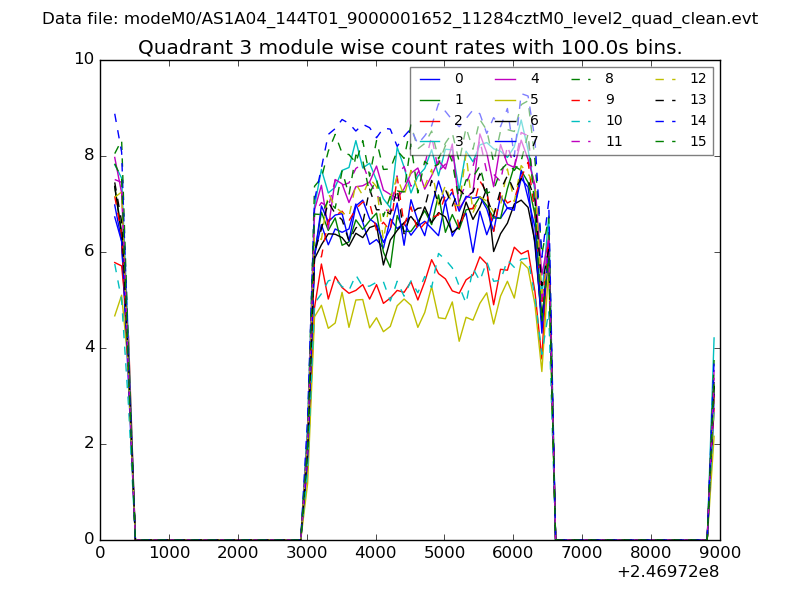
| Module-wise count rates for Quadrant A Data is divided into 100 sec bins |
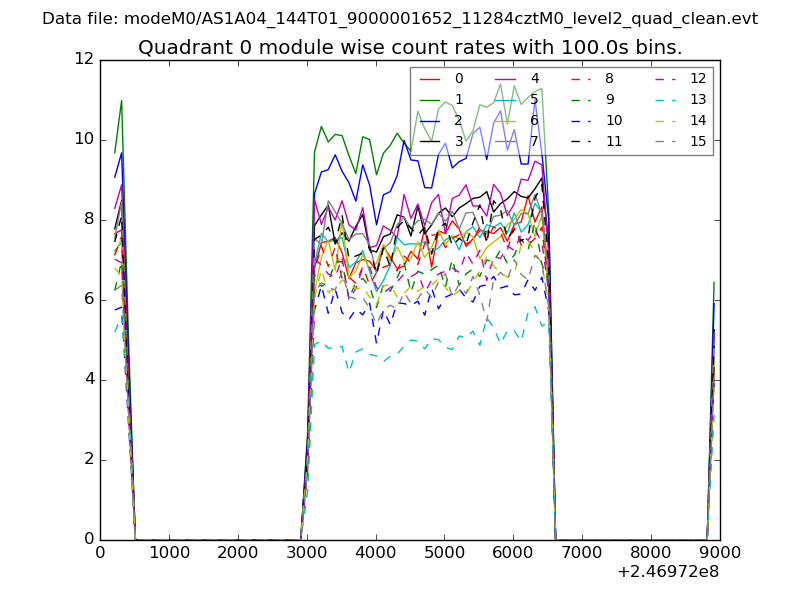 |
 |
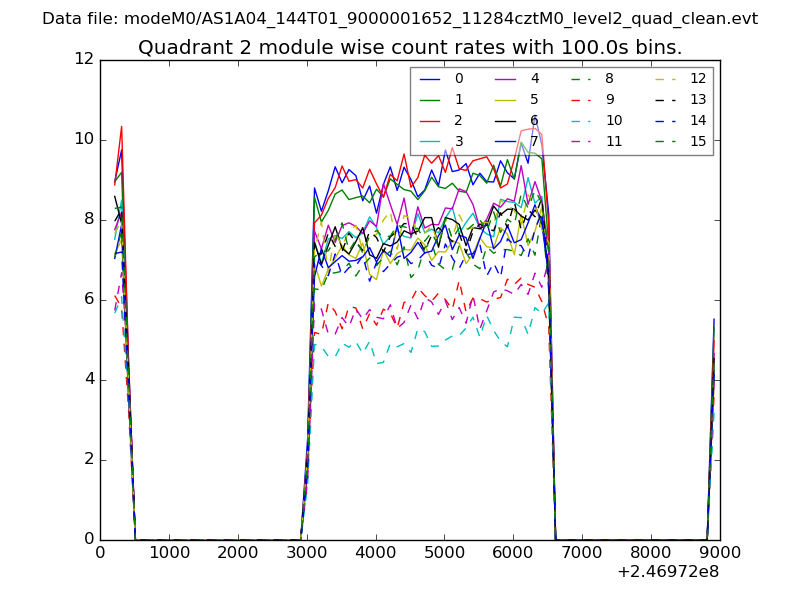
| Module-wise count rates for Quadrant B Data is divided into 100 sec bins |
 |
 |
| Module-wise count rates for Quadrant C Data is divided into 100 sec bins |
 |
 |
| Module-wise count rates for Quadrant D Data is divided into 100 sec bins |
 |
 |
| Parameter | Plot |
|---|---|
| CZT HV Monitor | 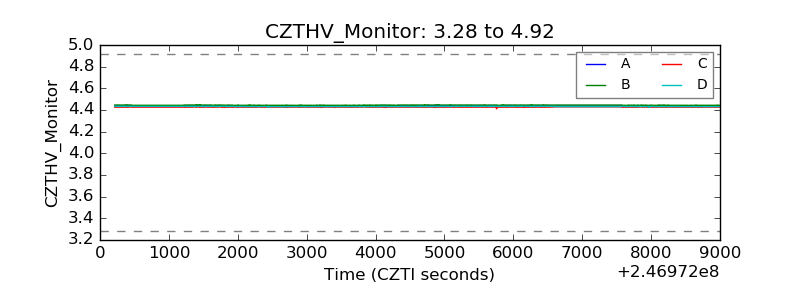 |
| D_VDD | 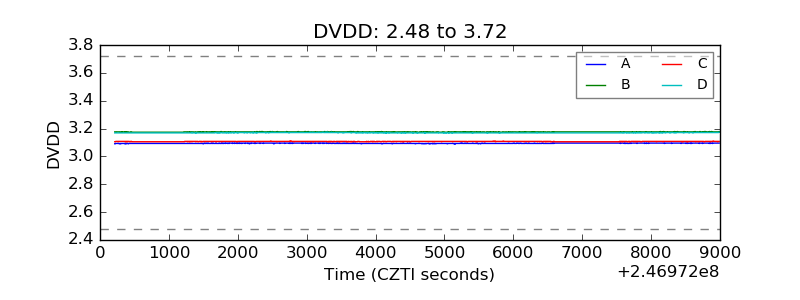 |
| Temperature 1 | 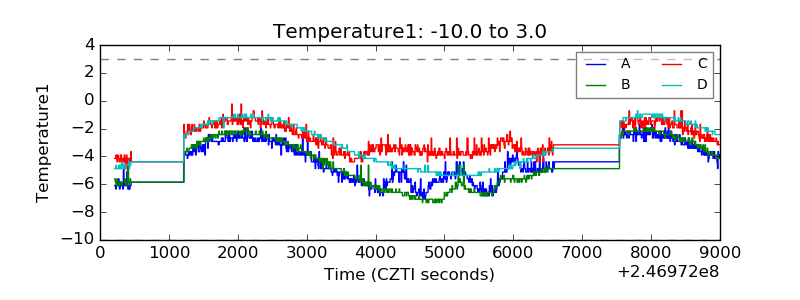 |
| Veto HV Monitor | 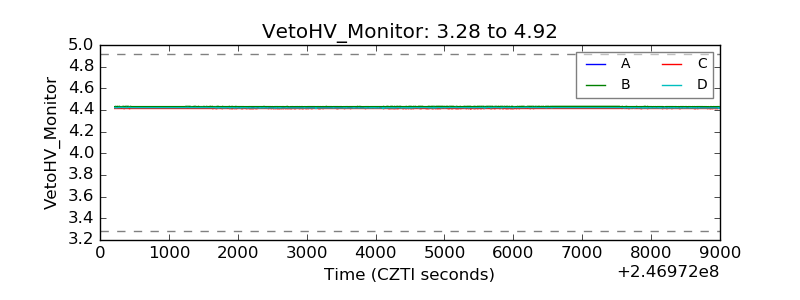 |
| Veto LLD | 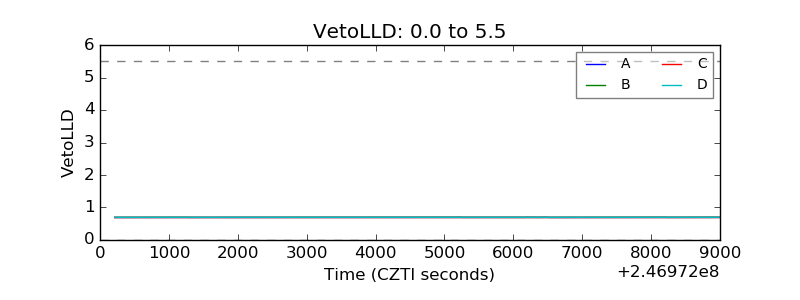 |
| Alpha Counter | 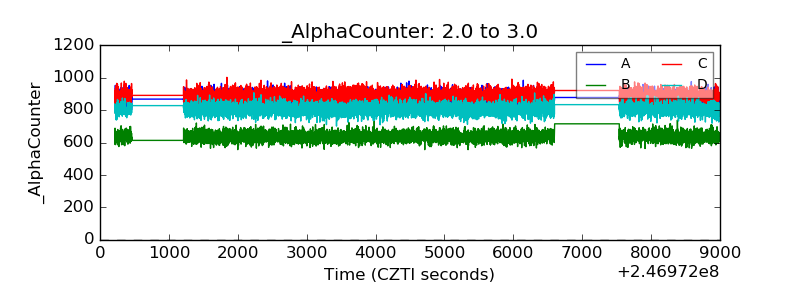 |
| _CPM_Rate | 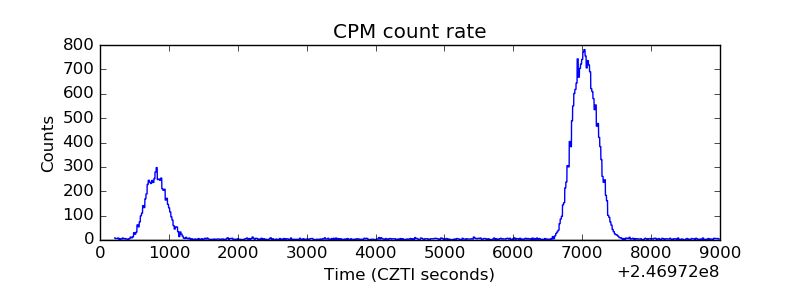 |
| CZT Counter | 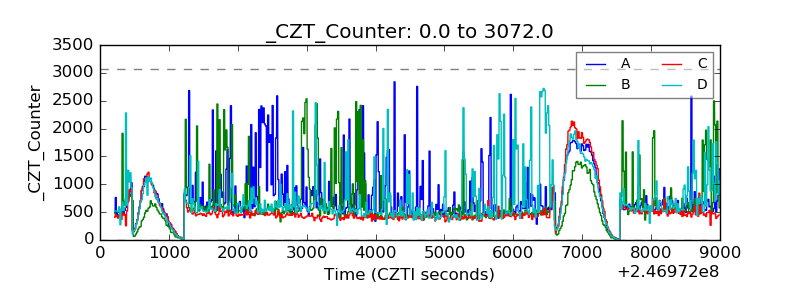 |
| +2.5 Volts monitor |  |
| +5 Volts monitor |  |
| _ROLL_ROT | 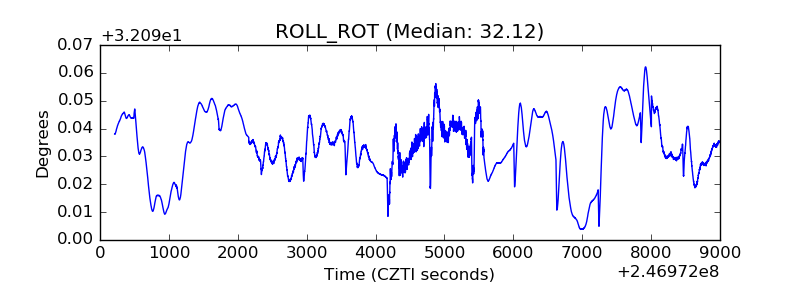 |
| _Roll_DEC | 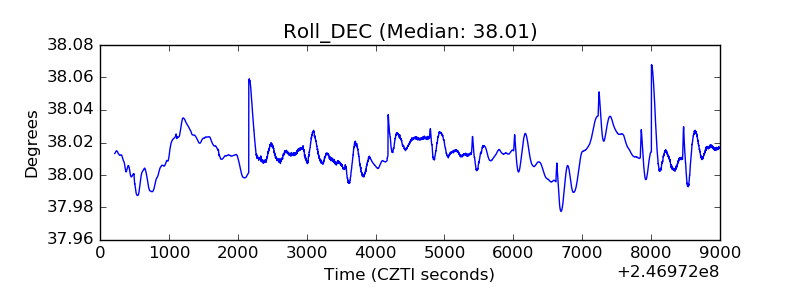 |
| _Roll_RA | 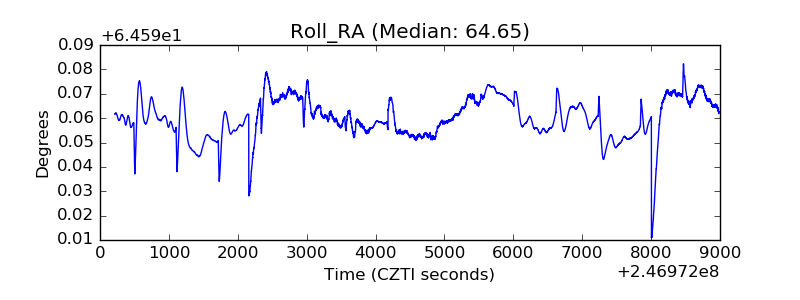 |
| Veto Counter | 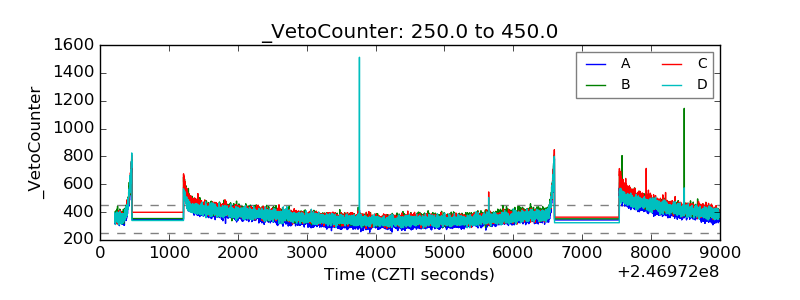 |