| Param | Original file | Final file |
|---|---|---|
| Filename | modeM0/AS1A04_144T01_9000001652_11288cztM0_level2.evt | modeM0/AS1A04_144T01_9000001652_11288cztM0_level2_quad_clean.evt |
| Size (bytes) | 659,609,280 | 100,650,240 |
| Size | 629.1 MB | 96.0 MB |
| Events in quadrant A | 6,725,124 | 616,083 |
| Events in quadrant B | 4,343,317 | 685,410 |
| Events in quadrant C | 3,193,495 | 681,672 |
| Events in quadrant D | 5,278,650 | 615,131 |
| Mode SS | |||
|---|---|---|---|
| Quadrant | BADHDUFLAG | Total packets | Discarded packets |
| A | 0 | 132 | 0 |
| B | 0 | 132 | 0 |
| C | 0 | 132 | 0 |
| D | 0 | 132 | 0 |
| Mode M0 | |||
|---|---|---|---|
| Quadrant | BADHDUFLAG | Total packets | Discarded packets |
| A | 0 | 24471 | 3 |
| B | 0 | 17383 | 2 |
| C | 0 | 13792 | 2 |
| D | 0 | 19986 | 2 |
| Mode M9 | |||
|---|---|---|---|
| Quadrant | BADHDUFLAG | Total packets | Discarded packets |
| A | 0 | 24 | 0 |
| B | 0 | 24 | 0 |
| C | 0 | 24 | 0 |
| D | 0 | 24 | 0 |
| Quadrant | Total seconds | Saturated seconds | Saturation percentage |
|---|---|---|---|
| A | 6438 | 1170 | 18.173346% |
| B | 6438 | 440 | 6.834421% |
| C | 6438 | 64 | 0.994098% |
| D | 6438 | 453 | 7.036347% |
Noise dominated data is calculated using 1-second bins in cleaned event files. If a bin has >2000 counts, and if more than 50% of those come from <1% of pixels, then it is considered to be noise-dominated and hence unusable.
| Quadrant | # 1 sec bins | Bins with >0 counts | Bins with >2000 counts | High rate bins dominated by noise | Noise dominated (total time) | Noise dominated (detector-on time) | Marked lightcurve |
|---|---|---|---|---|---|---|---|
| A | 8888 | 6440 | 832 | 832 | 9.36% | 12.92% | 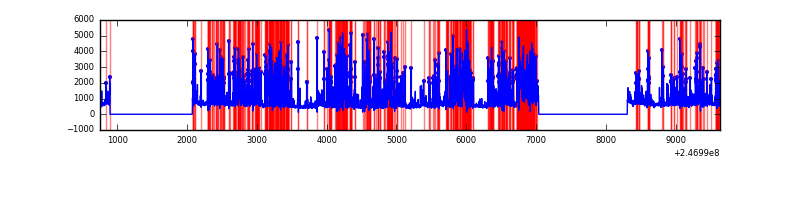 |
| B | 8888 | 6440 | 181 | 181 | 2.04% | 2.81% | 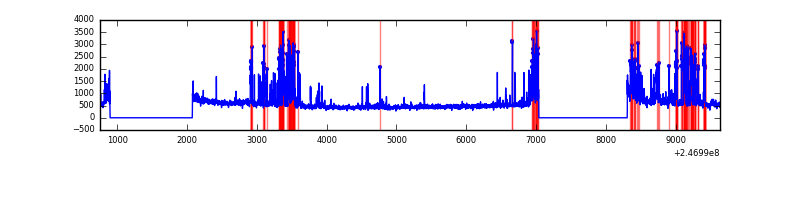 |
| C | 8888 | 6440 | 1 | 1 | 0.01% | 0.02% | 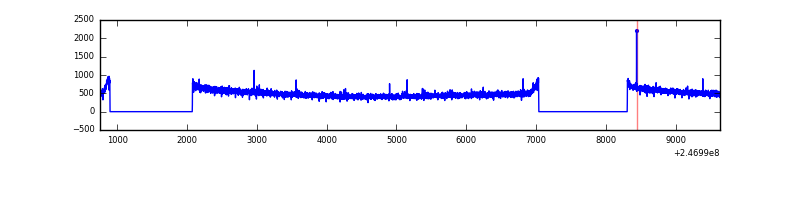 |
| D | 8888 | 6440 | 280 | 280 | 3.15% | 4.35% | 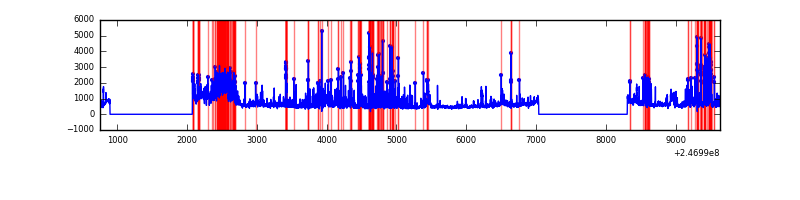 |
Top three noisy pixels from each quadrant. If the there are fewer than three noisy pixels in the level2.evt file, extra rows are filled as -1
| Pixel properties | Quadrant properties | ||||||
|---|---|---|---|---|---|---|---|
| Quadrant | DetID | PixID | Counts | Sigma | Mean | Median | Sigma |
| A | 8 | 5 | 3376141 | 21876.94 | 759 | 743 | 154.3 |
| A | 8 | 15 | 140407 | 905.2 | 759 | 743 | 154.3 |
| A | 1 | 162 | 80528 | 517.11 | 759 | 743 | 154.3 |
| B | 4 | 239 | 1025527 | 6666.14 | 819 | 803 | 153.7 |
| B | 0 | 219 | 52829 | 338.44 | 819 | 803 | 153.7 |
| B | 15 | 204 | 21474 | 134.47 | 819 | 803 | 153.7 |
| C | 13 | 61 | 5925 | 27.06 | 816 | 822 | 188.6 |
| C | 12 | 4 | 5653 | 25.62 | 816 | 822 | 188.6 |
| C | 9 | 54 | 4066 | 17.2 | 816 | 822 | 188.6 |
| D | 12 | 157 | 632068 | 3351.49 | 785 | 765 | 188.4 |
| D | 10 | 253 | 422071 | 2236.65 | 785 | 765 | 188.4 |
| D | 1 | 52 | 407682 | 2160.26 | 785 | 765 | 188.4 |
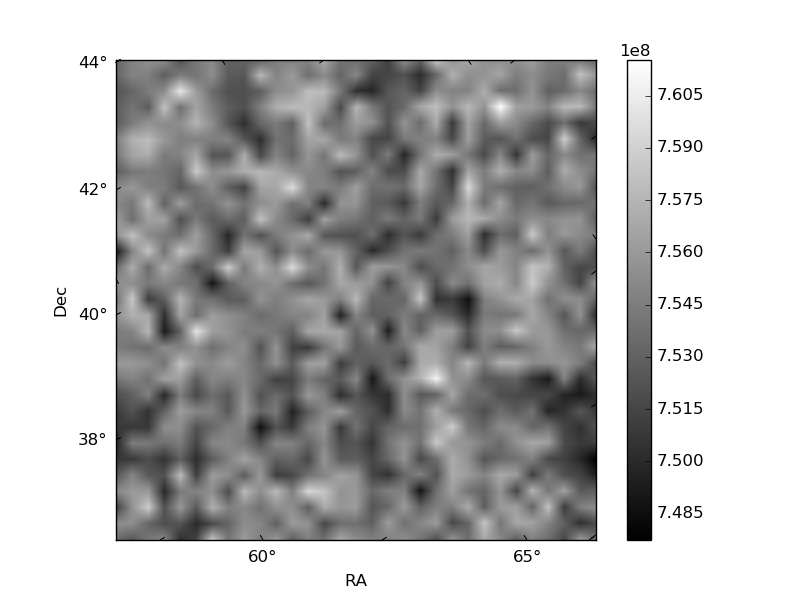
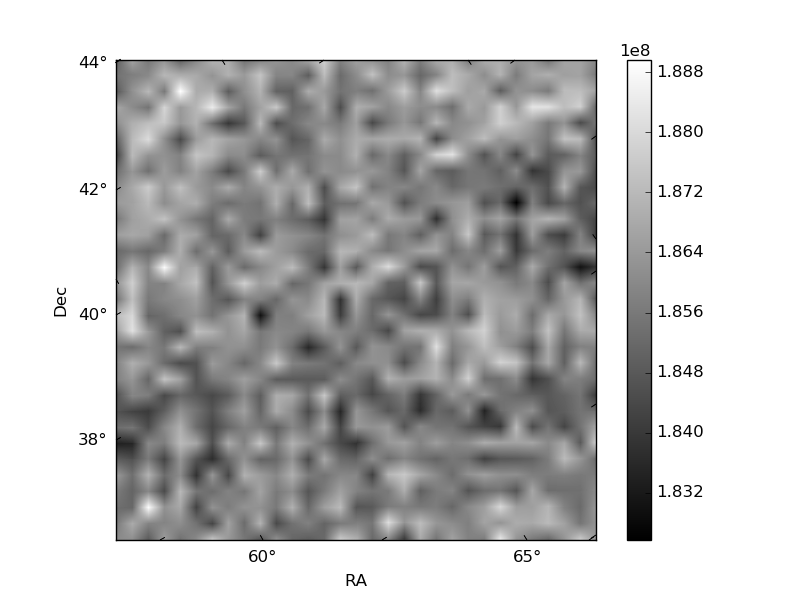
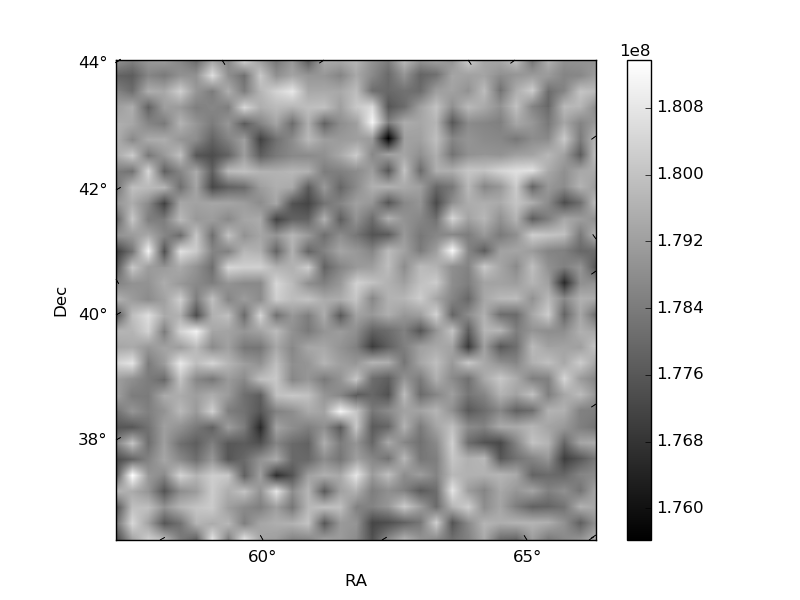
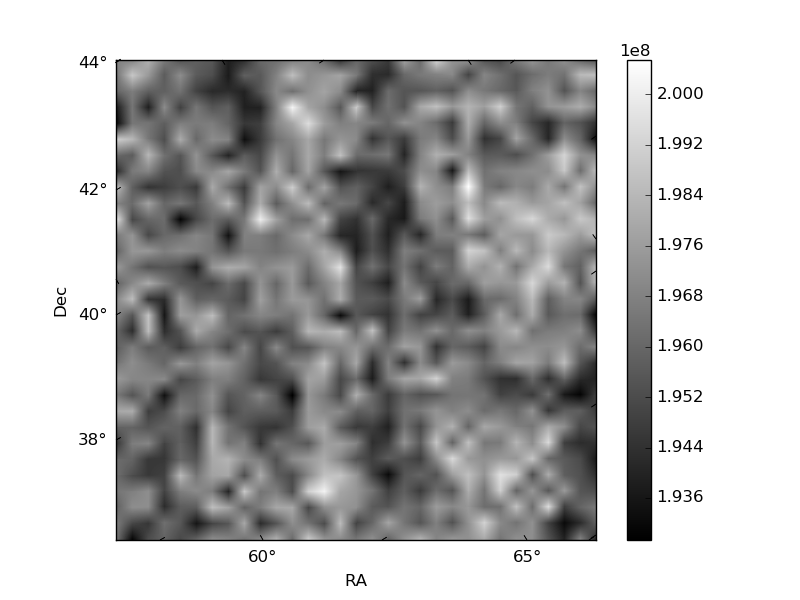
Histogram calculated using DETX and DETY for each event in the final _common_clean file
| Quadrant A | 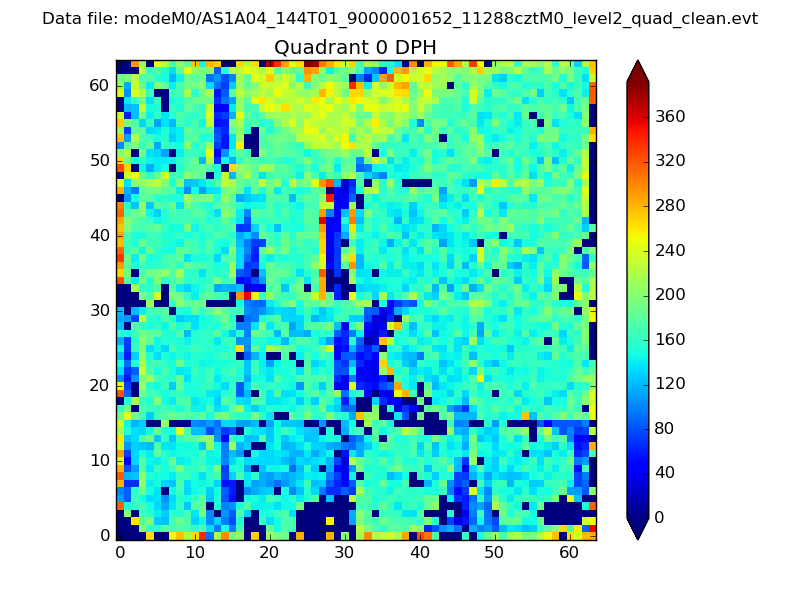 |
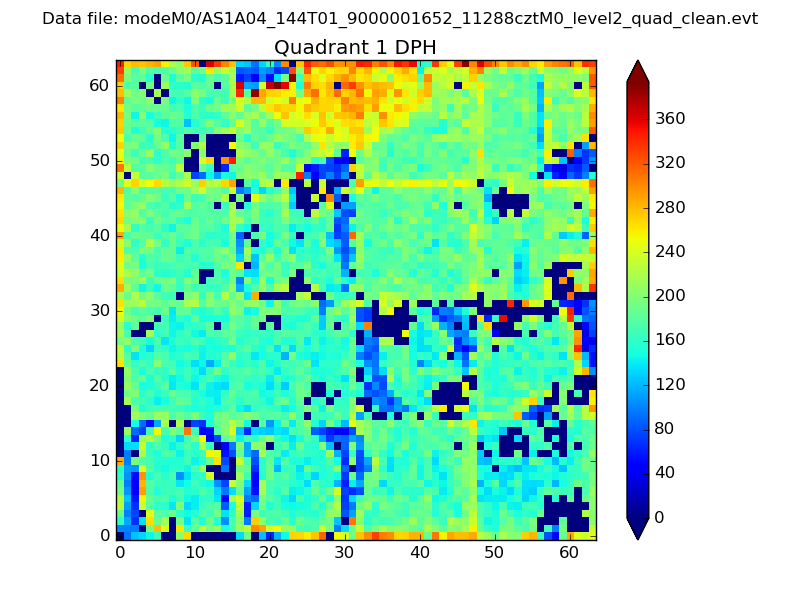 |
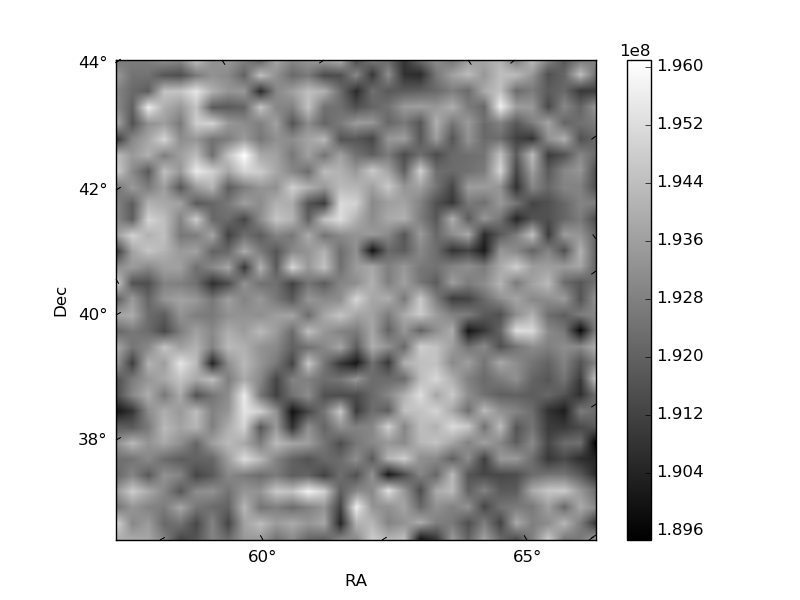
Quadrant B |
|---|---|---|---|
| Quadrant D | 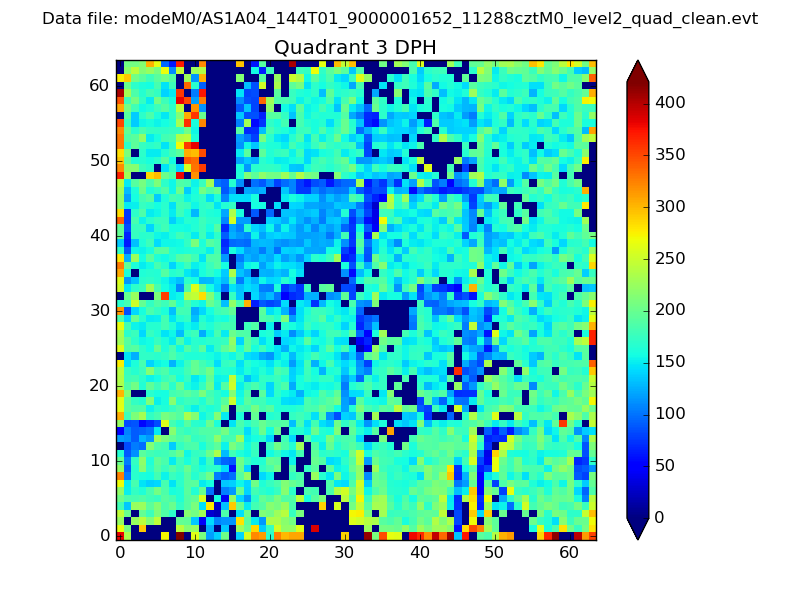 |
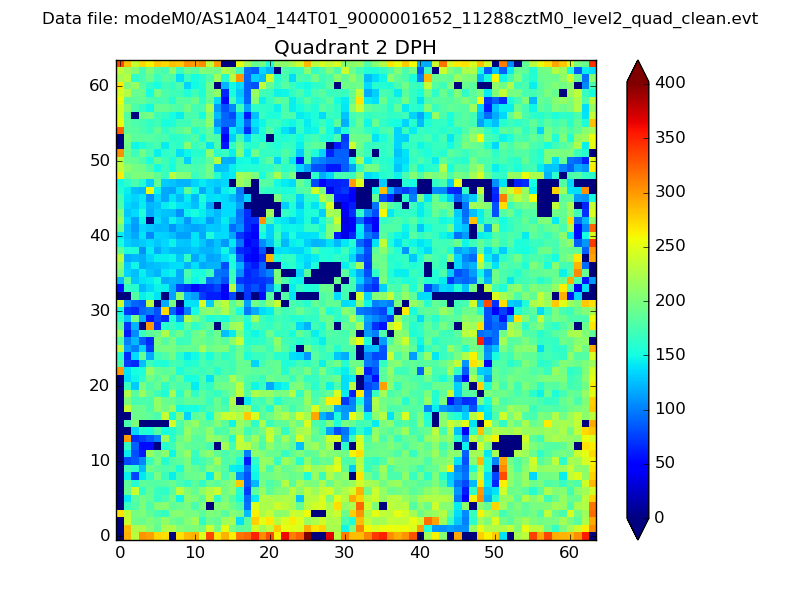 |
Quadrant C |
| Plot type | Count rate plots | Images |
|---|---|---|
| Comparison with Poisson distribution Blue bars denote a histogram of data divided into 1 sec bins. Red curve is a Poisson curve with rate = median count rate of data. |
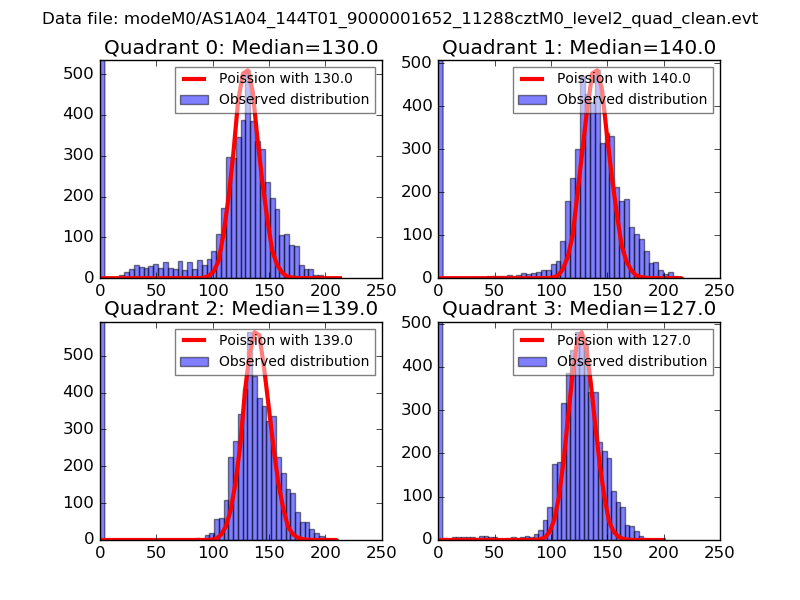 |
 |
| Quadrant-wise count rates Data is divided into 100 sec bins |
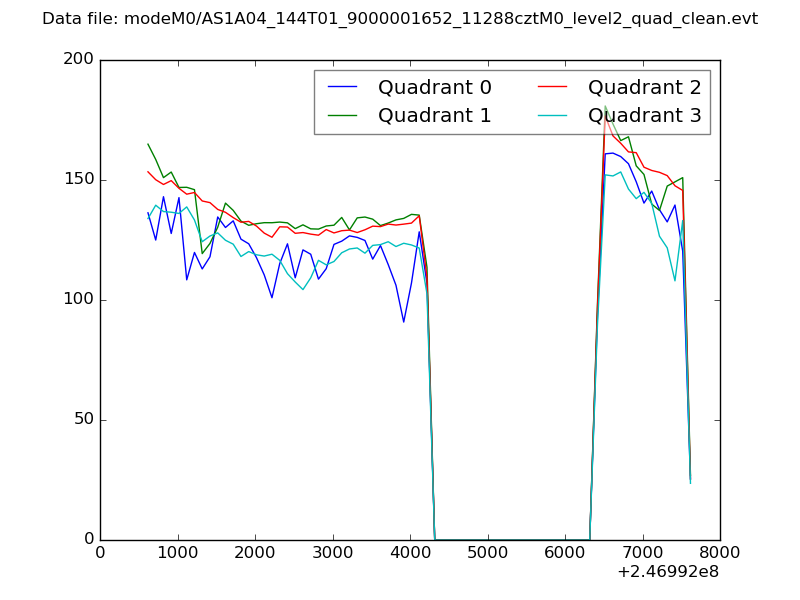 |
|
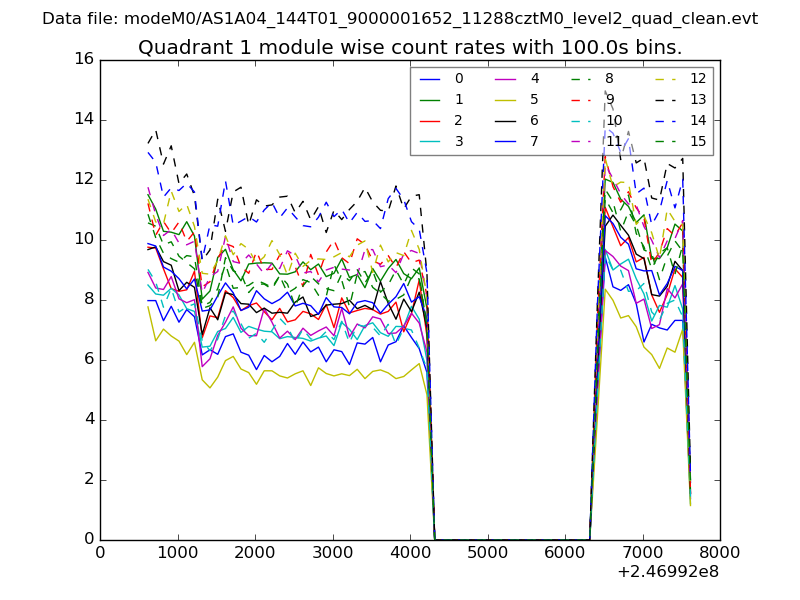
| Module-wise count rates for Quadrant A Data is divided into 100 sec bins |
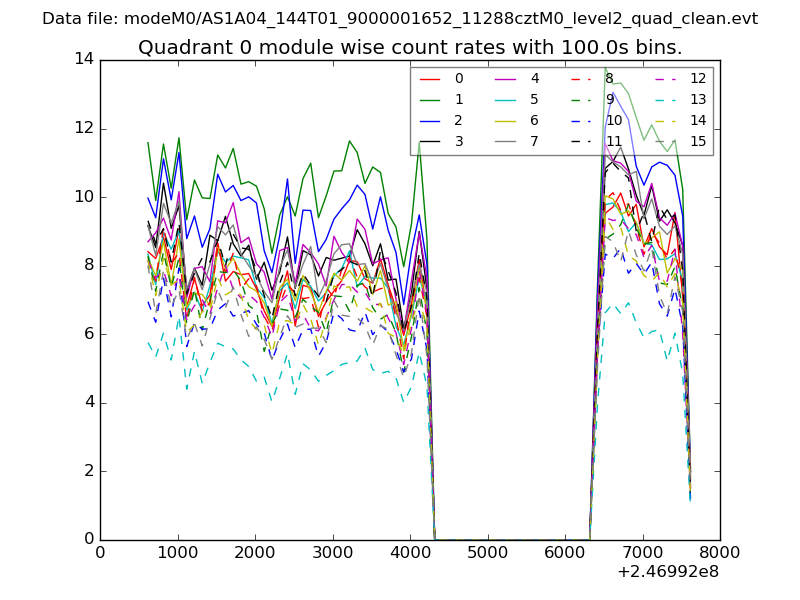 |
 |
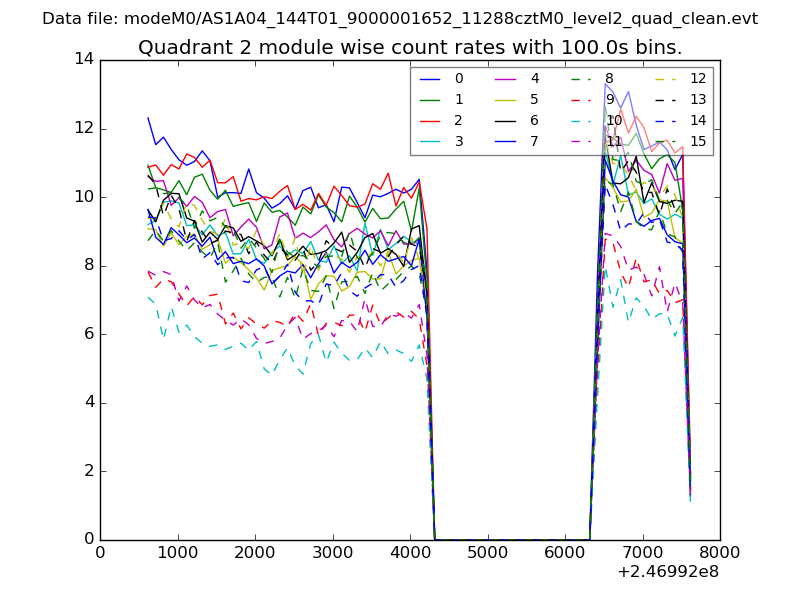
| Module-wise count rates for Quadrant B Data is divided into 100 sec bins |
 |
 |
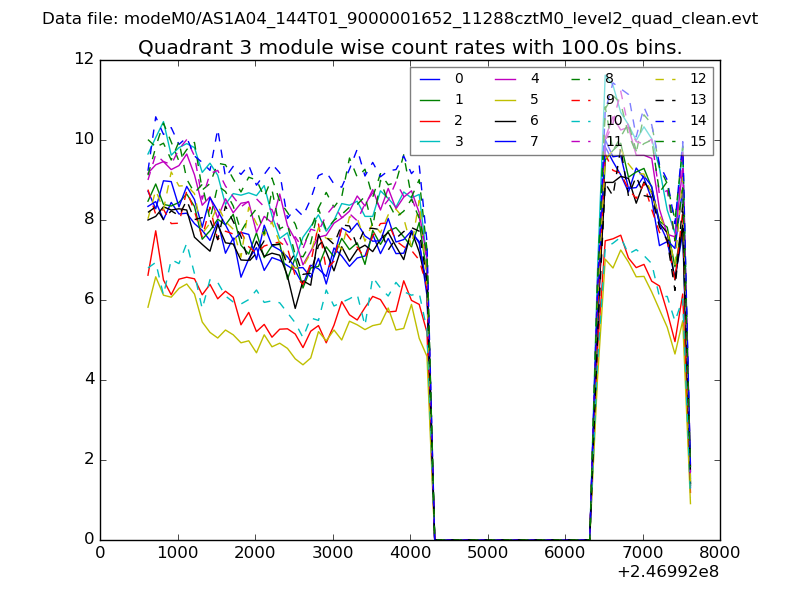
| Module-wise count rates for Quadrant C Data is divided into 100 sec bins |
 |
 |
| Module-wise count rates for Quadrant D Data is divided into 100 sec bins |
 |
 |
| Parameter | Plot |
|---|---|
| CZT HV Monitor | 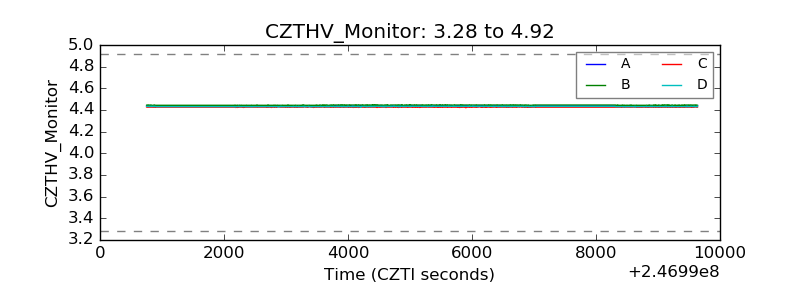 |
| D_VDD | 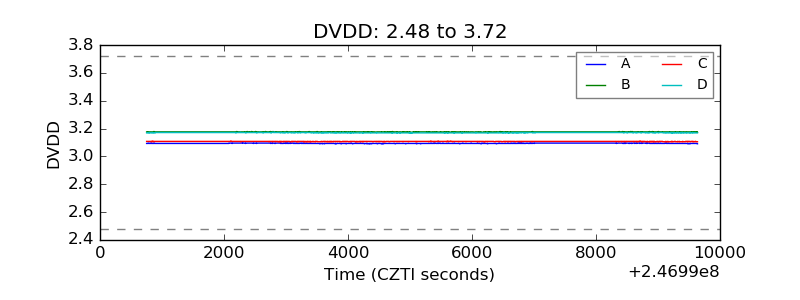 |
| Temperature 1 | 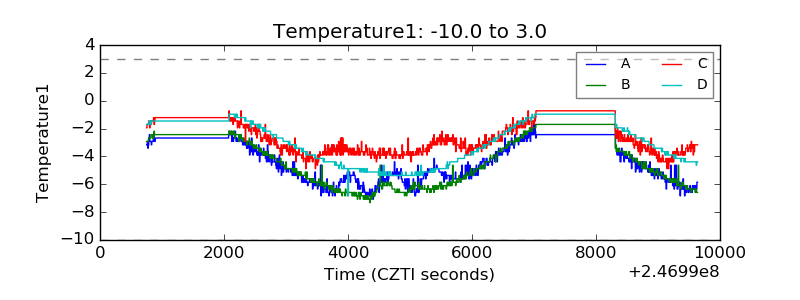 |
| Veto HV Monitor | 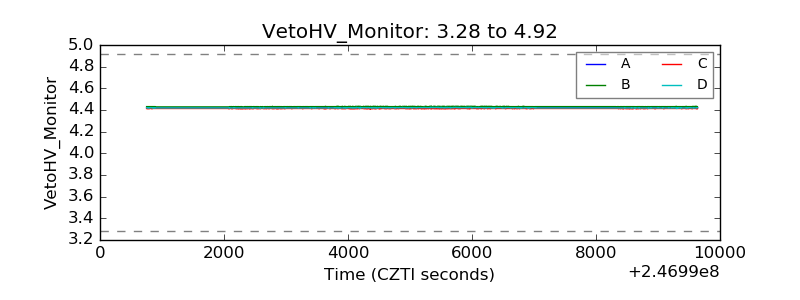 |
| Veto LLD | 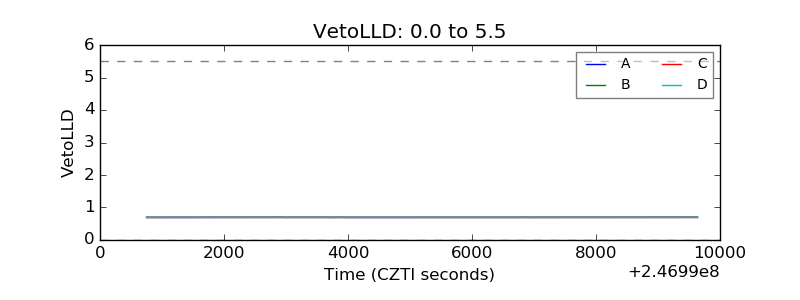 |
| Alpha Counter |  |
| _CPM_Rate | 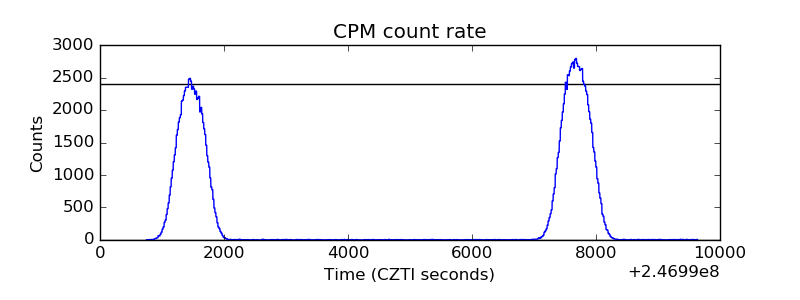 |
| CZT Counter |  |
| +2.5 Volts monitor |  |
| +5 Volts monitor |  |
| _ROLL_ROT | 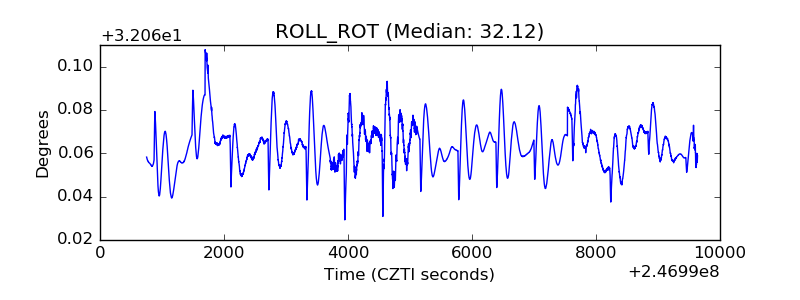 |
| _Roll_DEC | 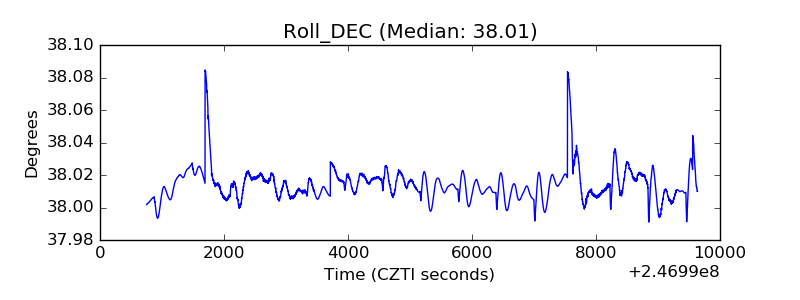 |
| _Roll_RA | 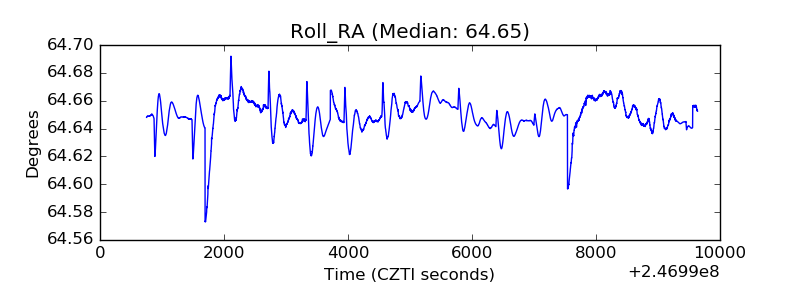 |
| Veto Counter | 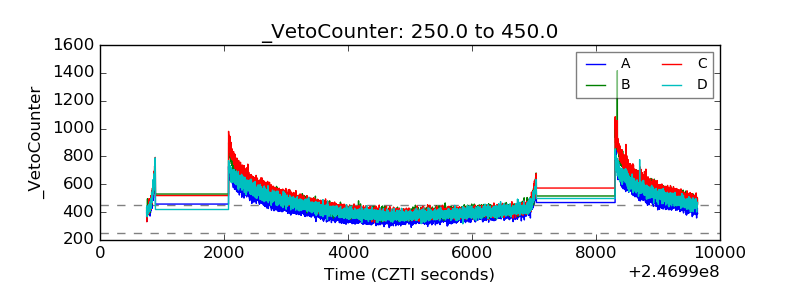 |