| Param | Original file | Final file |
|---|---|---|
| Filename | modeM0/AS1A04_144T01_9000001652_11289cztM0_level2.evt | modeM0/AS1A04_144T01_9000001652_11289cztM0_level2_quad_clean.evt |
| Size (bytes) | 582,102,720 | 105,488,640 |
| Size | 555.1 MB | 100.6 MB |
| Events in quadrant A | 4,682,194 | 680,386 |
| Events in quadrant B | 4,293,365 | 728,463 |
| Events in quadrant C | 3,044,553 | 720,958 |
| Events in quadrant D | 5,189,836 | 632,697 |
| Mode SS | |||
|---|---|---|---|
| Quadrant | BADHDUFLAG | Total packets | Discarded packets |
| A | 0 | 126 | 0 |
| B | 0 | 126 | 0 |
| C | 0 | 126 | 0 |
| D | 0 | 126 | 0 |
| Mode M0 | |||
|---|---|---|---|
| Quadrant | BADHDUFLAG | Total packets | Discarded packets |
| A | 0 | 18148 | 3 |
| B | 0 | 16837 | 2 |
| C | 0 | 13113 | 2 |
| D | 0 | 19742 | 2 |
| Mode M9 | |||
|---|---|---|---|
| Quadrant | BADHDUFLAG | Total packets | Discarded packets |
| A | 0 | 13 | 0 |
| B | 0 | 13 | 0 |
| C | 0 | 13 | 0 |
| D | 0 | 14 | 0 |
| Quadrant | Total seconds | Saturated seconds | Saturation percentage |
|---|---|---|---|
| A | 6190 | 327 | 5.282714% |
| B | 6190 | 417 | 6.736672% |
| C | 6190 | 22 | 0.355412% |
| D | 6190 | 504 | 8.142165% |
Noise dominated data is calculated using 1-second bins in cleaned event files. If a bin has >2000 counts, and if more than 50% of those come from <1% of pixels, then it is considered to be noise-dominated and hence unusable.
| Quadrant | # 1 sec bins | Bins with >0 counts | Bins with >2000 counts | High rate bins dominated by noise | Noise dominated (total time) | Noise dominated (detector-on time) | Marked lightcurve |
|---|---|---|---|---|---|---|---|
| A | 7525 | 6191 | 247 | 247 | 3.28% | 3.99% | 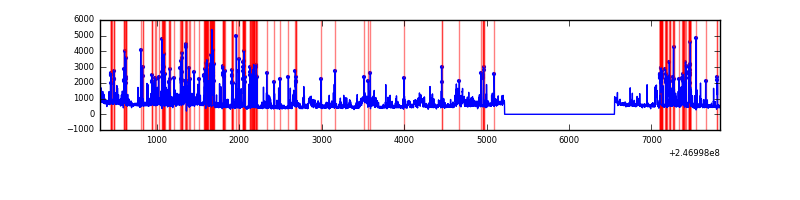 |
| B | 7525 | 6191 | 182 | 182 | 2.42% | 2.94% | 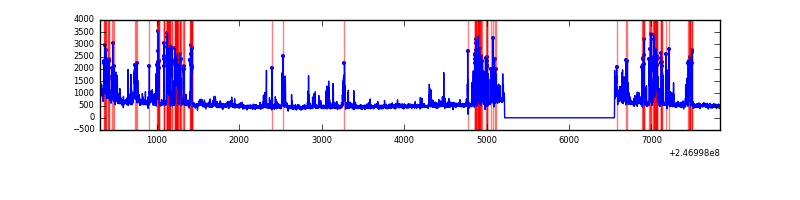 |
| C | 7525 | 6191 | 2 | 2 | 0.03% | 0.03% | 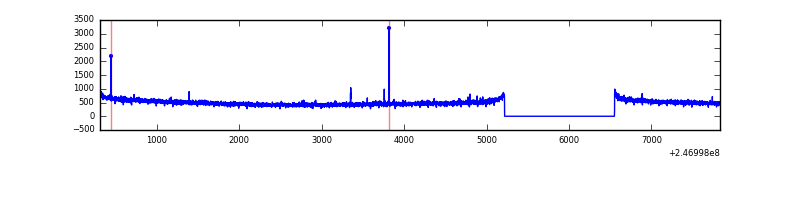 |
| D | 7525 | 6190 | 406 | 406 | 5.40% | 6.56% | 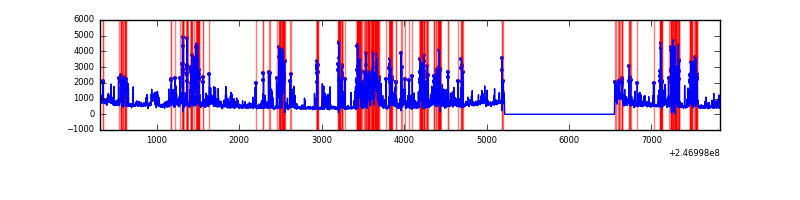 |
Top three noisy pixels from each quadrant. If the there are fewer than three noisy pixels in the level2.evt file, extra rows are filled as -1
| Pixel properties | Quadrant properties | ||||||
|---|---|---|---|---|---|---|---|
| Quadrant | DetID | PixID | Counts | Sigma | Mean | Median | Sigma |
| A | 8 | 5 | 1373520 | 8939.11 | 764 | 752 | 153.6 |
| A | 14 | 238 | 140190 | 907.98 | 764 | 752 | 153.6 |
| A | 8 | 15 | 64269 | 413.61 | 764 | 752 | 153.6 |
| B | 4 | 239 | 1068708 | 7324.93 | 783 | 767 | 145.8 |
| B | 4 | 81 | 46260 | 312.03 | 783 | 767 | 145.8 |
| B | 0 | 219 | 34693 | 232.7 | 783 | 767 | 145.8 |
| C | 9 | 204 | 9459 | 48.41 | 777 | 783 | 179.2 |
| C | 13 | 61 | 5646 | 27.13 | 777 | 783 | 179.2 |
| C | 12 | 4 | 4320 | 19.74 | 777 | 783 | 179.2 |
| D | 1 | 52 | 762237 | 4366.11 | 732 | 713 | 174.4 |
| D | 10 | 253 | 623153 | 3568.68 | 732 | 713 | 174.4 |
| D | 12 | 157 | 478217 | 2737.71 | 732 | 713 | 174.4 |
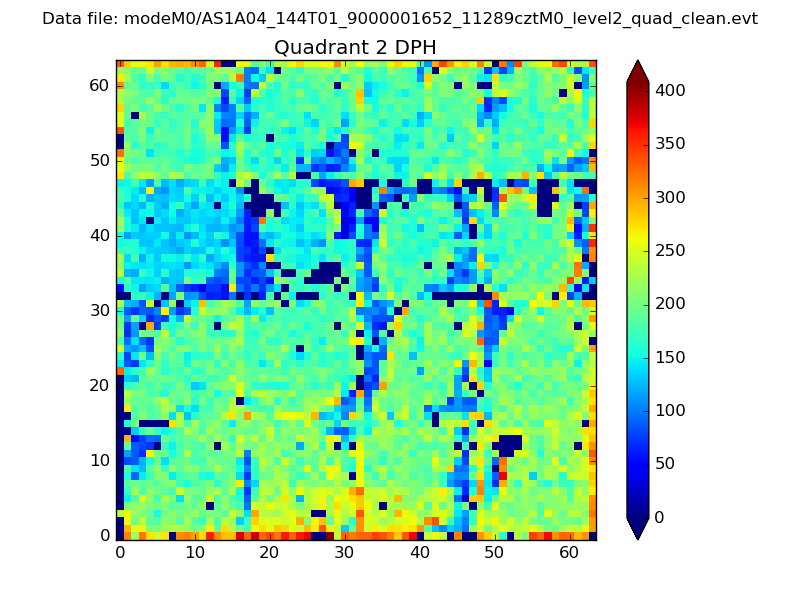
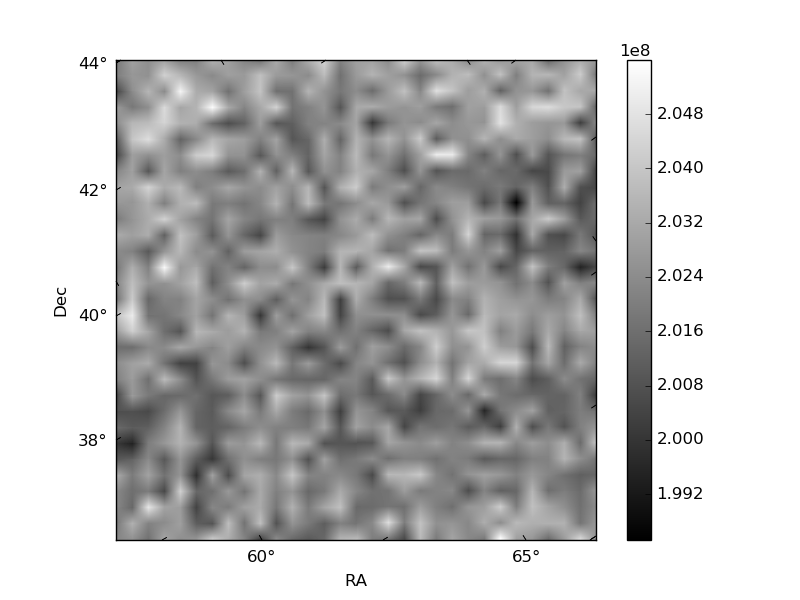
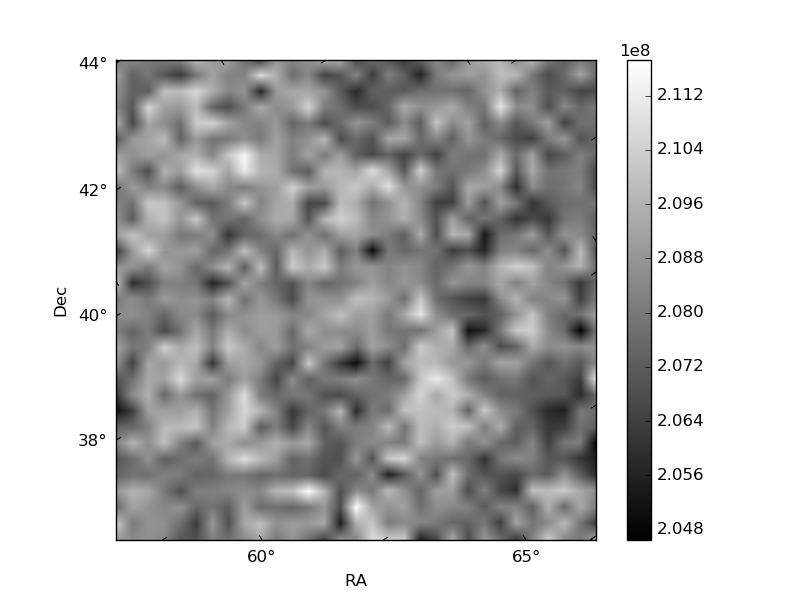
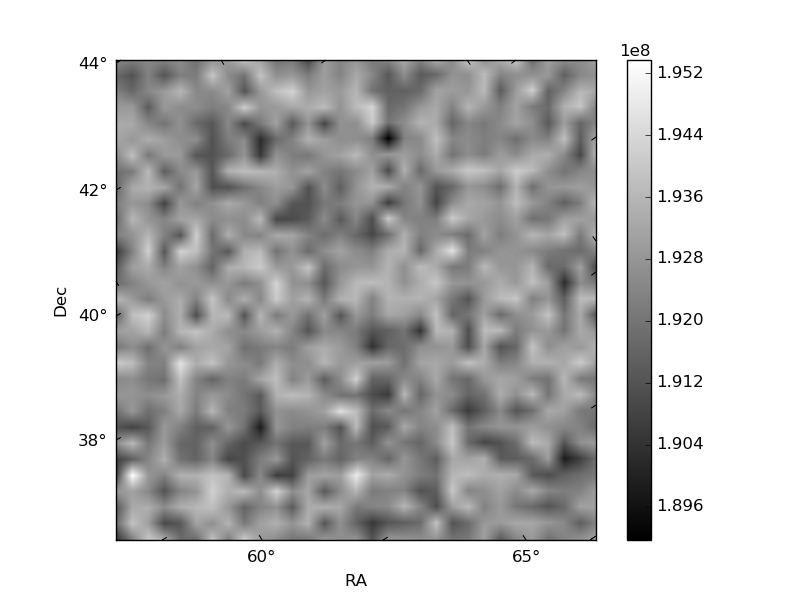
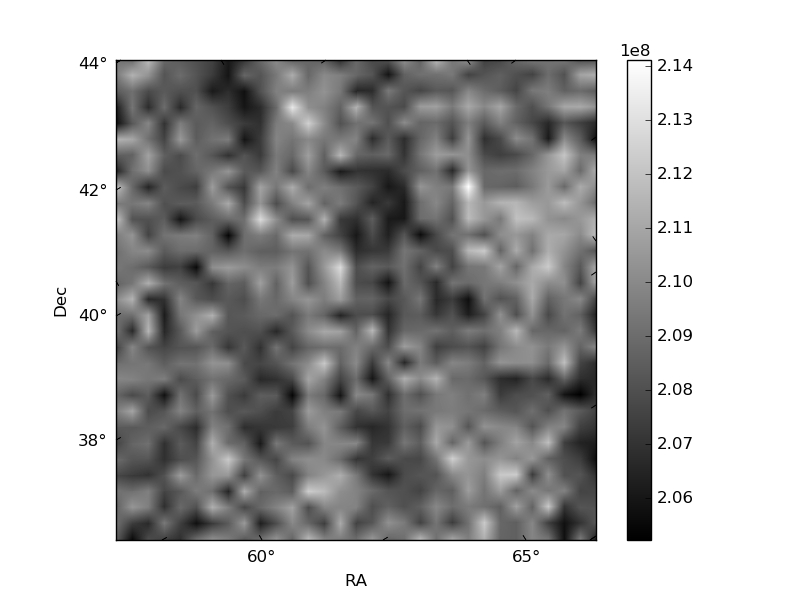
Histogram calculated using DETX and DETY for each event in the final _common_clean file
| Quadrant A | 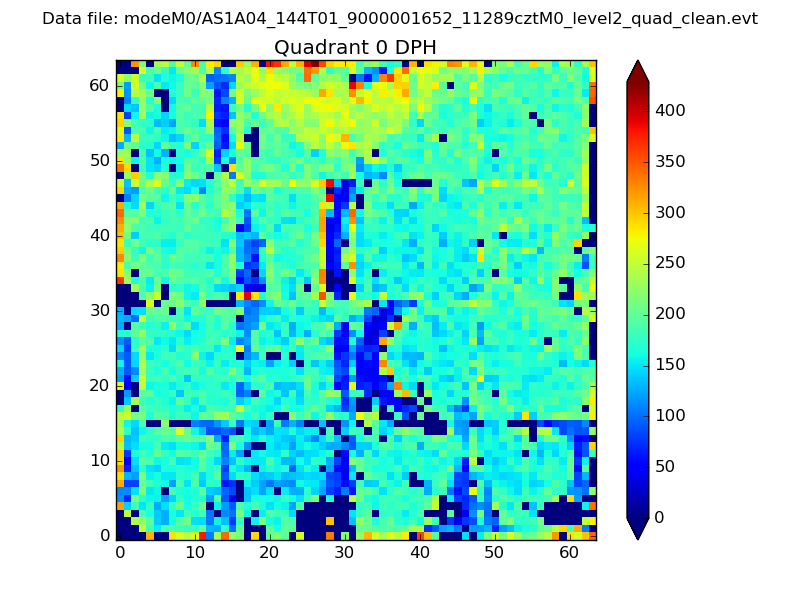 |
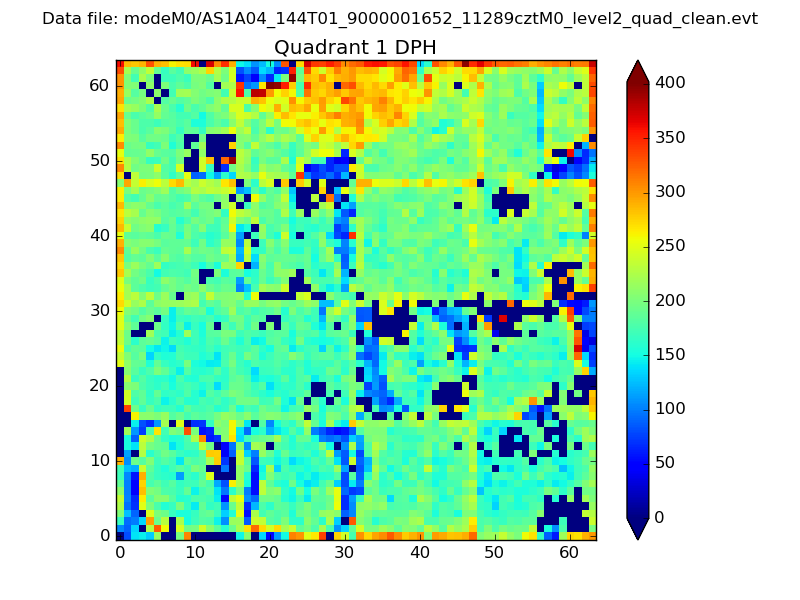 |
Quadrant B |
|---|---|---|---|
| Quadrant D | 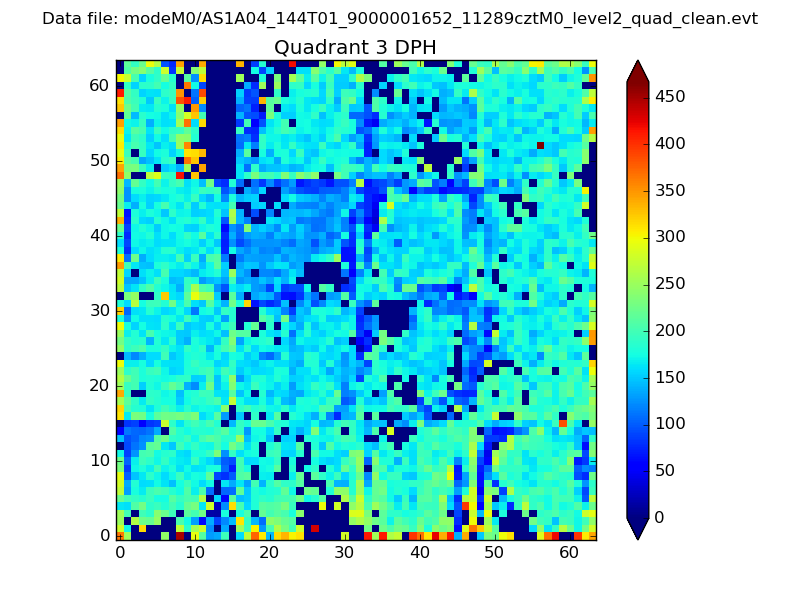 |
 |
Quadrant C |
| Plot type | Count rate plots | Images |
|---|---|---|
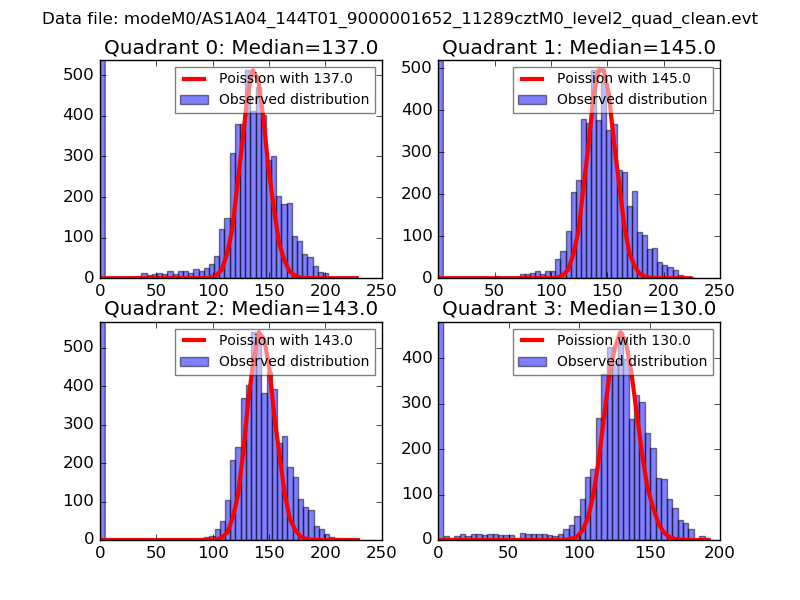
| Comparison with Poisson distribution Blue bars denote a histogram of data divided into 1 sec bins. Red curve is a Poisson curve with rate = median count rate of data. |
 |
 |
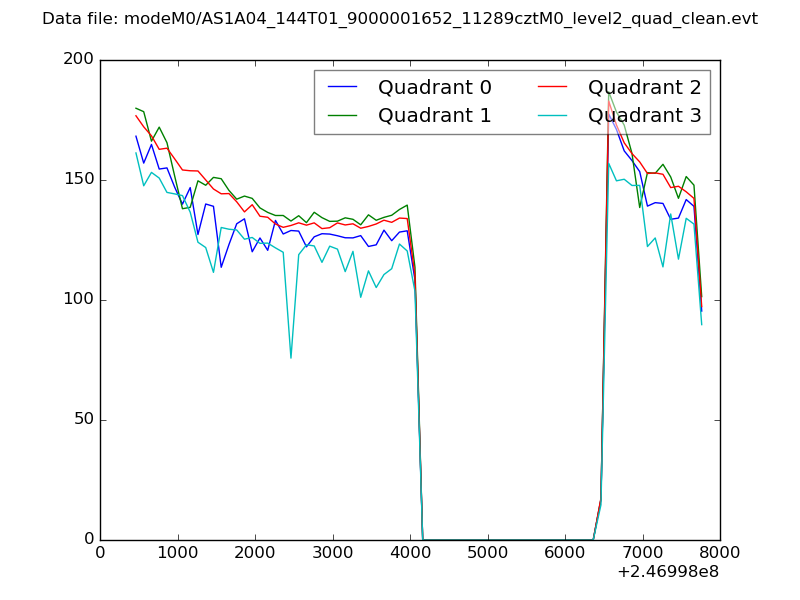
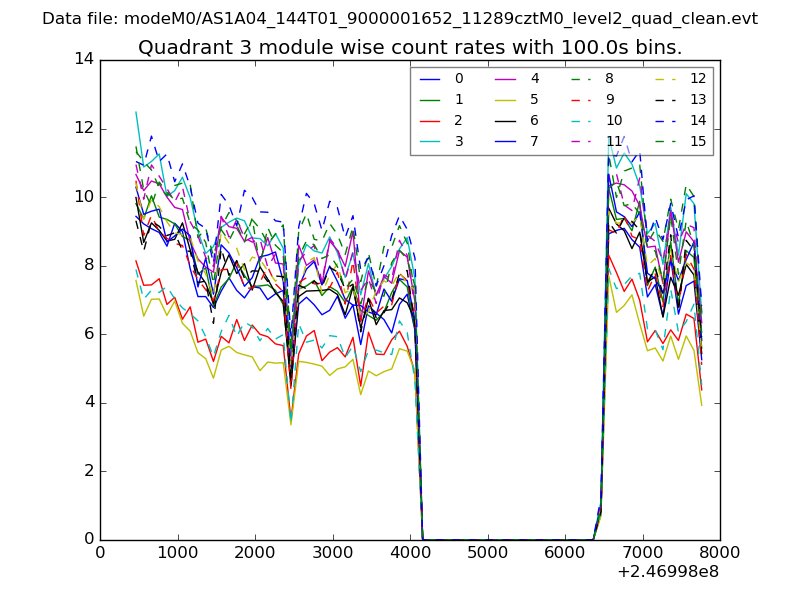
| Quadrant-wise count rates Data is divided into 100 sec bins |
 |
|
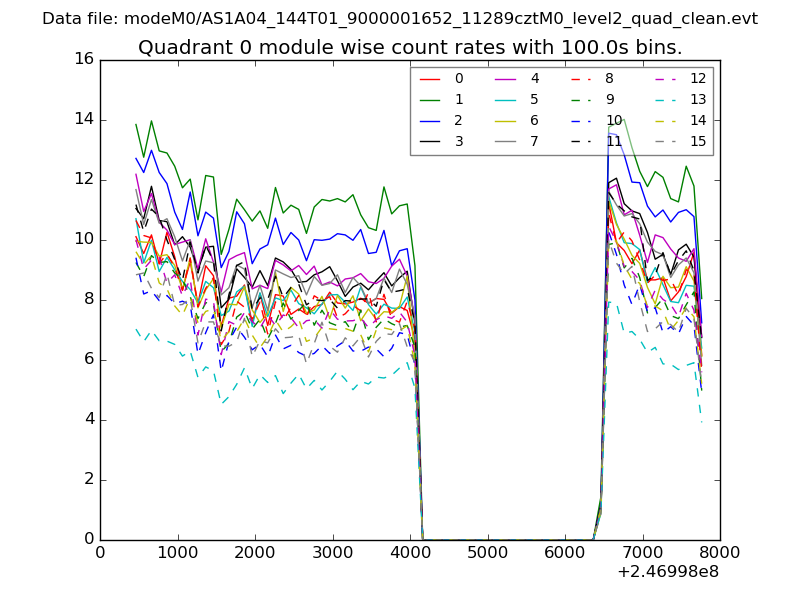
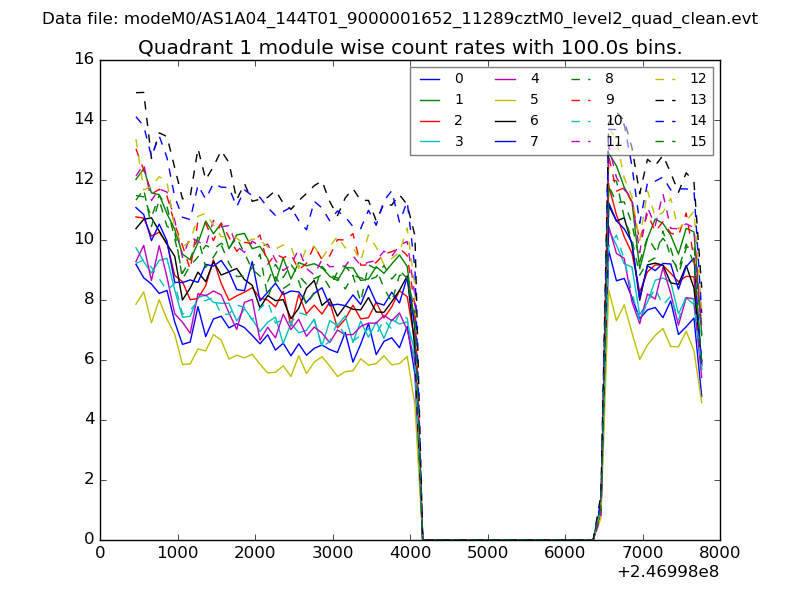
| Module-wise count rates for Quadrant A Data is divided into 100 sec bins |
 |
 |
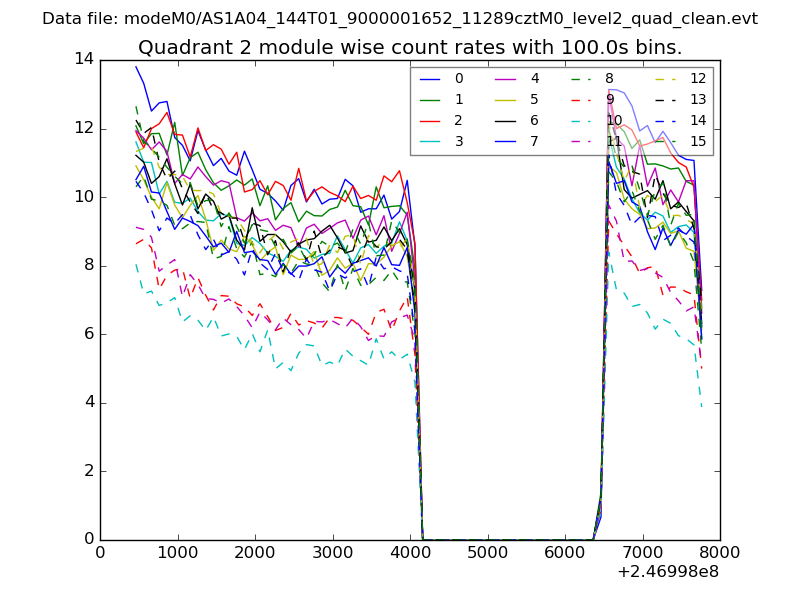
| Module-wise count rates for Quadrant B Data is divided into 100 sec bins |
 |
 |
| Module-wise count rates for Quadrant C Data is divided into 100 sec bins |
 |
 |
| Module-wise count rates for Quadrant D Data is divided into 100 sec bins |
 |
 |
| Parameter | Plot |
|---|---|
| CZT HV Monitor | 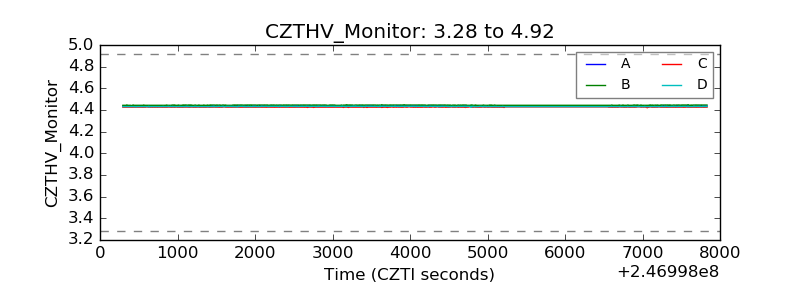 |
| D_VDD | 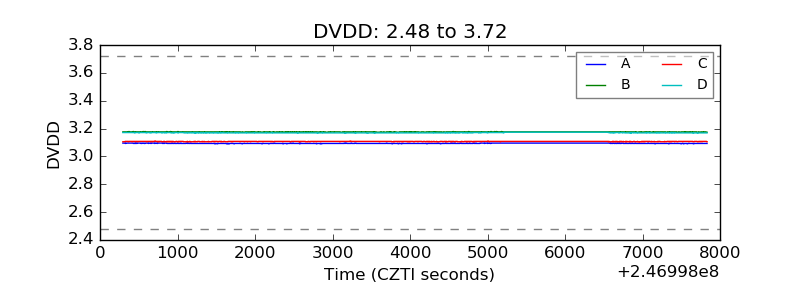 |
| Temperature 1 | 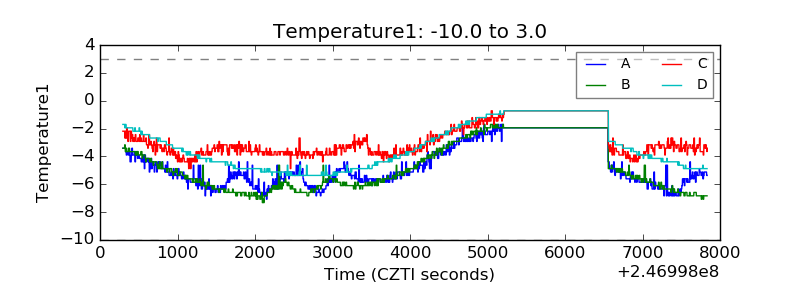 |
| Veto HV Monitor | 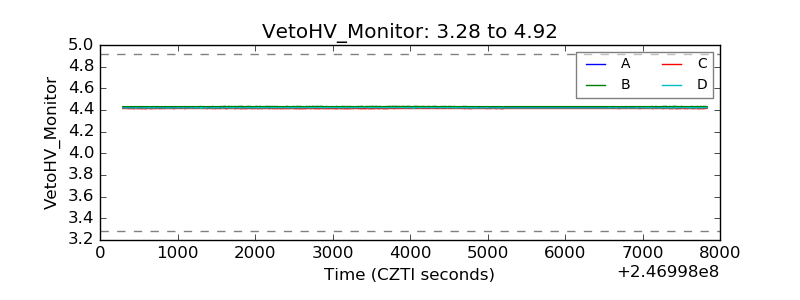 |
| Veto LLD | 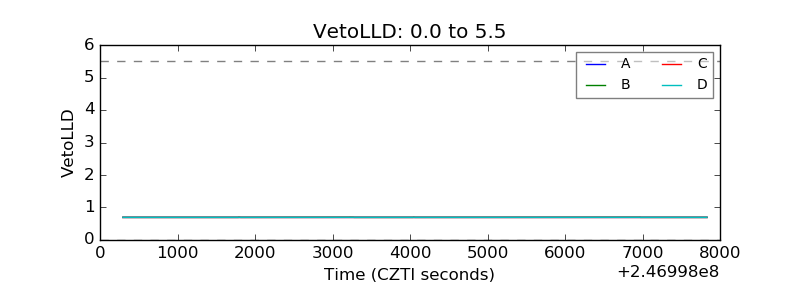 |
| Alpha Counter | 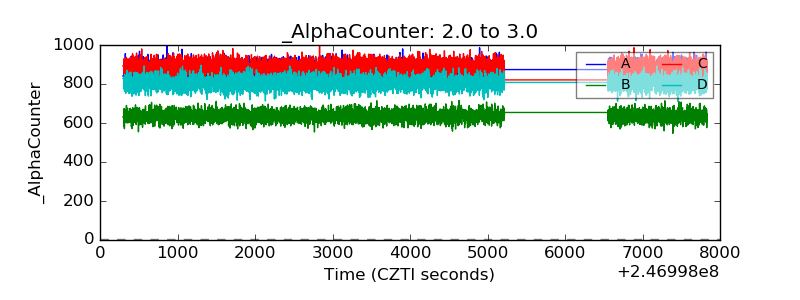 |
| _CPM_Rate |  |
| CZT Counter | 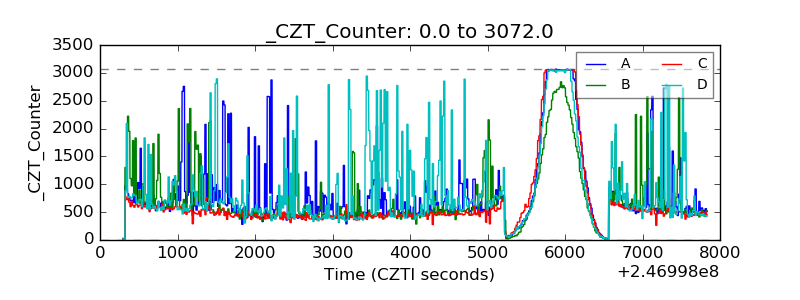 |
| +2.5 Volts monitor |  |
| +5 Volts monitor |  |
| _ROLL_ROT | 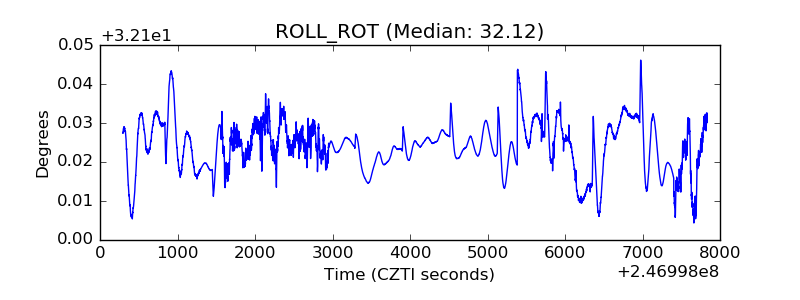 |
| _Roll_DEC |  |
| _Roll_RA | 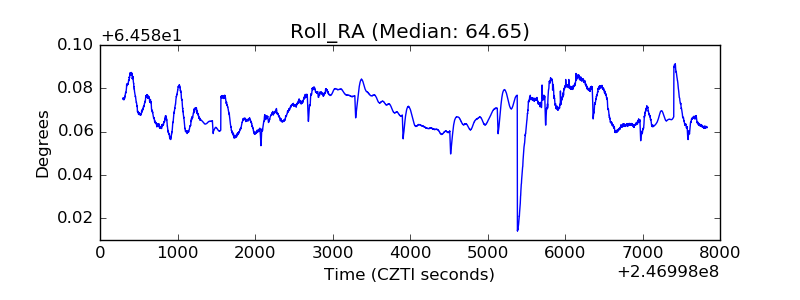 |
| Veto Counter | 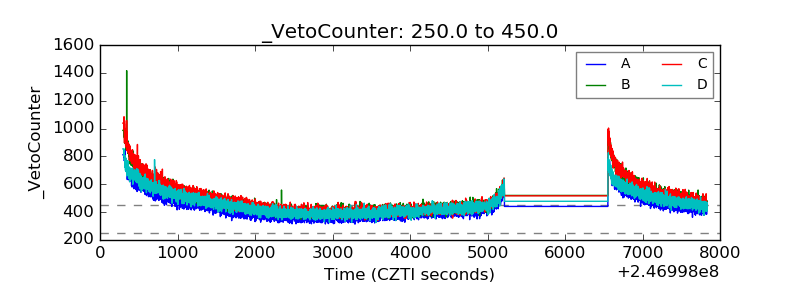 |