| Param | Original file | Final file |
|---|---|---|
| Filename | modeM0/AS1A04_144T01_9000001652_11290cztM0_level2.evt | modeM0/AS1A04_144T01_9000001652_11290cztM0_level2_quad_clean.evt |
| Size (bytes) | 572,129,280 | 99,881,280 |
| Size | 545.6 MB | 95.3 MB |
| Events in quadrant A | 5,054,749 | 643,035 |
| Events in quadrant B | 3,914,424 | 684,641 |
| Events in quadrant C | 2,998,155 | 670,435 |
| Events in quadrant D | 4,933,366 | 587,227 |
| Mode SS | |||
|---|---|---|---|
| Quadrant | BADHDUFLAG | Total packets | Discarded packets |
| A | 0 | 132 | 0 |
| B | 0 | 132 | 0 |
| C | 0 | 132 | 0 |
| D | 0 | 132 | 0 |
| Mode M0 | |||
|---|---|---|---|
| Quadrant | BADHDUFLAG | Total packets | Discarded packets |
| A | 0 | 19329 | 3 |
| B | 0 | 15800 | 2 |
| C | 0 | 13083 | 2 |
| D | 0 | 18878 | 2 |
| Mode M9 | |||
|---|---|---|---|
| Quadrant | BADHDUFLAG | Total packets | Discarded packets |
| A | 0 | 26 | 0 |
| B | 0 | 26 | 0 |
| C | 0 | 26 | 0 |
| D | 0 | 26 | 0 |
| Quadrant | Total seconds | Saturated seconds | Saturation percentage |
|---|---|---|---|
| A | 6286 | 321 | 5.106586% |
| B | 6286 | 313 | 4.979319% |
| C | 6286 | 22 | 0.349984% |
| D | 6286 | 514 | 8.176901% |
Noise dominated data is calculated using 1-second bins in cleaned event files. If a bin has >2000 counts, and if more than 50% of those come from <1% of pixels, then it is considered to be noise-dominated and hence unusable.
| Quadrant | # 1 sec bins | Bins with >0 counts | Bins with >2000 counts | High rate bins dominated by noise | Noise dominated (total time) | Noise dominated (detector-on time) | Marked lightcurve |
|---|---|---|---|---|---|---|---|
| A | 8946 | 6288 | 208 | 208 | 2.33% | 3.31% | 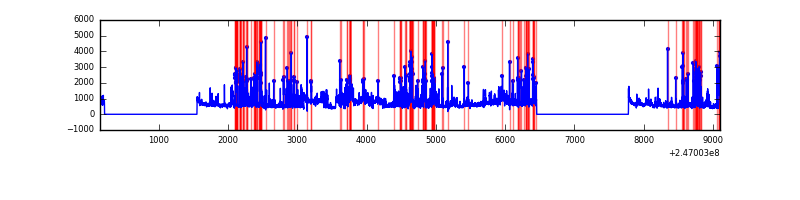 |
| B | 8946 | 6288 | 114 | 114 | 1.27% | 1.81% | 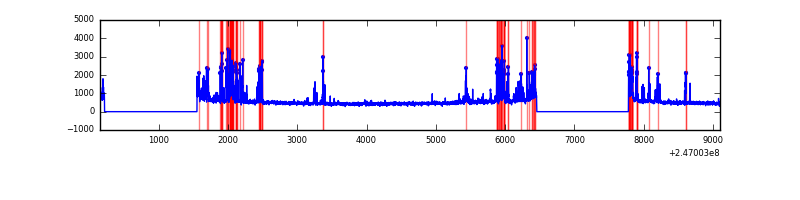 |
| C | 8946 | 6288 | 1 | 1 | 0.01% | 0.02% | 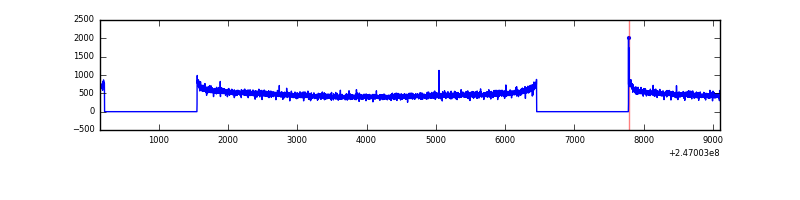 |
| D | 8946 | 6287 | 388 | 388 | 4.34% | 6.17% | 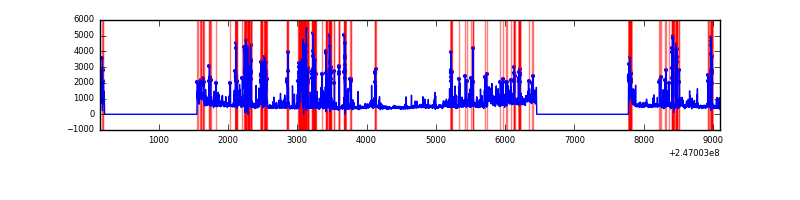 |
Top three noisy pixels from each quadrant. If the there are fewer than three noisy pixels in the level2.evt file, extra rows are filled as -1
| Pixel properties | Quadrant properties | ||||||
|---|---|---|---|---|---|---|---|
| Quadrant | DetID | PixID | Counts | Sigma | Mean | Median | Sigma |
| A | 8 | 5 | 1826364 | 11902.24 | 760 | 748 | 153.4 |
| A | 14 | 238 | 207526 | 1348.11 | 760 | 748 | 153.4 |
| A | 8 | 15 | 27926 | 177.19 | 760 | 748 | 153.4 |
| B | 4 | 239 | 794243 | 5416.66 | 778 | 761 | 146.5 |
| B | 15 | 204 | 22843 | 150.74 | 778 | 761 | 146.5 |
| B | 12 | 111 | 16055 | 104.4 | 778 | 761 | 146.5 |
| C | 13 | 61 | 5522 | 26.82 | 768 | 773 | 177.1 |
| C | 10 | 95 | 2718 | 10.98 | 768 | 773 | 177.1 |
| C | 3 | 202 | 1801 | 5.81 | 768 | 773 | 177.1 |
| D | 10 | 253 | 777989 | 4531.94 | 720 | 700 | 171.5 |
| D | 12 | 157 | 358786 | 2087.8 | 720 | 700 | 171.5 |
| D | 1 | 52 | 340660 | 1982.12 | 720 | 700 | 171.5 |
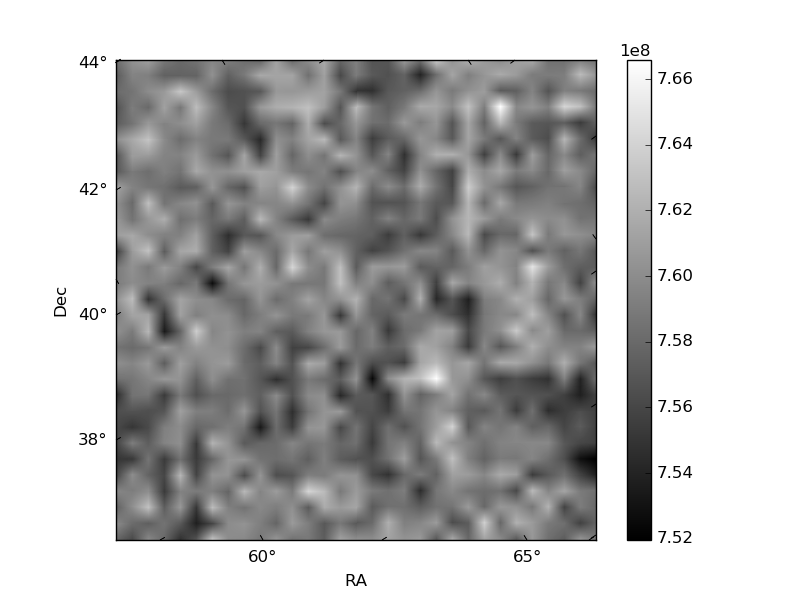
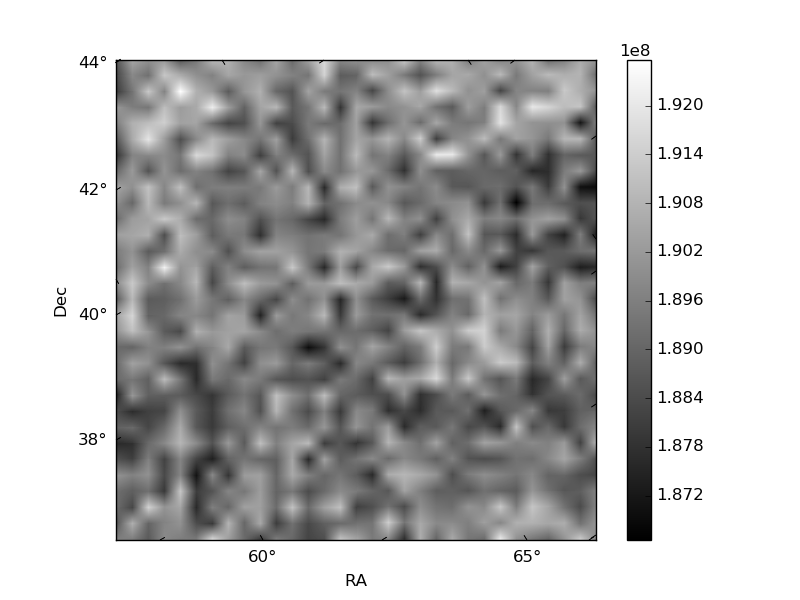
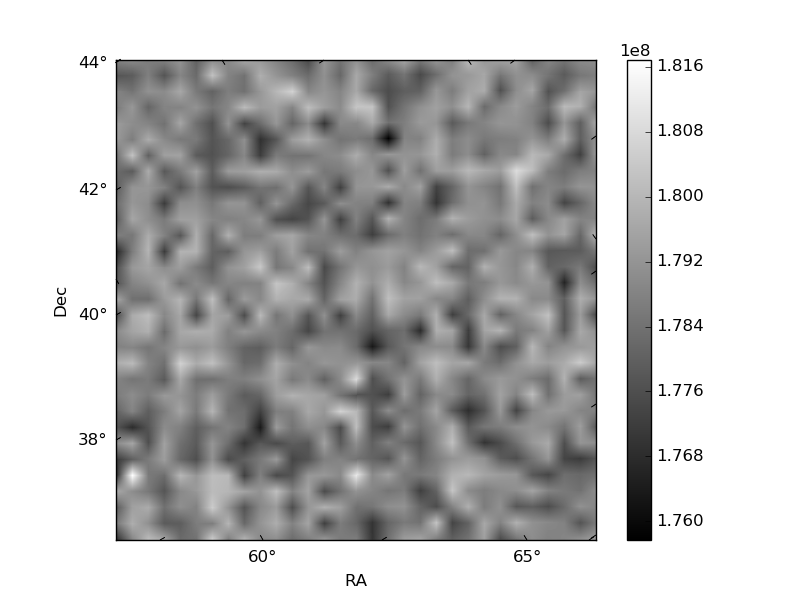
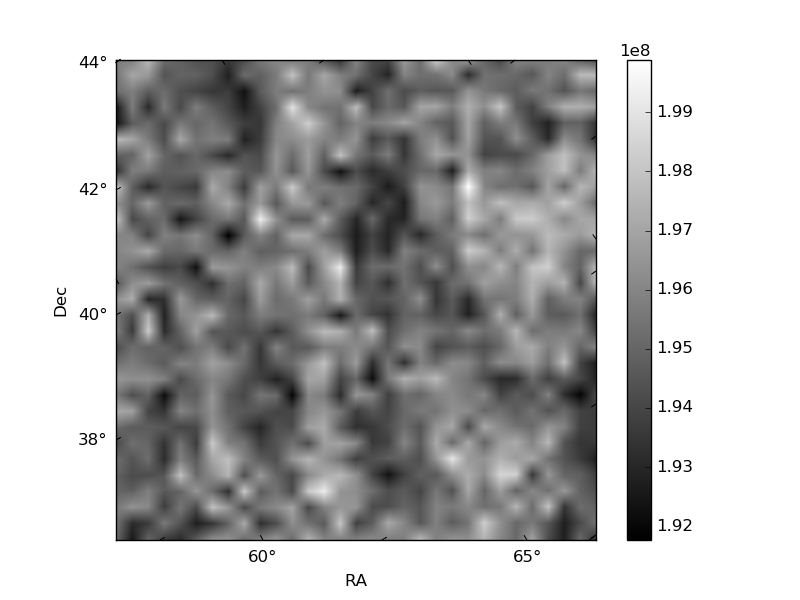
Histogram calculated using DETX and DETY for each event in the final _common_clean file
| Quadrant A | 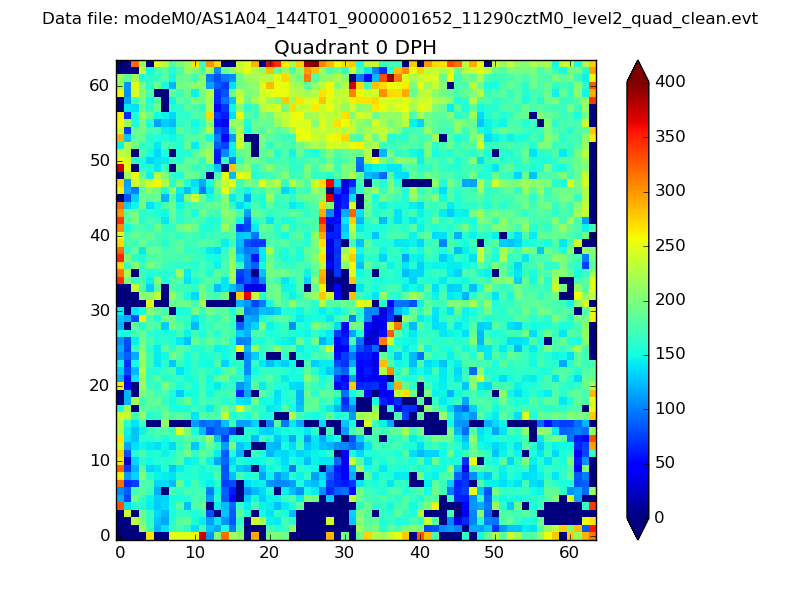 |
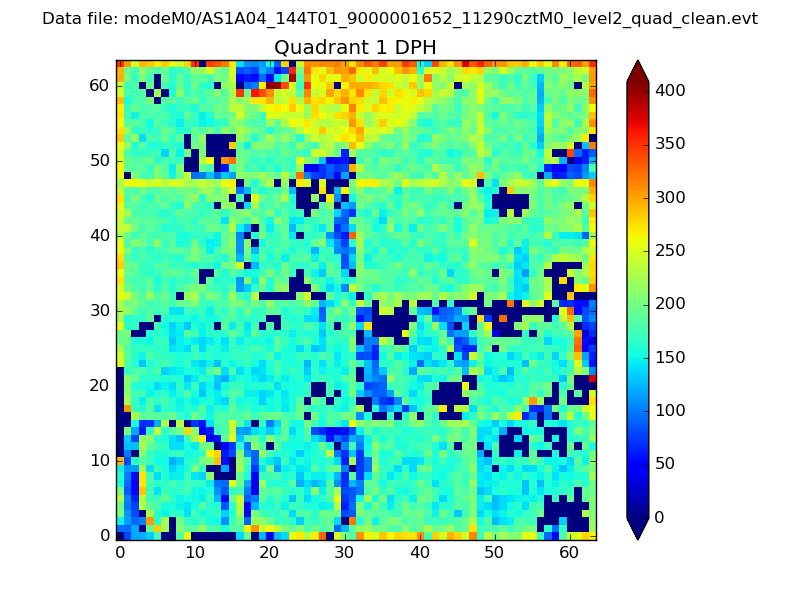 |
Quadrant B |
|---|---|---|---|
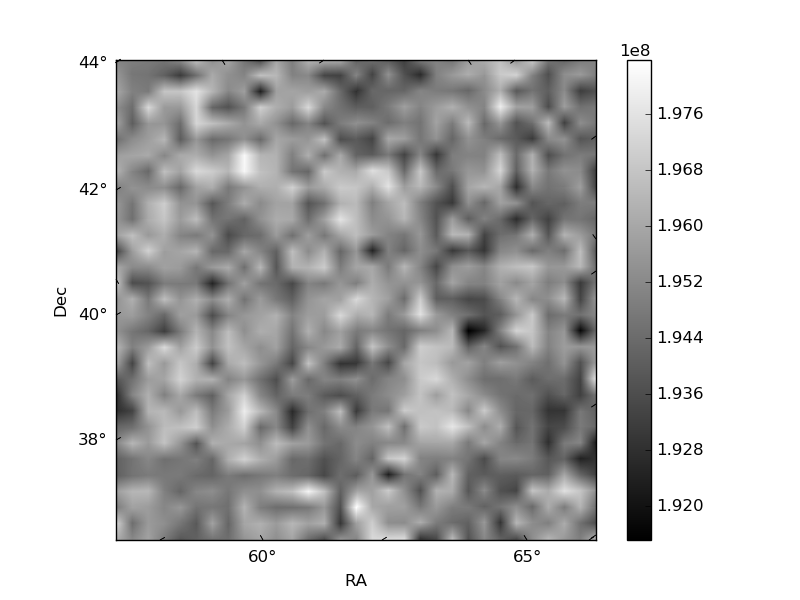
| Quadrant D | 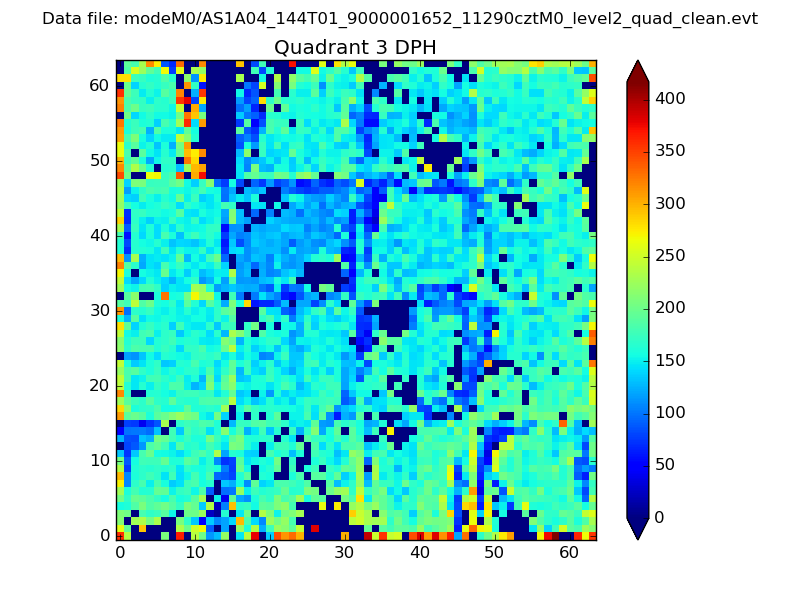 |
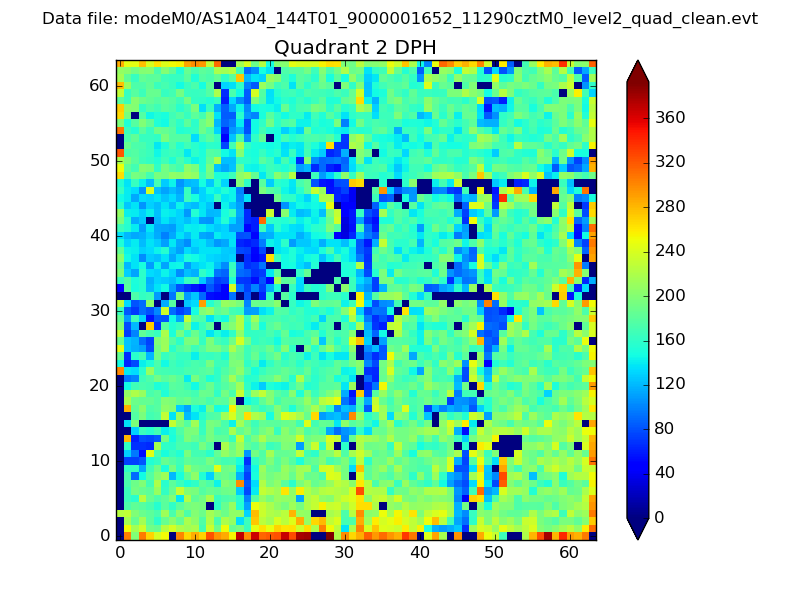 |
Quadrant C |
| Plot type | Count rate plots | Images |
|---|---|---|
| Comparison with Poisson distribution Blue bars denote a histogram of data divided into 1 sec bins. Red curve is a Poisson curve with rate = median count rate of data. |
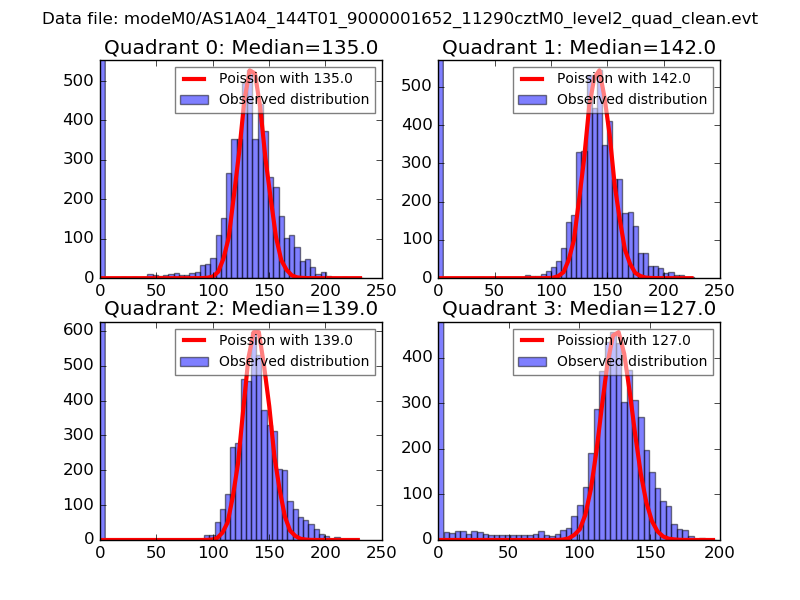 |
 |
| Quadrant-wise count rates Data is divided into 100 sec bins |
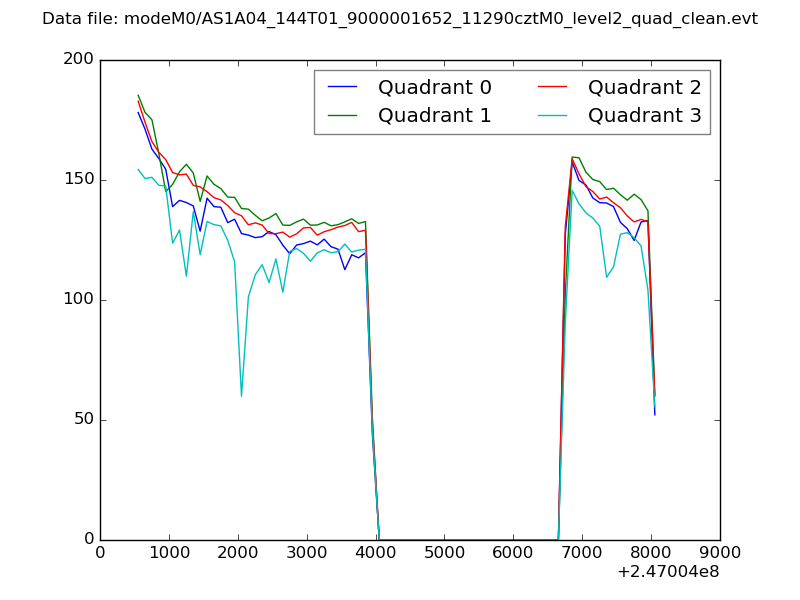 |
|
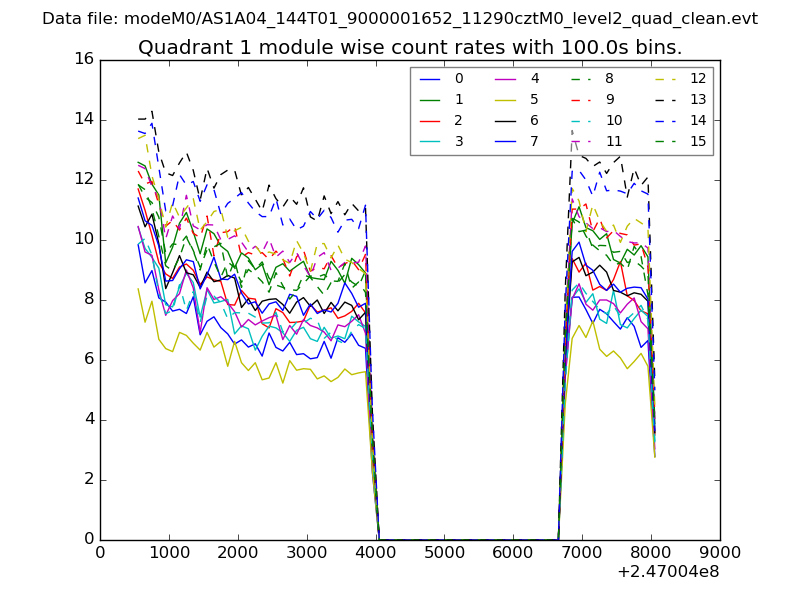
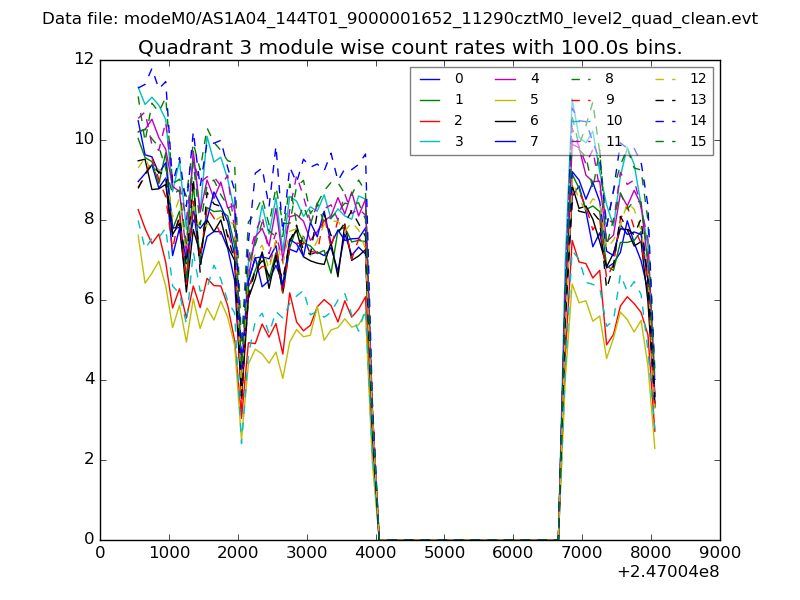
| Module-wise count rates for Quadrant A Data is divided into 100 sec bins |
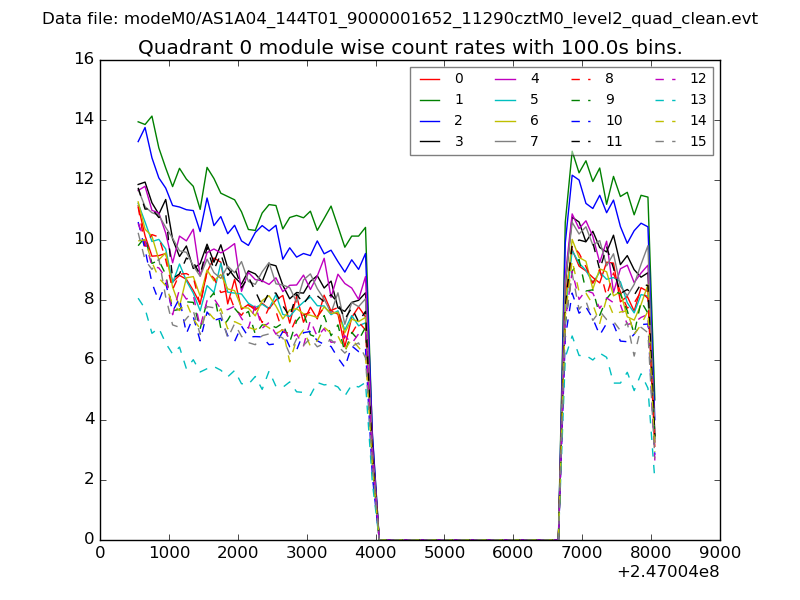 |
 |
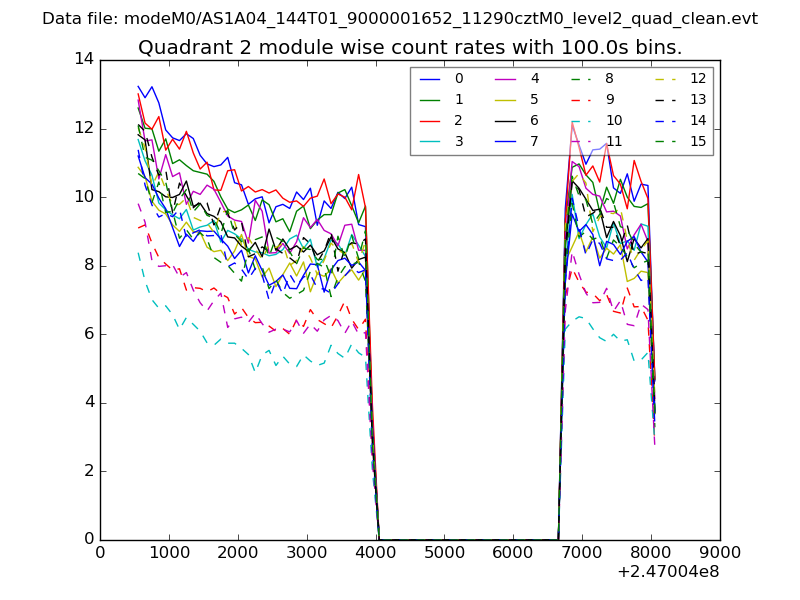
| Module-wise count rates for Quadrant B Data is divided into 100 sec bins |
 |
 |
| Module-wise count rates for Quadrant C Data is divided into 100 sec bins |
 |
 |
| Module-wise count rates for Quadrant D Data is divided into 100 sec bins |
 |
 |
| Parameter | Plot |
|---|---|
| CZT HV Monitor | 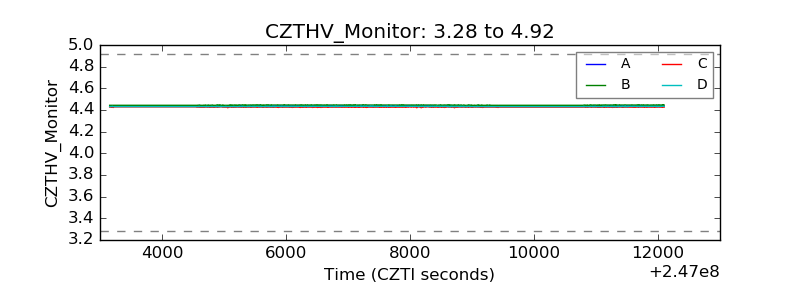 |
| D_VDD | 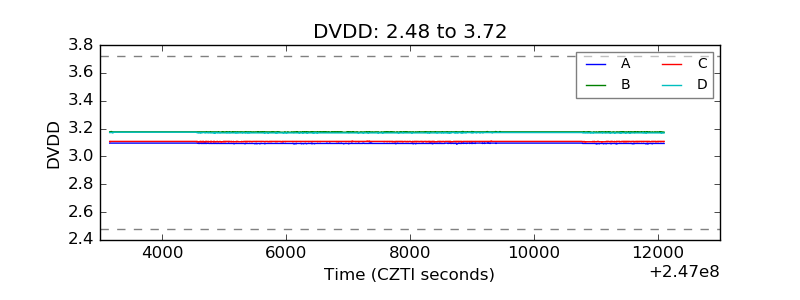 |
| Temperature 1 | 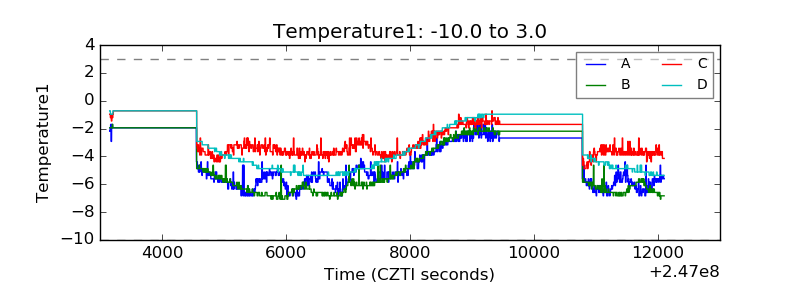 |
| Veto HV Monitor | 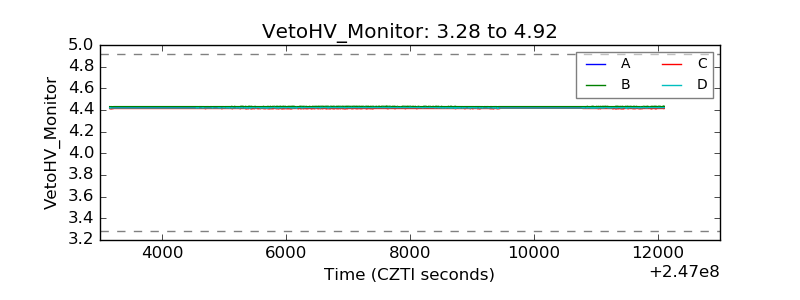 |
| Veto LLD | 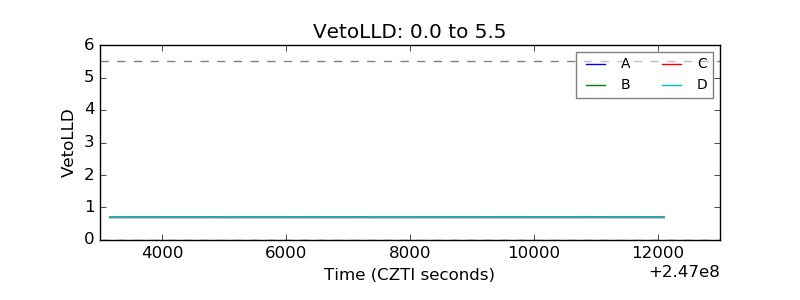 |
| Alpha Counter | 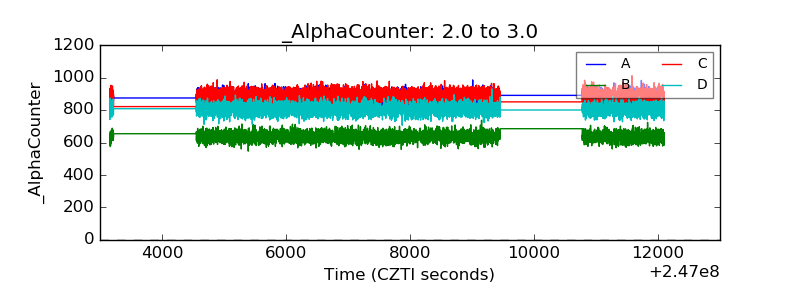 |
| _CPM_Rate | 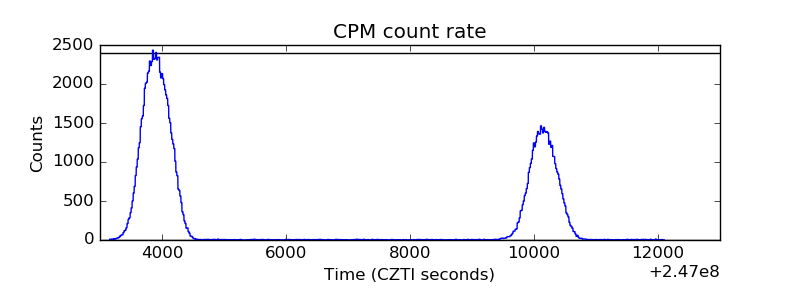 |
| CZT Counter | 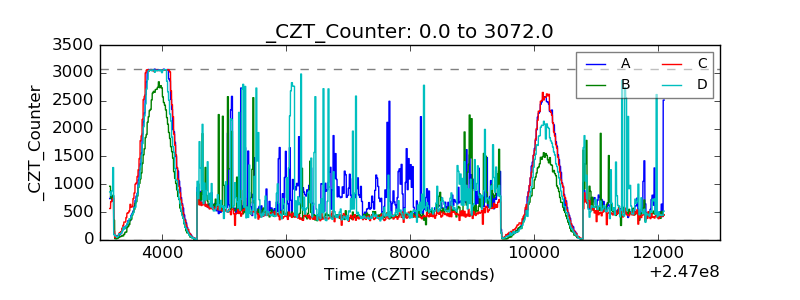 |
| +2.5 Volts monitor | 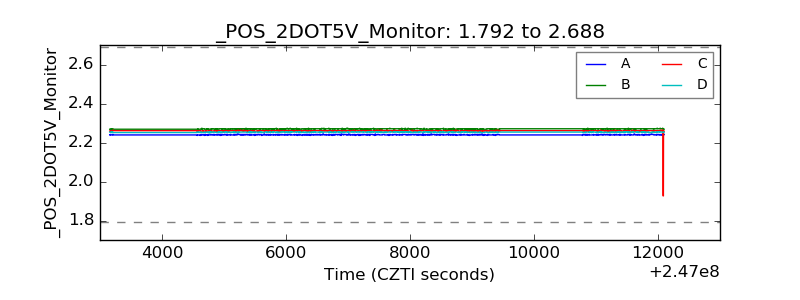 |
| +5 Volts monitor |  |
| _ROLL_ROT | 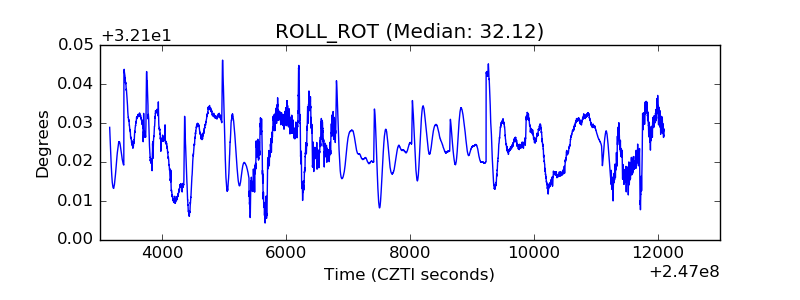 |
| _Roll_DEC | 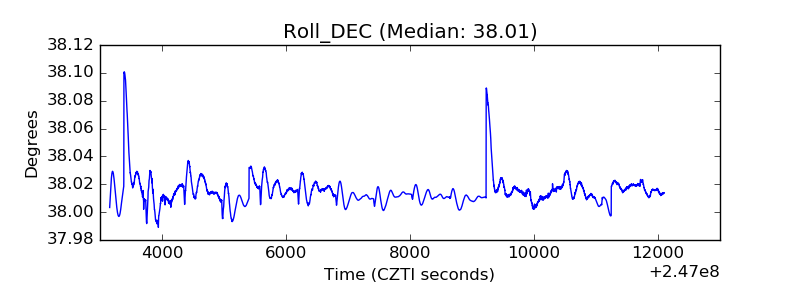 |
| _Roll_RA | 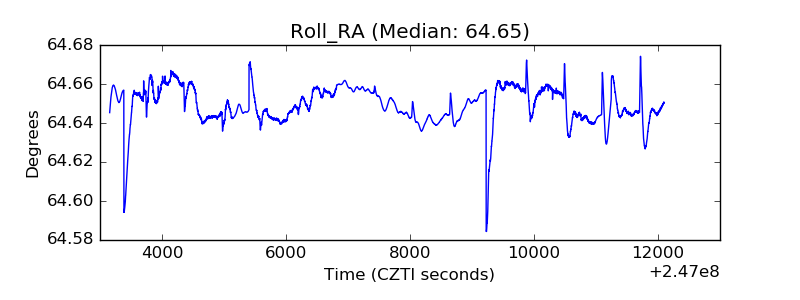 |
| Veto Counter | 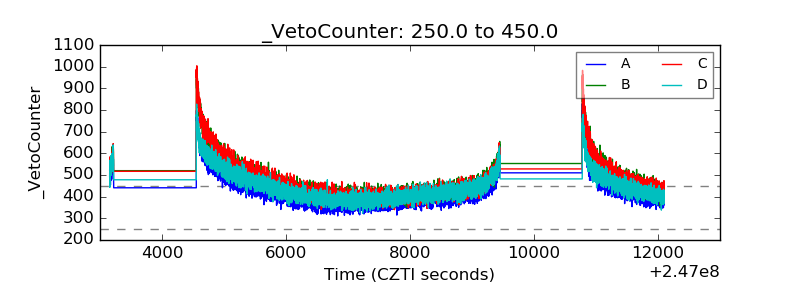 |