| Param | Original file | Final file |
|---|---|---|
| Filename | modeM0/AS1A04_144T01_9000001652_11292cztM0_level2.evt | modeM0/AS1A04_144T01_9000001652_11292cztM0_level2_quad_clean.evt |
| Size (bytes) | 648,227,520 | 96,382,080 |
| Size | 618.2 MB | 91.9 MB |
| Events in quadrant A | 6,338,299 | 584,124 |
| Events in quadrant B | 4,014,035 | 639,286 |
| Events in quadrant C | 3,332,522 | 624,400 |
| Events in quadrant D | 5,454,344 | 564,382 |
| Mode SS | |||
|---|---|---|---|
| Quadrant | BADHDUFLAG | Total packets | Discarded packets |
| A | 0 | 148 | 0 |
| B | 0 | 148 | 0 |
| C | 0 | 148 | 0 |
| D | 0 | 148 | 0 |
| Mode M0 | |||
|---|---|---|---|
| Quadrant | BADHDUFLAG | Total packets | Discarded packets |
| A | 0 | 23799 | 3 |
| B | 0 | 16885 | 2 |
| C | 0 | 15151 | 2 |
| D | 0 | 21427 | 2 |
| Mode M9 | |||
|---|---|---|---|
| Quadrant | BADHDUFLAG | Total packets | Discarded packets |
| A | 0 | 20 | 0 |
| B | 0 | 20 | 0 |
| C | 0 | 20 | 0 |
| D | 0 | 20 | 0 |
| Quadrant | Total seconds | Saturated seconds | Saturation percentage |
|---|---|---|---|
| A | 7274 | 923 | 12.689029% |
| B | 7274 | 259 | 3.560627% |
| C | 7274 | 58 | 0.797360% |
| D | 7274 | 511 | 7.025021% |
Noise dominated data is calculated using 1-second bins in cleaned event files. If a bin has >2000 counts, and if more than 50% of those come from <1% of pixels, then it is considered to be noise-dominated and hence unusable.
| Quadrant | # 1 sec bins | Bins with >0 counts | Bins with >2000 counts | High rate bins dominated by noise | Noise dominated (total time) | Noise dominated (detector-on time) | Marked lightcurve |
|---|---|---|---|---|---|---|---|
| A | 9224 | 7276 | 606 | 606 | 6.57% | 8.33% | 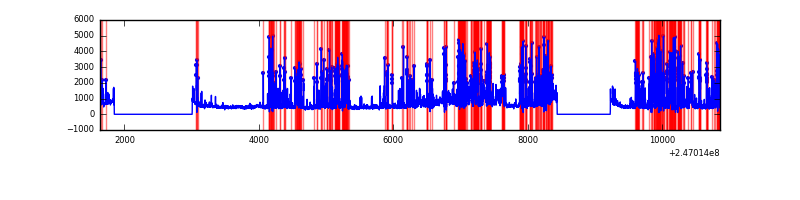 |
| B | 9224 | 7276 | 64 | 64 | 0.69% | 0.88% | 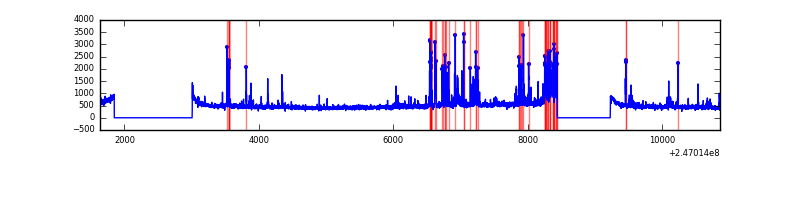 |
| C | 9224 | 7276 | 0 | 0 | 0.00% | 0.00% | 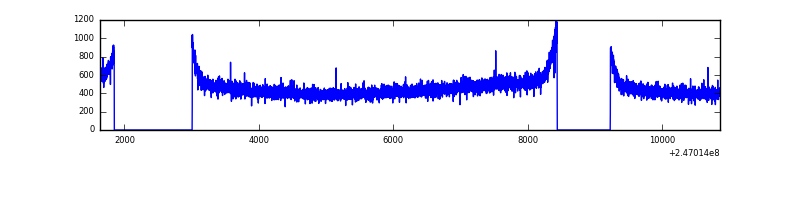 |
| D | 9224 | 7276 | 363 | 363 | 3.94% | 4.99% | 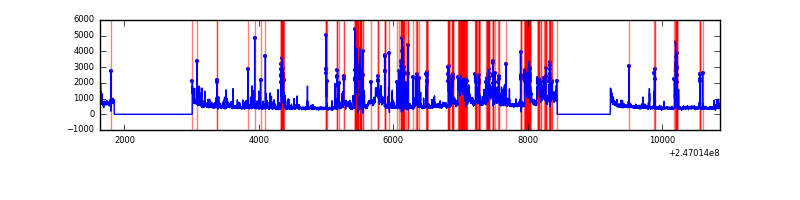 |
Top three noisy pixels from each quadrant. If the there are fewer than three noisy pixels in the level2.evt file, extra rows are filled as -1
| Pixel properties | Quadrant properties | ||||||
|---|---|---|---|---|---|---|---|
| Quadrant | DetID | PixID | Counts | Sigma | Mean | Median | Sigma |
| A | 8 | 5 | 2990886 | 17637.09 | 827 | 811 | 169.5 |
| A | 14 | 238 | 106036 | 620.67 | 827 | 811 | 169.5 |
| A | 8 | 15 | 37538 | 216.64 | 827 | 811 | 169.5 |
| B | 4 | 239 | 508507 | 3000.04 | 875 | 855 | 169.2 |
| B | 15 | 204 | 36908 | 213.06 | 875 | 855 | 169.2 |
| B | 0 | 214 | 21782 | 123.67 | 875 | 855 | 169.2 |
| C | 13 | 61 | 6519 | 28.57 | 854 | 857 | 198.2 |
| C | 14 | 234 | 2211 | 6.83 | 854 | 857 | 198.2 |
| C | 3 | 202 | 2111 | 6.33 | 854 | 857 | 198.2 |
| D | 12 | 157 | 689158 | 3541.05 | 815 | 792 | 194.4 |
| D | 1 | 52 | 638519 | 3280.55 | 815 | 792 | 194.4 |
| D | 10 | 253 | 385397 | 1978.46 | 815 | 792 | 194.4 |
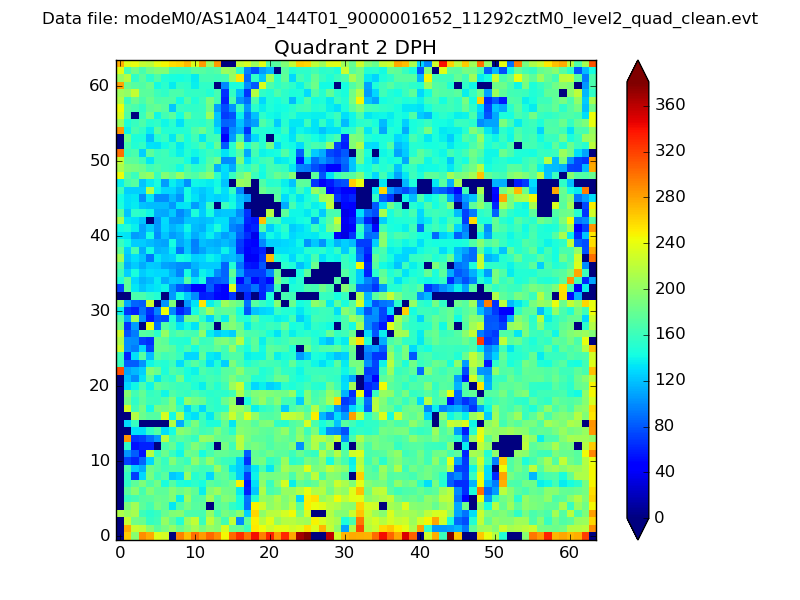
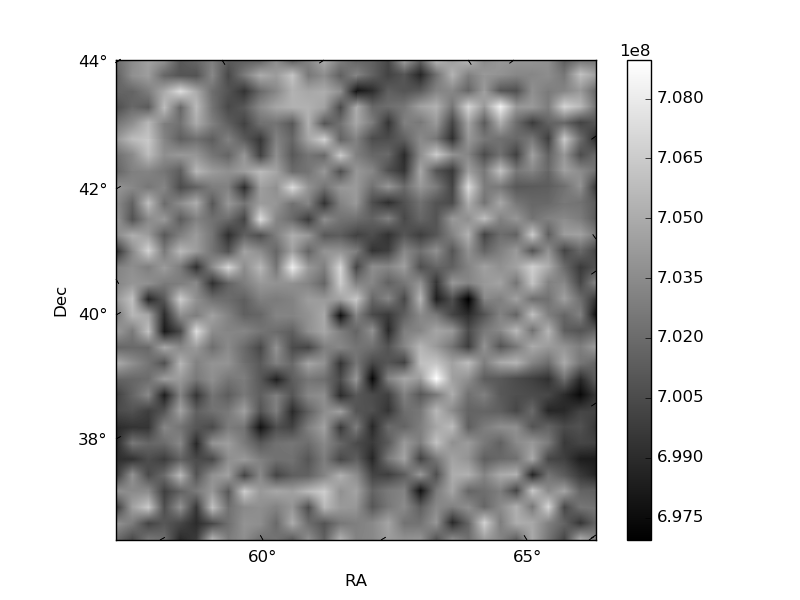
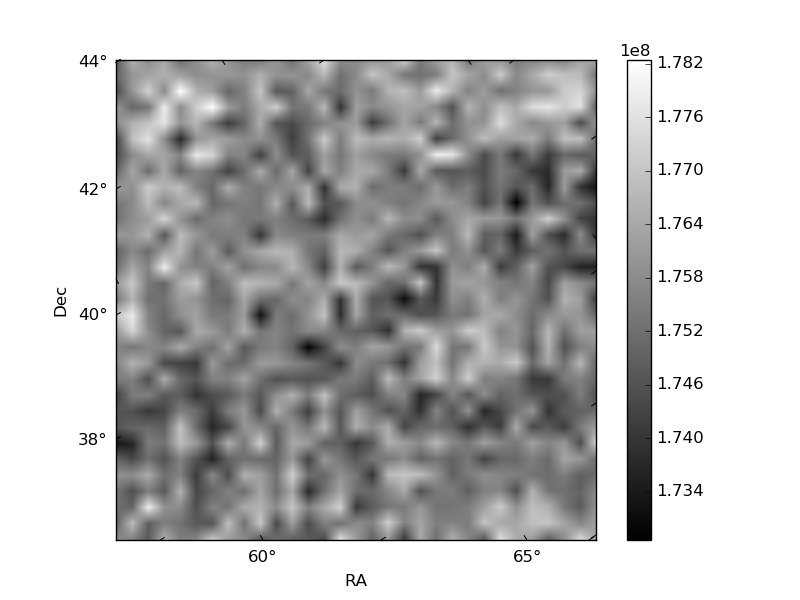
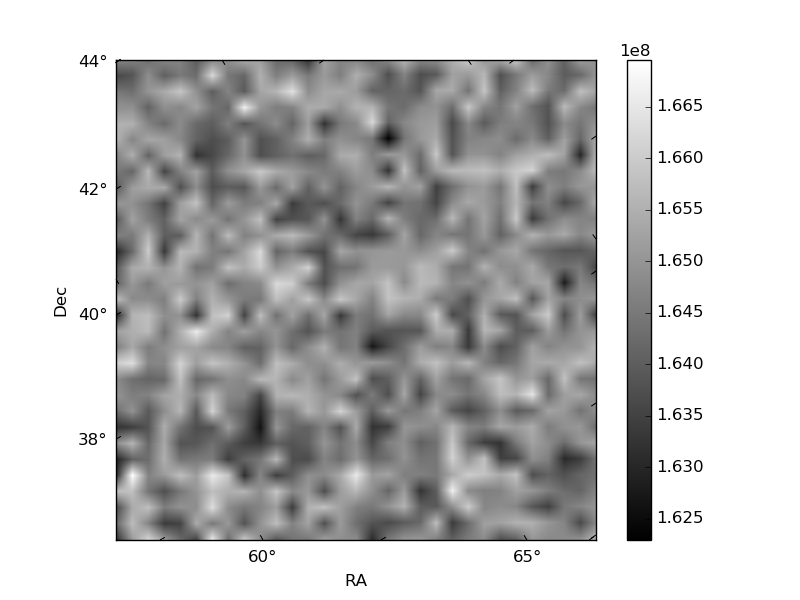
Histogram calculated using DETX and DETY for each event in the final _common_clean file
| Quadrant A | 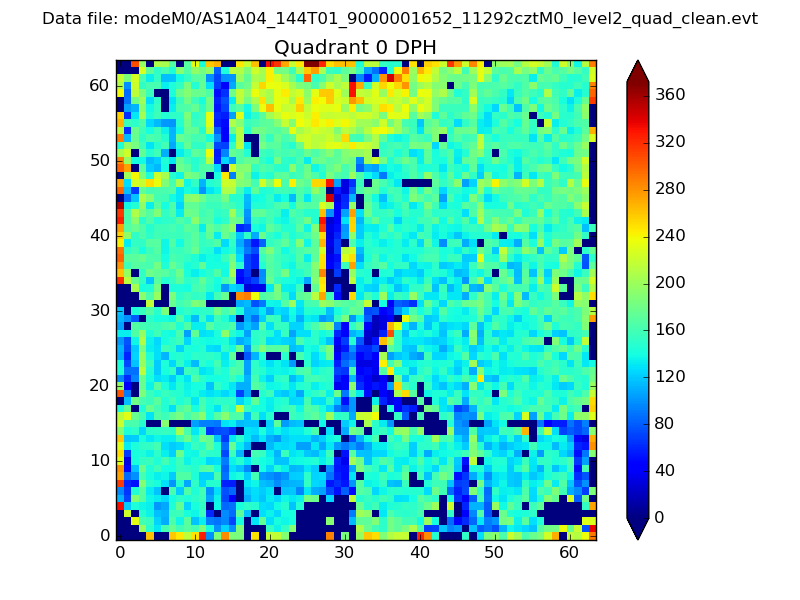 |
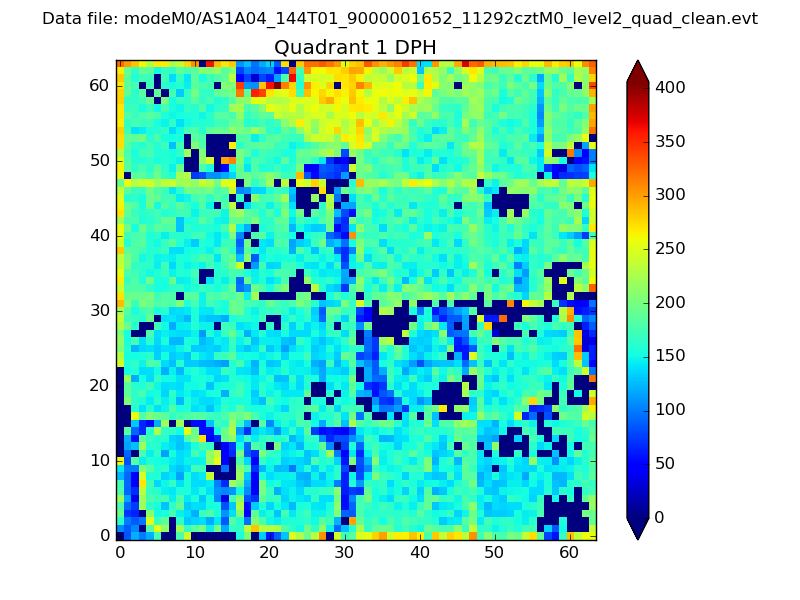 |
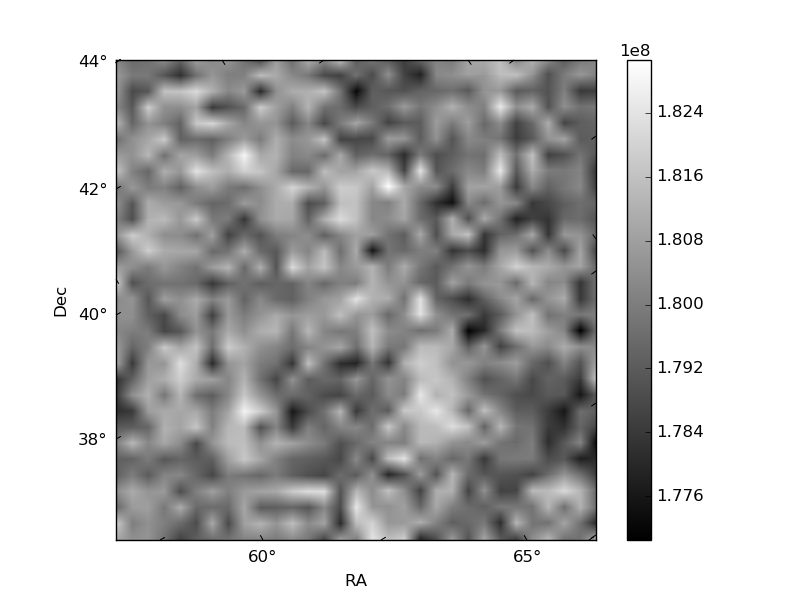
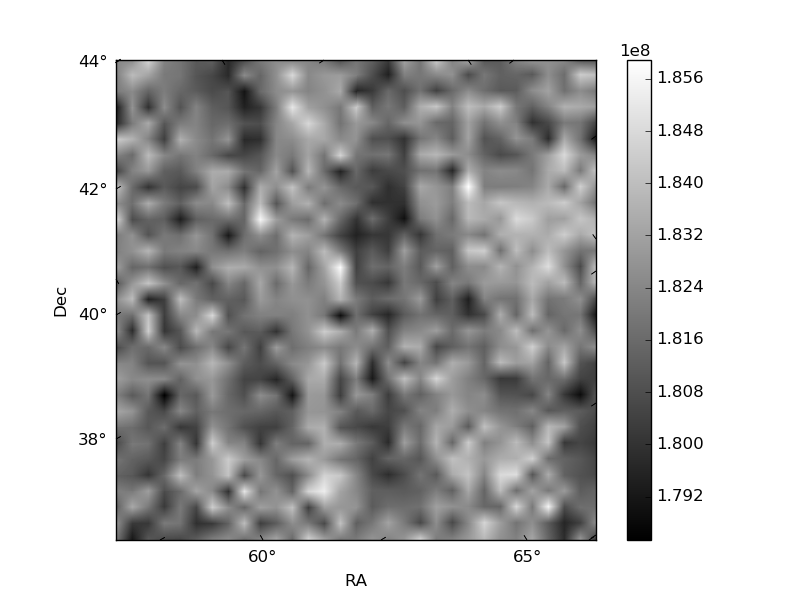
Quadrant B |
|---|---|---|---|
| Quadrant D | 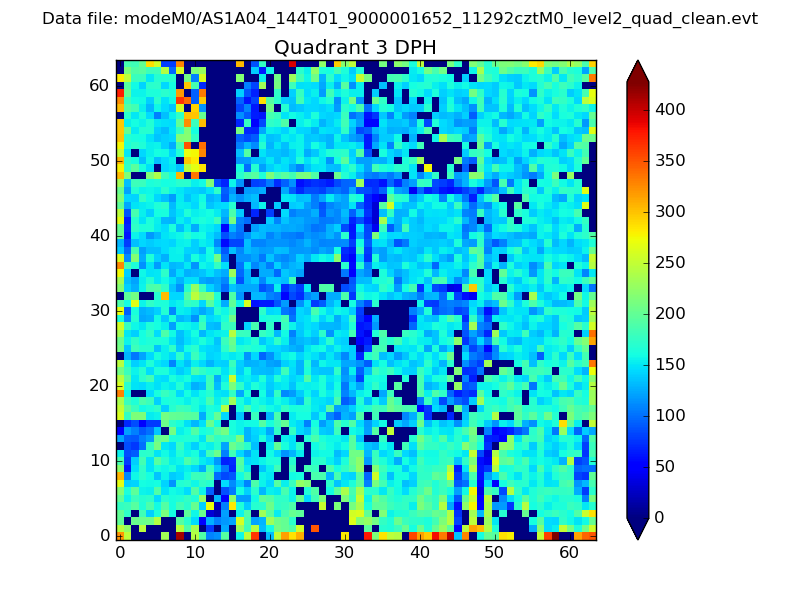 |
 |
Quadrant C |
| Plot type | Count rate plots | Images |
|---|---|---|
| Comparison with Poisson distribution Blue bars denote a histogram of data divided into 1 sec bins. Red curve is a Poisson curve with rate = median count rate of data. |
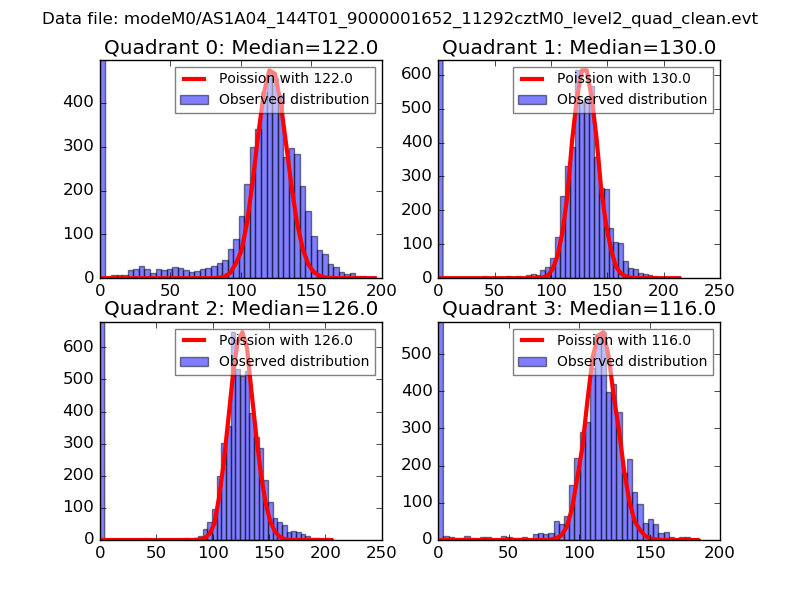 |
 |
| Quadrant-wise count rates Data is divided into 100 sec bins |
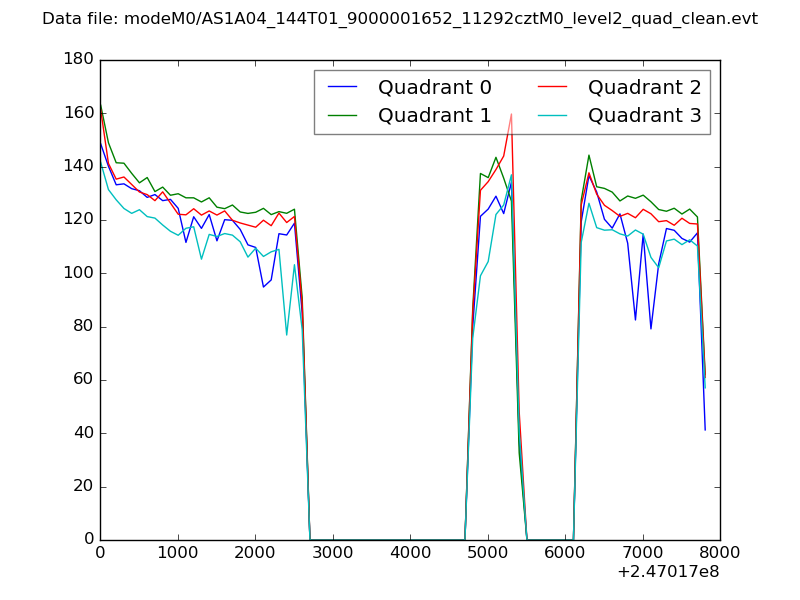 |
|
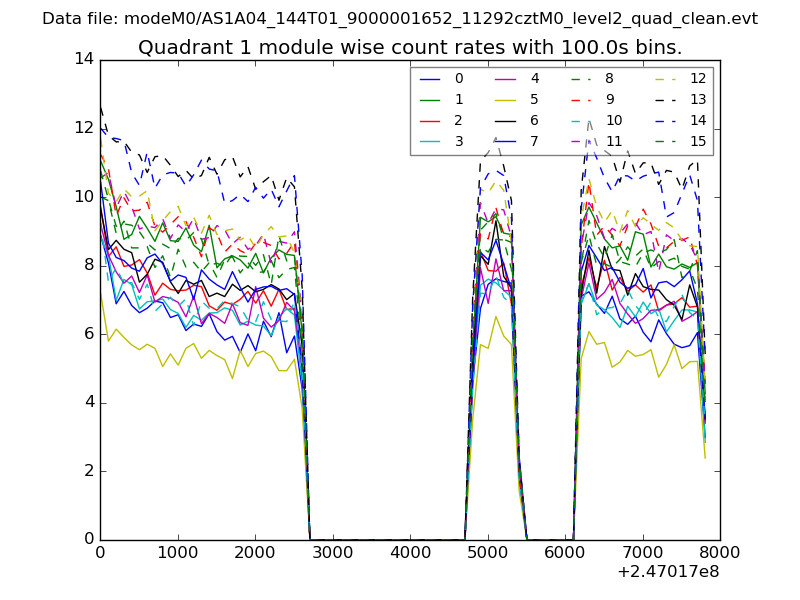
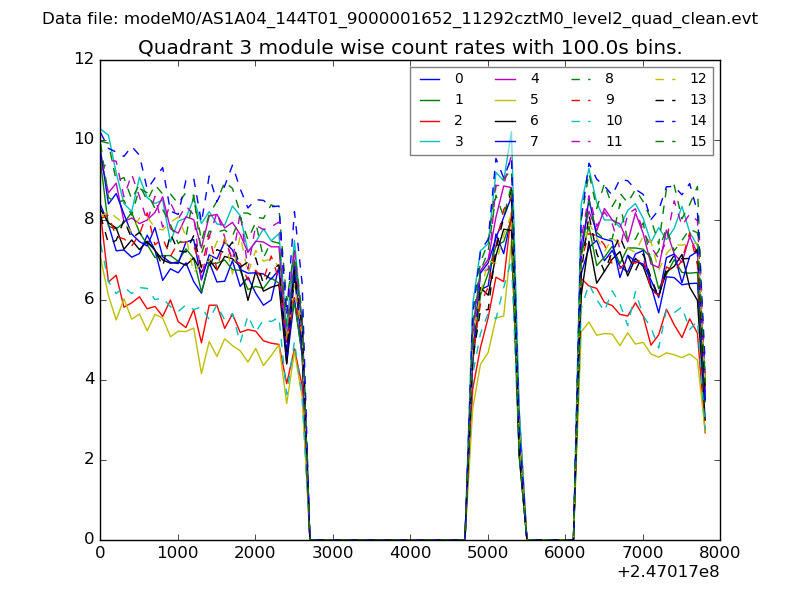
| Module-wise count rates for Quadrant A Data is divided into 100 sec bins |
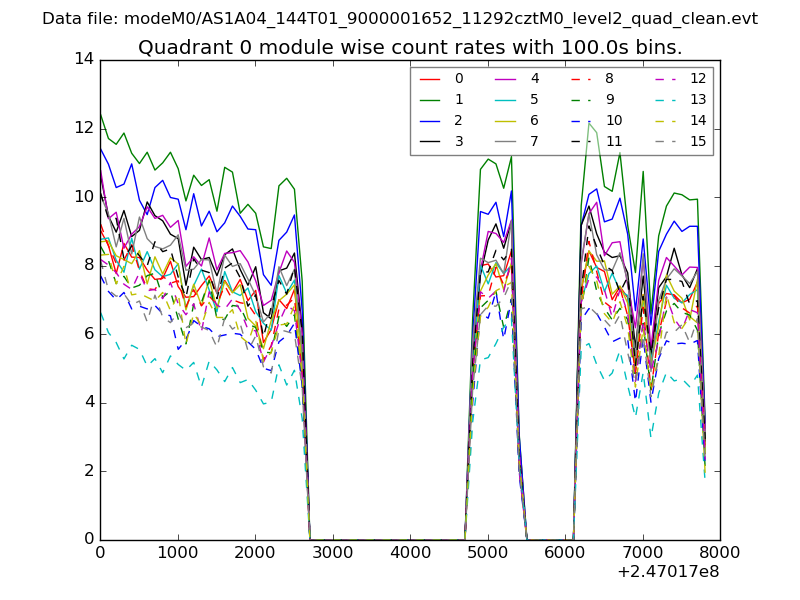 |
 |
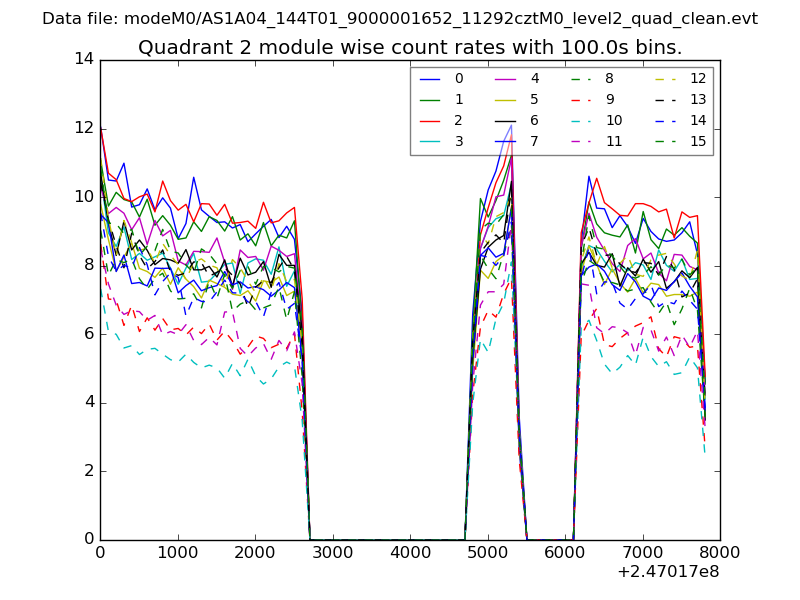
| Module-wise count rates for Quadrant B Data is divided into 100 sec bins |
 |
 |
| Module-wise count rates for Quadrant C Data is divided into 100 sec bins |
 |
 |
| Module-wise count rates for Quadrant D Data is divided into 100 sec bins |
 |
 |
| Parameter | Plot |
|---|---|
| CZT HV Monitor | 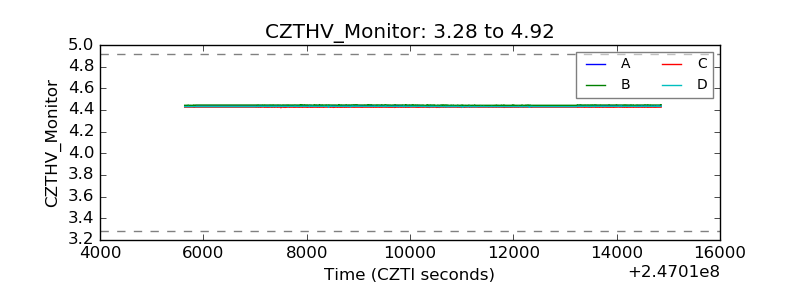 |
| D_VDD | 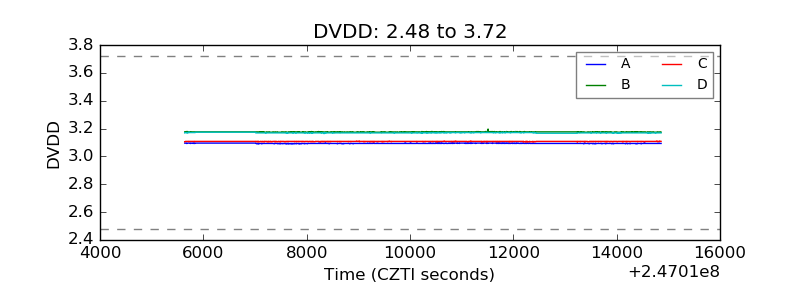 |
| Temperature 1 | 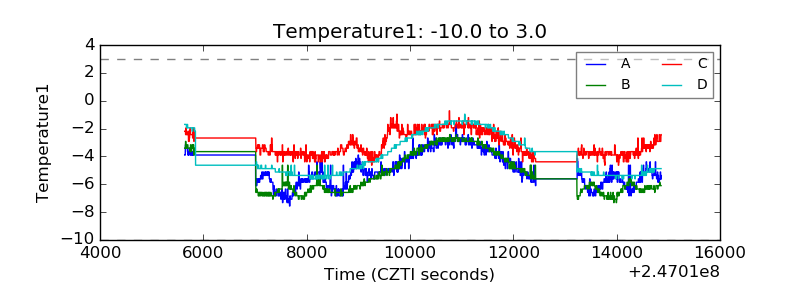 |
| Veto HV Monitor | 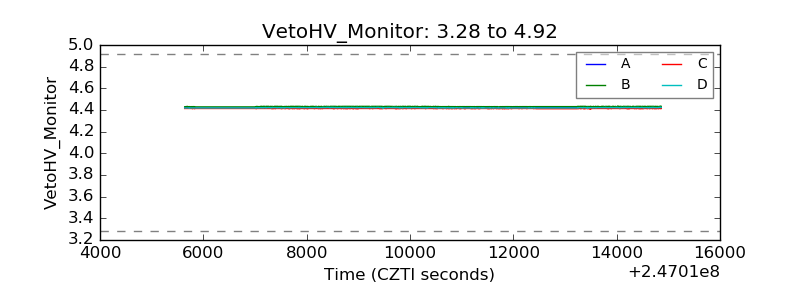 |
| Veto LLD | 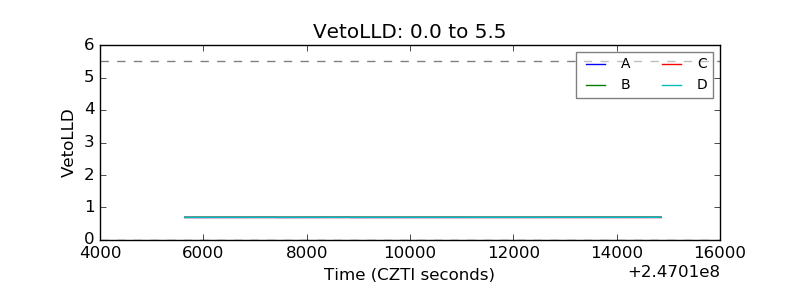 |
| Alpha Counter | 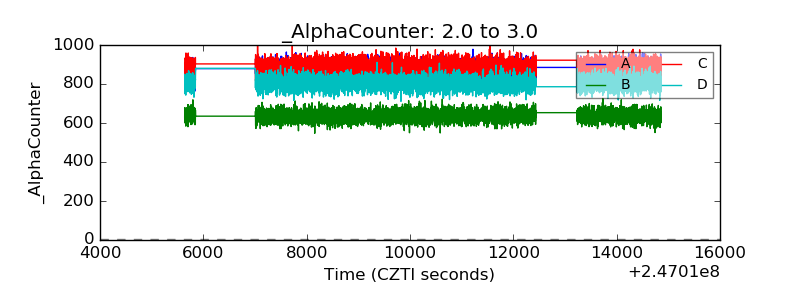 |
| _CPM_Rate | 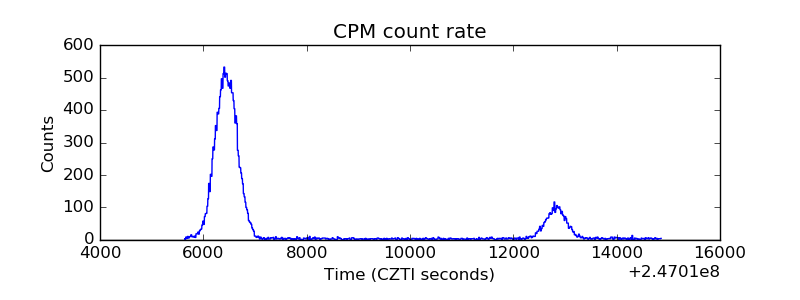 |
| CZT Counter | 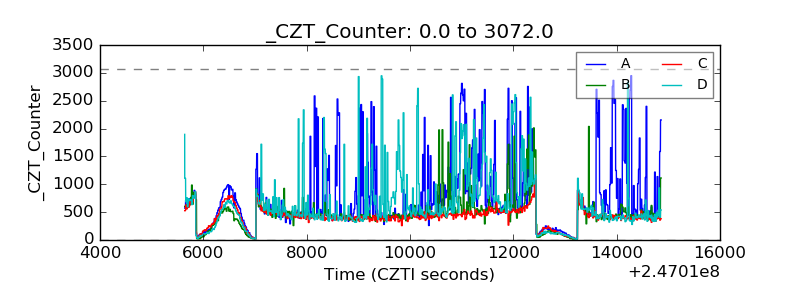 |
| +2.5 Volts monitor |  |
| +5 Volts monitor |  |
| _ROLL_ROT | 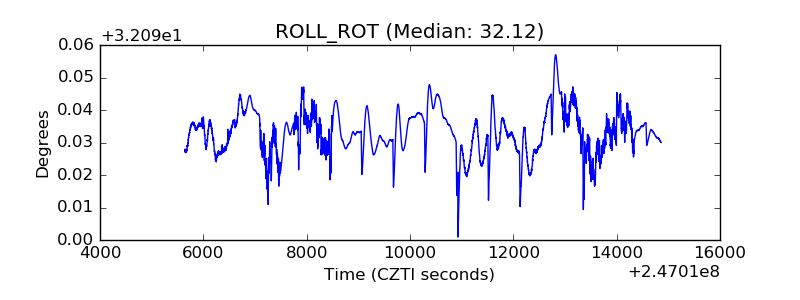 |
| _Roll_DEC | 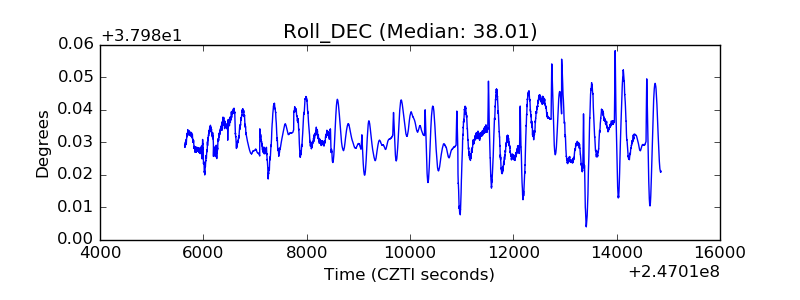 |
| _Roll_RA | 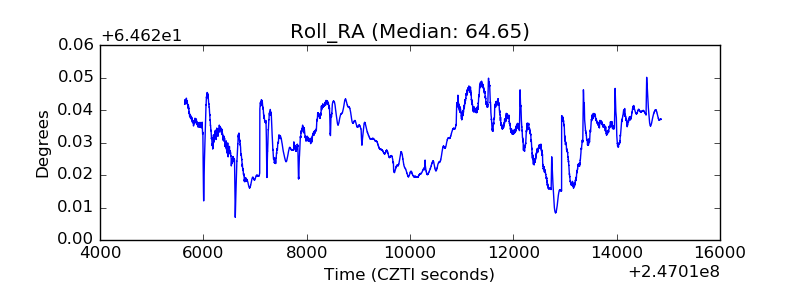 |
| Veto Counter | 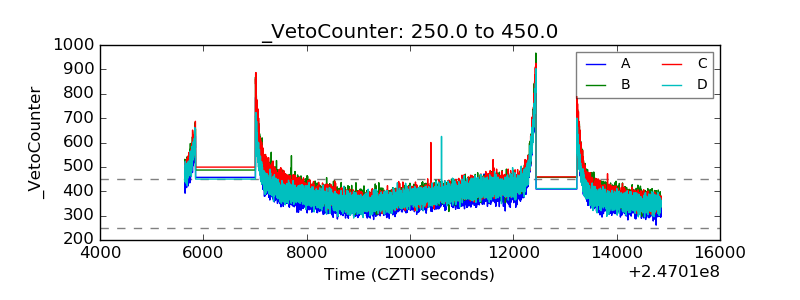 |