| Param | Original file | Final file |
|---|---|---|
| Filename | modeM0/AS1A04_144T01_9000001652_11293cztM0_level2.evt | modeM0/AS1A04_144T01_9000001652_11293cztM0_level2_quad_clean.evt |
| Size (bytes) | 190,984,320 | 16,623,360 |
| Size | 182.1 MB | 15.9 MB |
| Events in quadrant A | 1,669,030 | 76,466 |
| Events in quadrant B | 1,222,714 | 92,360 |
| Events in quadrant C | 1,007,627 | 90,548 |
| Events in quadrant D | 1,722,092 | 73,826 |
| Mode SS | |||
|---|---|---|---|
| Quadrant | BADHDUFLAG | Total packets | Discarded packets |
| A | 0 | 113 | 65 |
| B | 0 | 113 | 61 |
| C | 0 | 118 | 72 |
| D | 0 | 120 | 69 |
| Mode M0 | |||
|---|---|---|---|
| Quadrant | BADHDUFLAG | Total packets | Discarded packets |
| A | 0 | 18346 | 11886 |
| B | 0 | 13430 | 8161 |
| C | 0 | 11634 | 6757 |
| D | 0 | 17005 | 10235 |
| Mode M9 | |||
|---|---|---|---|
| Quadrant | BADHDUFLAG | Total packets | Discarded packets |
| A | 0 | 5 | 5 |
| B | 0 | 4 | 4 |
| C | 0 | 6 | 6 |
| D | 0 | 7 | 7 |
| Quadrant | Total seconds | Saturated seconds | Saturation percentage |
|---|---|---|---|
| A | 2252 | 191 | 8.481350% |
| B | 2399 | 14 | 0.583576% |
| C | 2439 | 0 | 0.000000% |
| D | 2265 | 166 | 7.328918% |
Noise dominated data is calculated using 1-second bins in cleaned event files. If a bin has >2000 counts, and if more than 50% of those come from <1% of pixels, then it is considered to be noise-dominated and hence unusable.
| Quadrant | # 1 sec bins | Bins with >0 counts | Bins with >2000 counts | High rate bins dominated by noise | Noise dominated (total time) | Noise dominated (detector-on time) | Marked lightcurve |
|---|---|---|---|---|---|---|---|
| A | 3345 | 2733 | 121 | 121 | 3.62% | 4.43% | 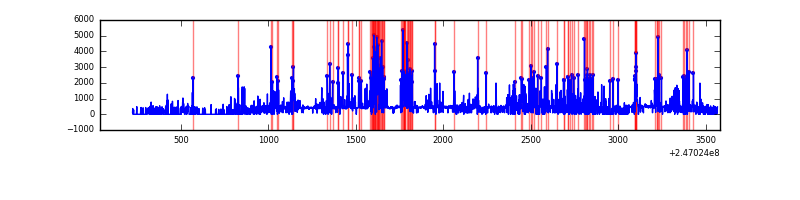 |
| B | 3430 | 2894 | 7 | 7 | 0.20% | 0.24% | 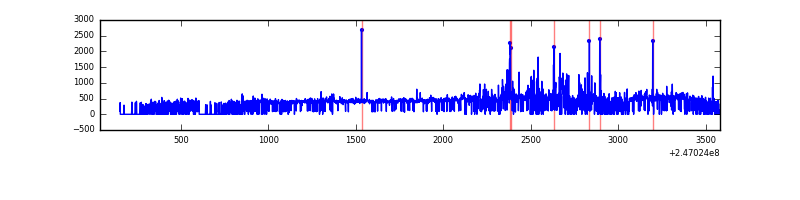 |
| C | 3517 | 2902 | 0 | 0 | 0.00% | 0.00% | 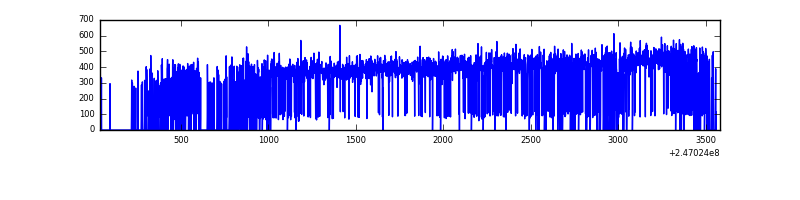 |
| D | 3538 | 2761 | 133 | 133 | 3.76% | 4.82% | 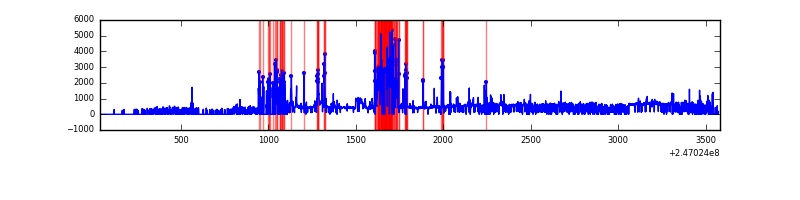 |
Top three noisy pixels from each quadrant. If the there are fewer than three noisy pixels in the level2.evt file, extra rows are filled as -1
| Pixel properties | Quadrant properties | ||||||
|---|---|---|---|---|---|---|---|
| Quadrant | DetID | PixID | Counts | Sigma | Mean | Median | Sigma |
| A | 8 | 5 | 712358 | 13889.24 | 240 | 234 | 51.3 |
| A | 14 | 238 | 22374 | 431.81 | 240 | 234 | 51.3 |
| A | 1 | 162 | 4153 | 76.43 | 240 | 234 | 51.3 |
| B | 4 | 239 | 88073 | 1679.51 | 264 | 258 | 52.3 |
| B | 4 | 81 | 74625 | 1422.31 | 264 | 258 | 52.3 |
| B | 15 | 204 | 12391 | 232.05 | 264 | 258 | 52.3 |
| C | 13 | 61 | 1987 | 28.21 | 258 | 259 | 61.3 |
| C | 8 | 222 | 1075 | 13.32 | 258 | 259 | 61.3 |
| C | 3 | 202 | 644 | 6.28 | 258 | 259 | 61.3 |
| D | 10 | 253 | 504981 | 8902.06 | 229 | 222 | 56.7 |
| D | 8 | 195 | 223099 | 3930.72 | 229 | 222 | 56.7 |
| D | 2 | 120 | 48729 | 855.48 | 229 | 222 | 56.7 |
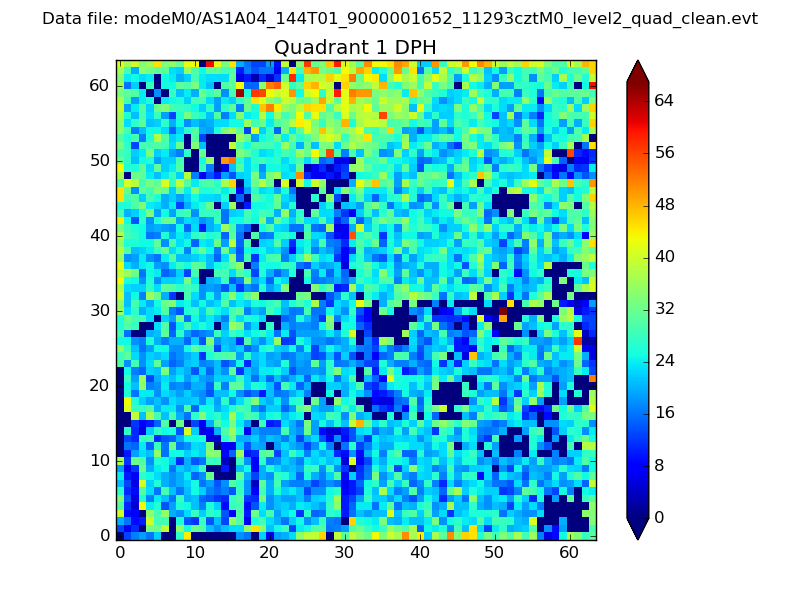
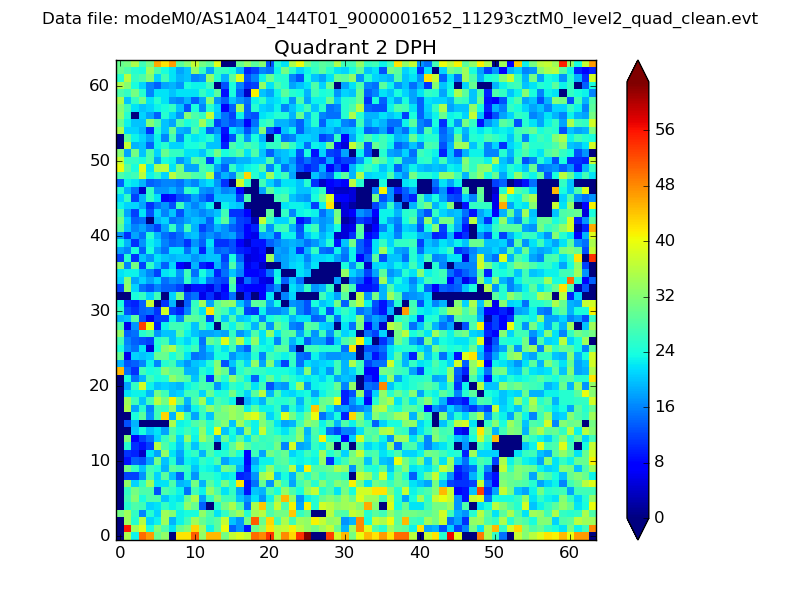
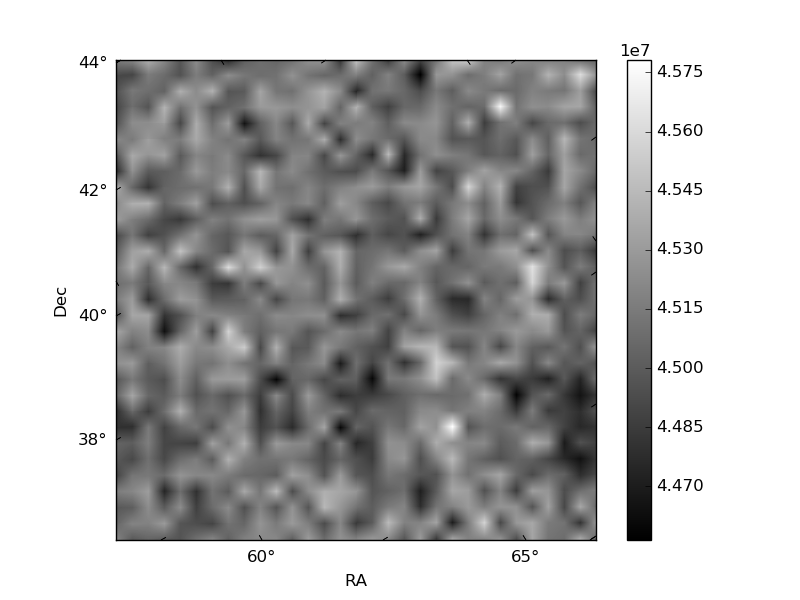
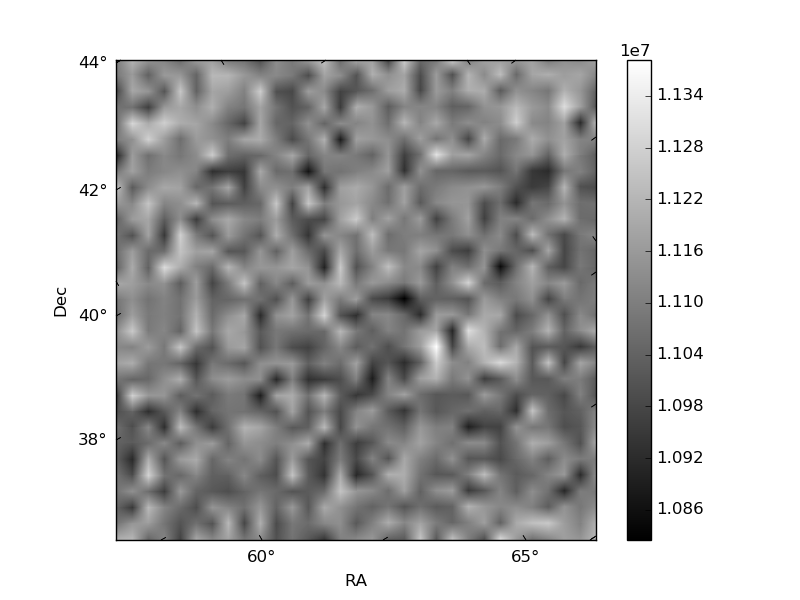
Histogram calculated using DETX and DETY for each event in the final _common_clean file
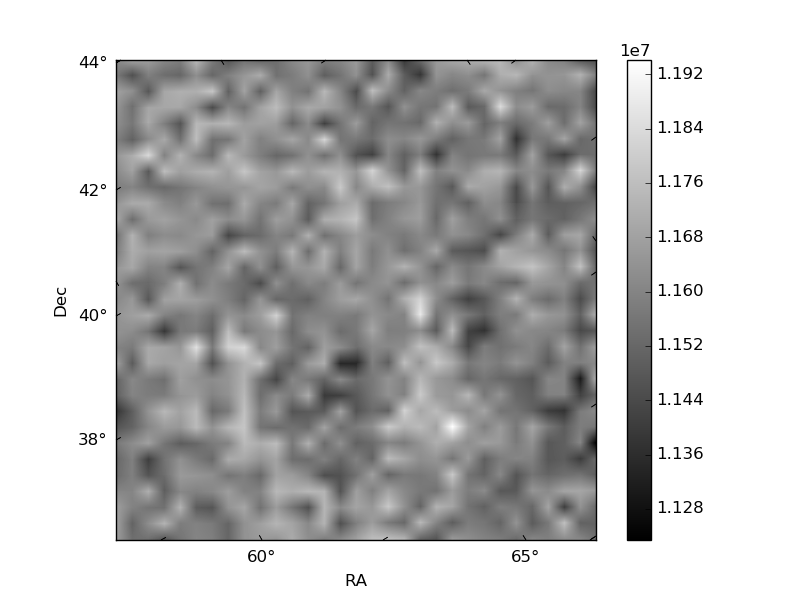
| Quadrant A |  |
 |
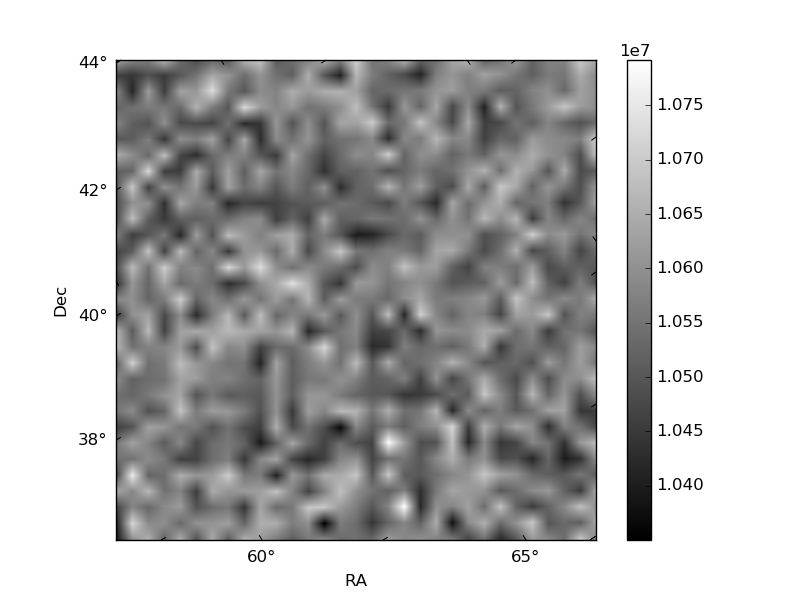
Quadrant B |
|---|---|---|---|
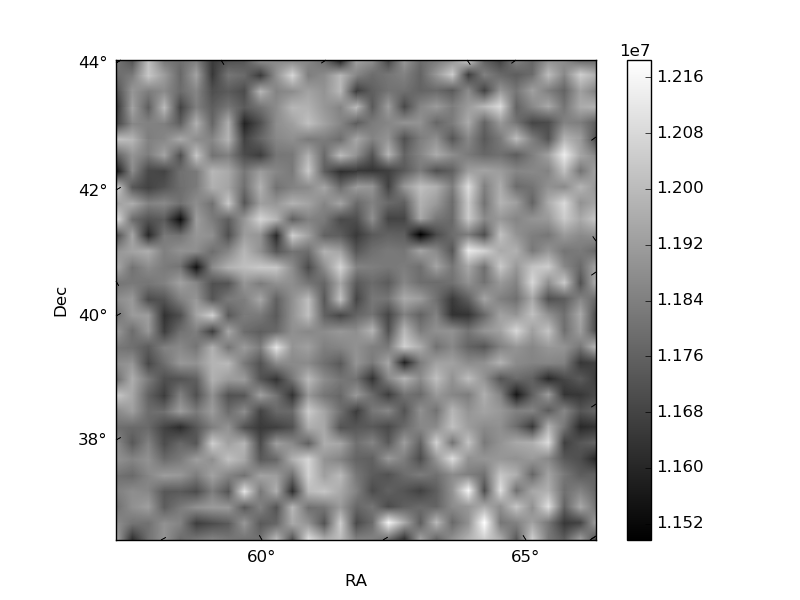
| Quadrant D | 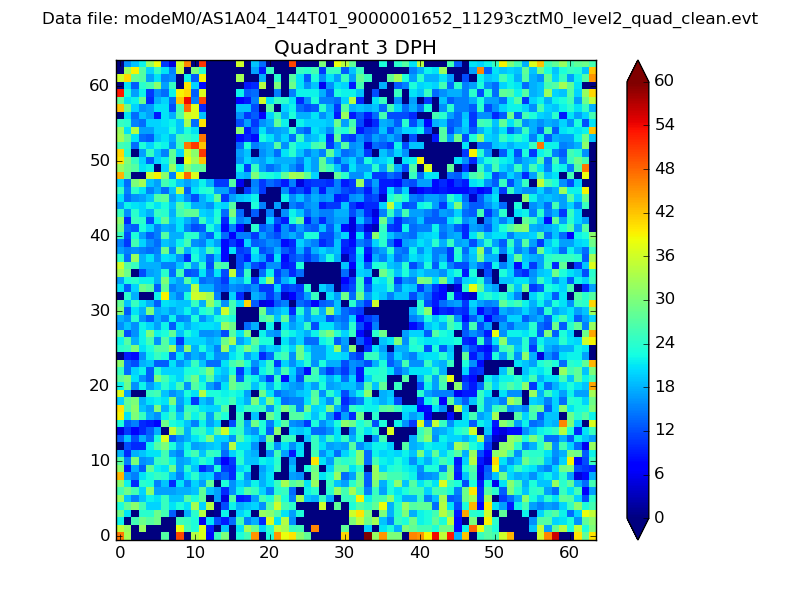 |
 |
Quadrant C |
| Plot type | Count rate plots | Images |
|---|---|---|
| Comparison with Poisson distribution Blue bars denote a histogram of data divided into 1 sec bins. Red curve is a Poisson curve with rate = median count rate of data. |
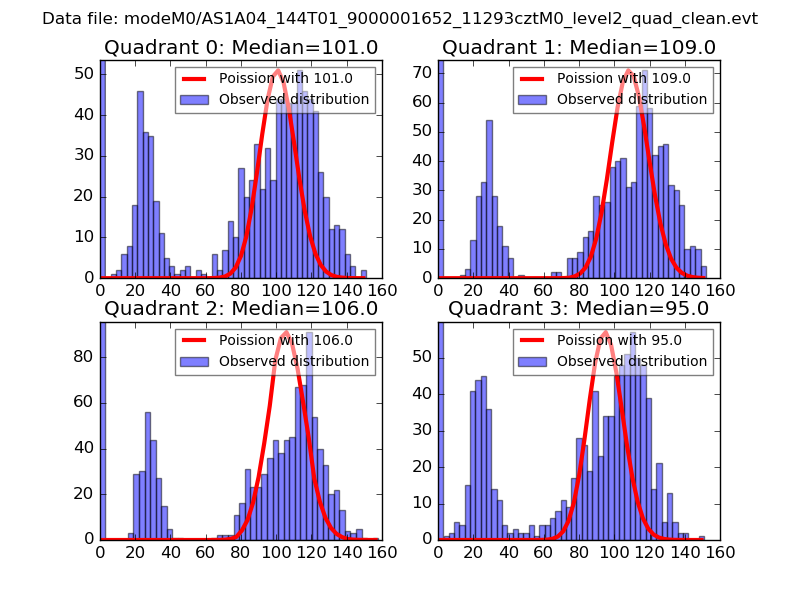 |
 |
| Quadrant-wise count rates Data is divided into 100 sec bins |
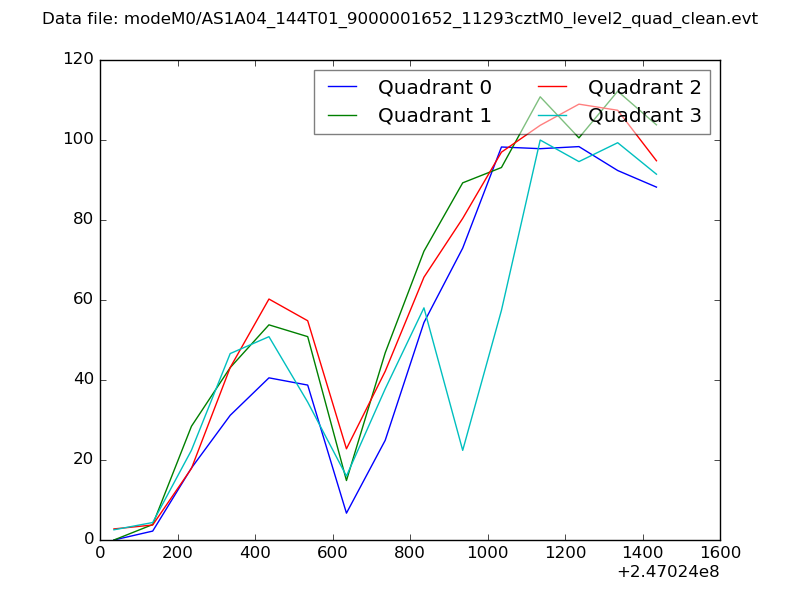 |
|
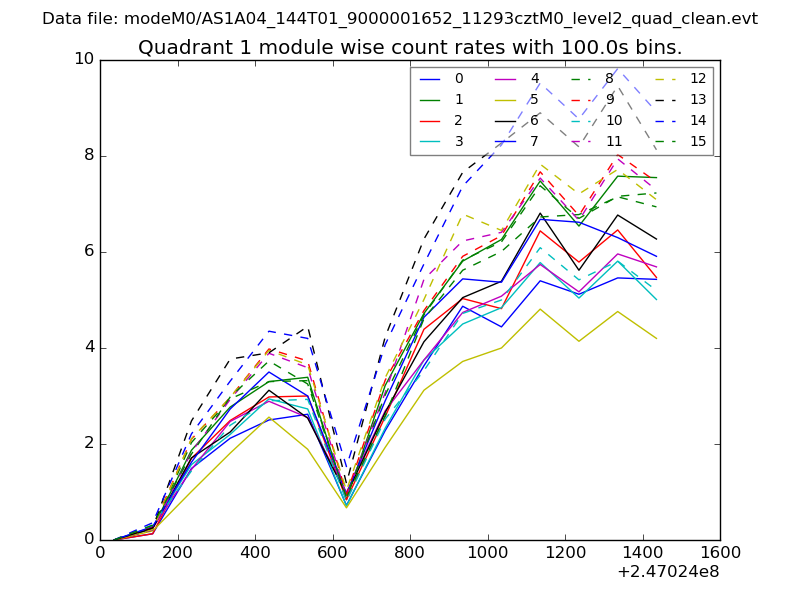
| Module-wise count rates for Quadrant A Data is divided into 100 sec bins |
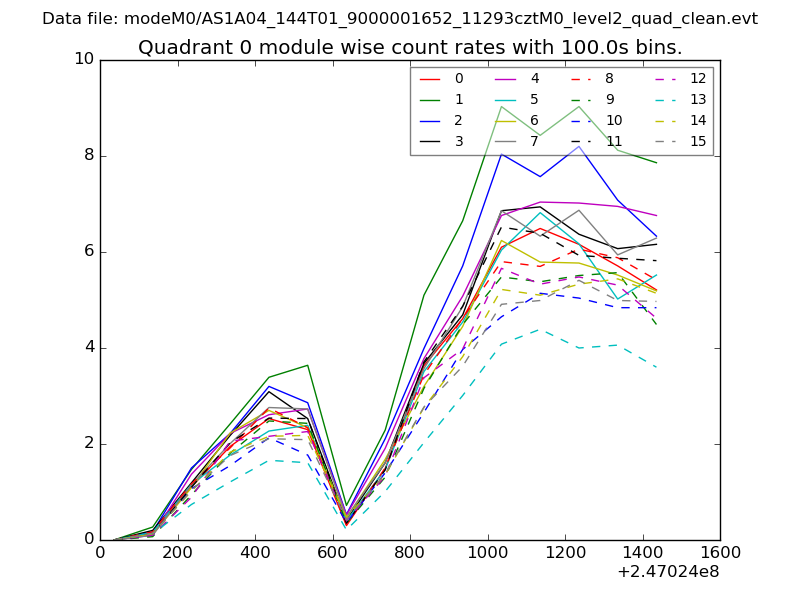 |
 |
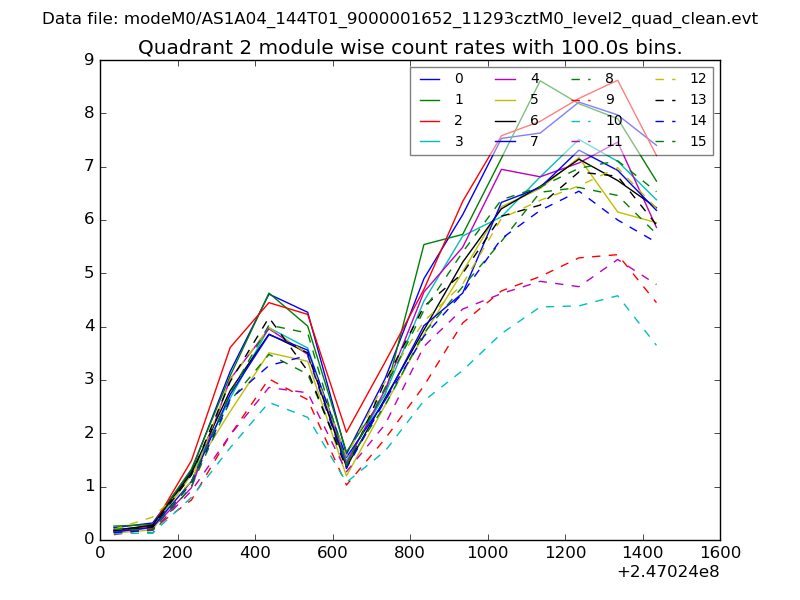
| Module-wise count rates for Quadrant B Data is divided into 100 sec bins |
 |
 |
| Module-wise count rates for Quadrant C Data is divided into 100 sec bins |
 |
 |
| Module-wise count rates for Quadrant D Data is divided into 100 sec bins |
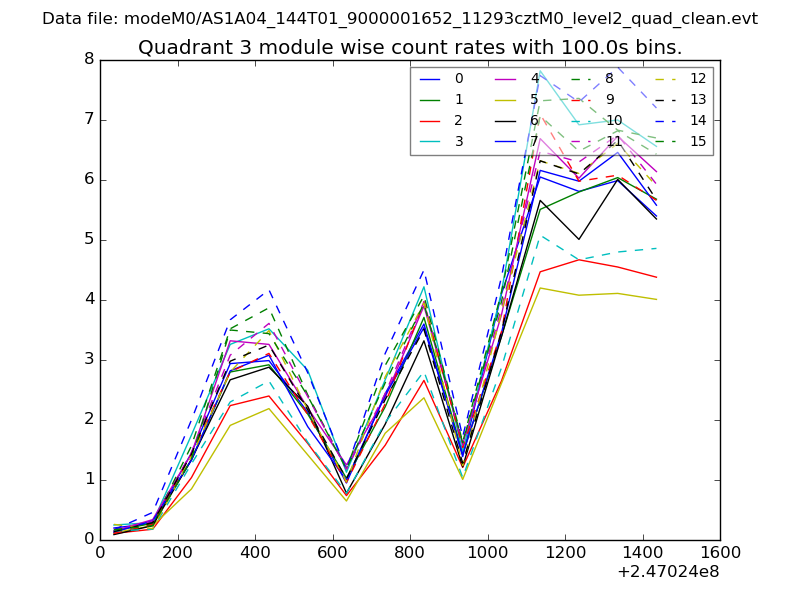 |
 |
| Parameter | Plot |
|---|---|
| CZT HV Monitor | 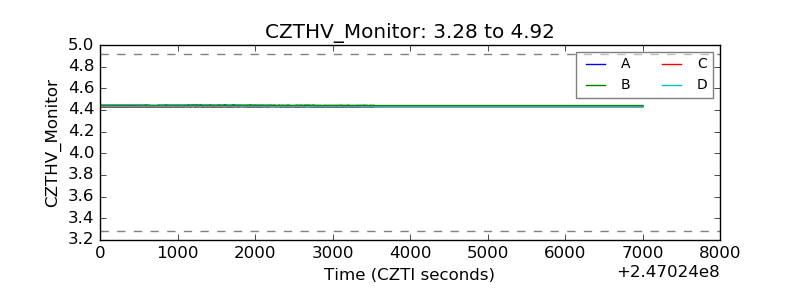 |
| D_VDD | 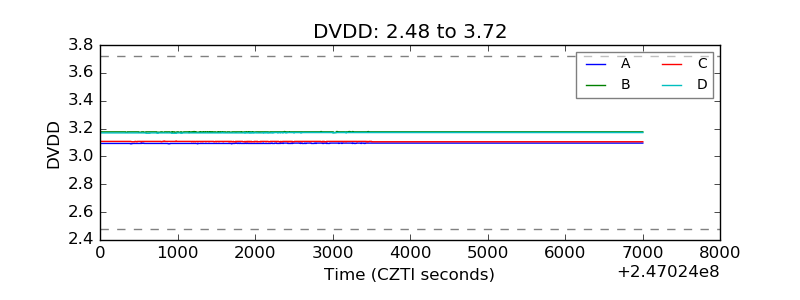 |
| Temperature 1 | 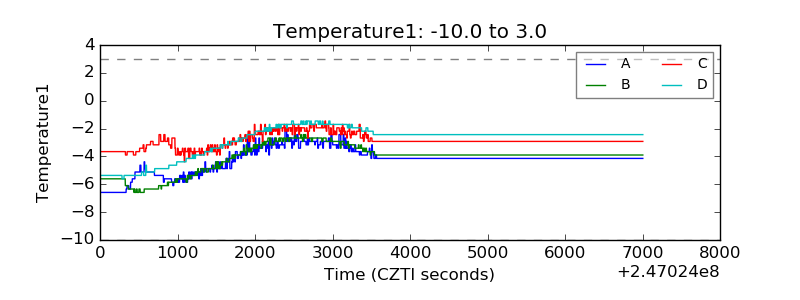 |
| Veto HV Monitor | 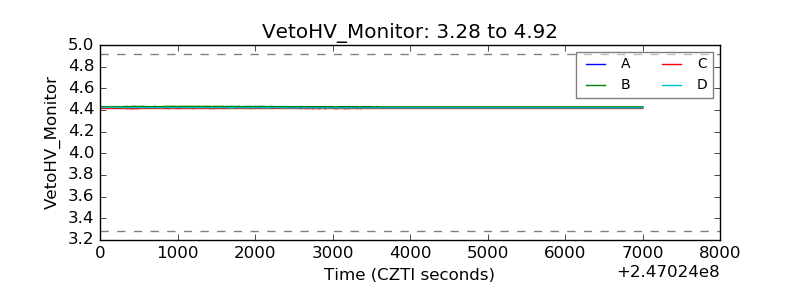 |
| Veto LLD | 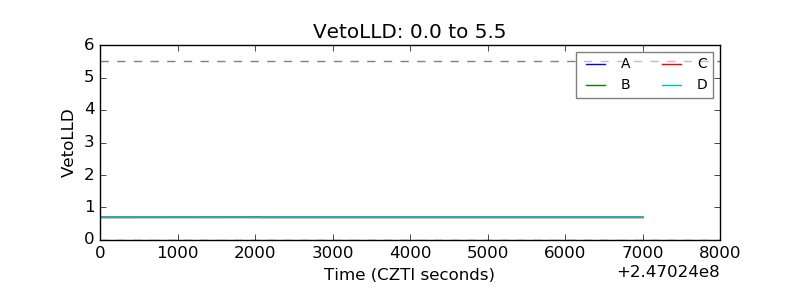 |
| Alpha Counter | 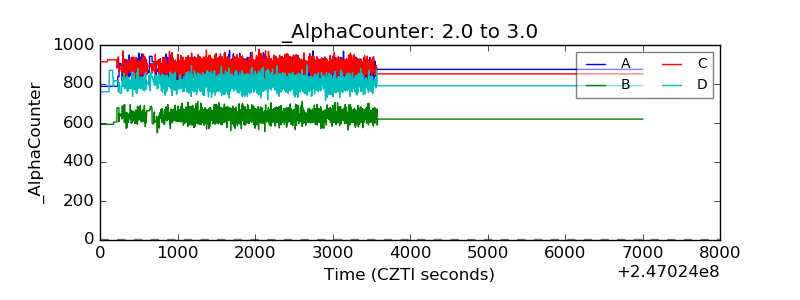 |
| _CPM_Rate | 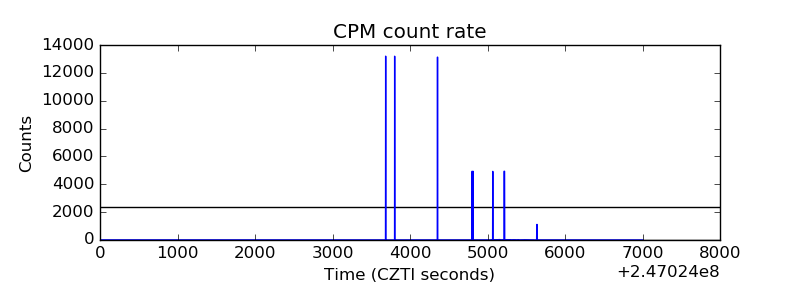 |
| CZT Counter | 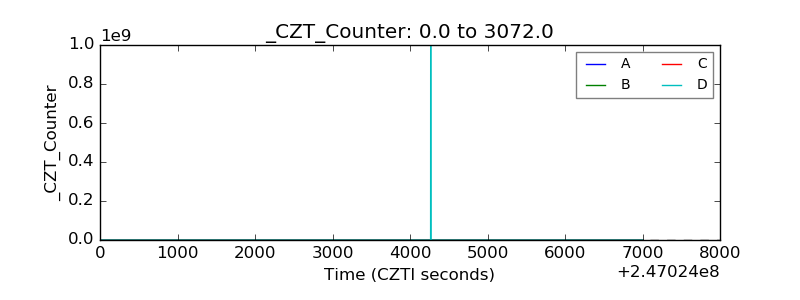 |
| +2.5 Volts monitor |  |
| +5 Volts monitor |  |
| _ROLL_ROT | 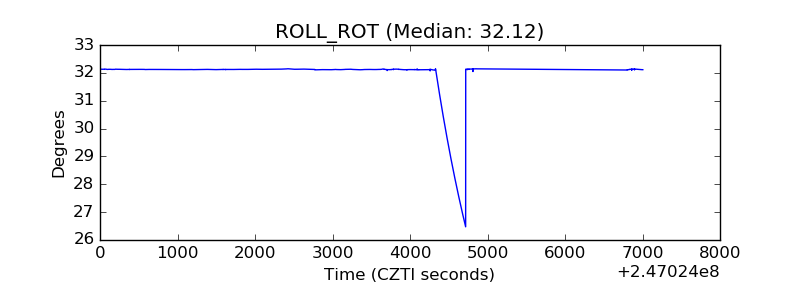 |
| _Roll_DEC | 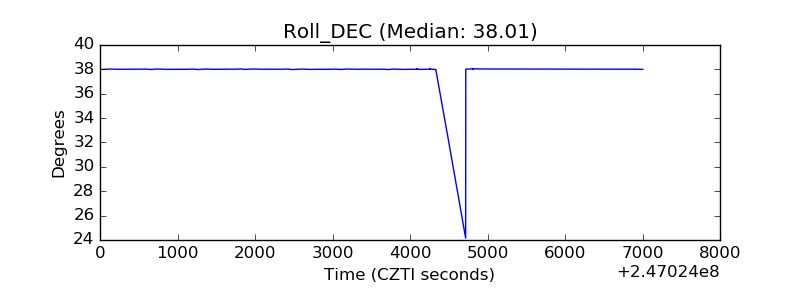 |
| _Roll_RA | 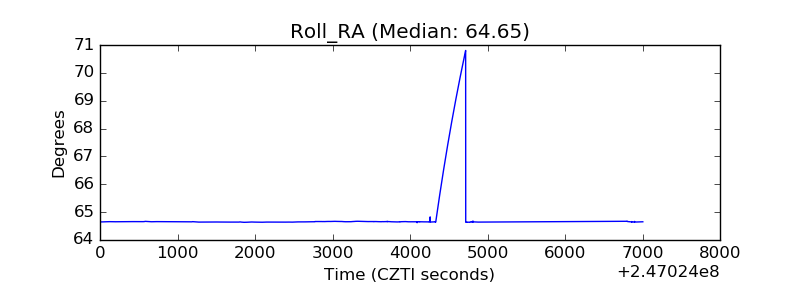 |
| Veto Counter | 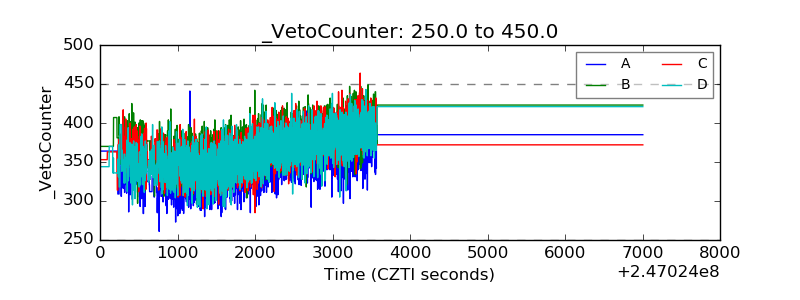 |