| Param | Original file | Final file |
|---|---|---|
| Filename | modeM0/AS1A04_144T01_9000001652_11295cztM0_level2.evt | modeM0/AS1A04_144T01_9000001652_11295cztM0_level2_quad_clean.evt |
| Size (bytes) | 779,641,920 | 96,353,280 |
| Size | 743.5 MB | 91.9 MB |
| Events in quadrant A | 7,700,693 | 583,826 |
| Events in quadrant B | 4,698,753 | 633,257 |
| Events in quadrant C | 4,018,474 | 620,553 |
| Events in quadrant D | 6,663,160 | 534,346 |
| Mode SS | |||
|---|---|---|---|
| Quadrant | BADHDUFLAG | Total packets | Discarded packets |
| A | 0 | 160 | 0 |
| B | 0 | 160 | 0 |
| C | 0 | 160 | 0 |
| D | 0 | 160 | 0 |
| Mode M0 | |||
|---|---|---|---|
| Quadrant | BADHDUFLAG | Total packets | Discarded packets |
| A | 0 | 28112 | 3 |
| B | 0 | 19165 | 2 |
| C | 0 | 17494 | 2 |
| D | 0 | 25162 | 2 |
| Mode M9 | |||
|---|---|---|---|
| Quadrant | BADHDUFLAG | Total packets | Discarded packets |
| A | 0 | 4 | 0 |
| B | 0 | 4 | 0 |
| C | 0 | 4 | 0 |
| D | 0 | 4 | 0 |
| Quadrant | Total seconds | Saturated seconds | Saturation percentage |
|---|---|---|---|
| A | 7842 | 1627 | 20.747258% |
| B | 7842 | 503 | 6.414180% |
| C | 7842 | 333 | 4.246366% |
| D | 7842 | 896 | 11.425657% |
Noise dominated data is calculated using 1-second bins in cleaned event files. If a bin has >2000 counts, and if more than 50% of those come from <1% of pixels, then it is considered to be noise-dominated and hence unusable.
| Quadrant | # 1 sec bins | Bins with >0 counts | Bins with >2000 counts | High rate bins dominated by noise | Noise dominated (total time) | Noise dominated (detector-on time) | Marked lightcurve |
|---|---|---|---|---|---|---|---|
| A | 8152 | 7845 | 1082 | 1082 | 13.27% | 13.79% | 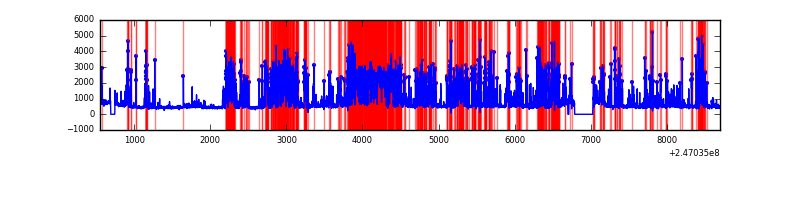 |
| B | 8152 | 7845 | 169 | 169 | 2.07% | 2.15% | 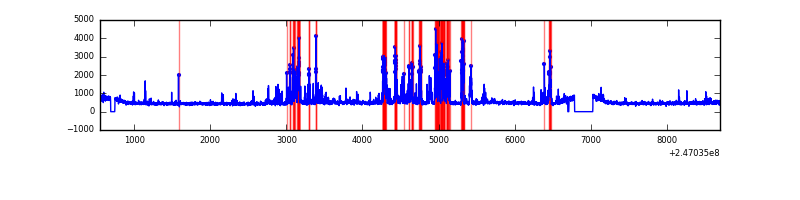 |
| C | 8152 | 7845 | 184 | 184 | 2.26% | 2.35% | 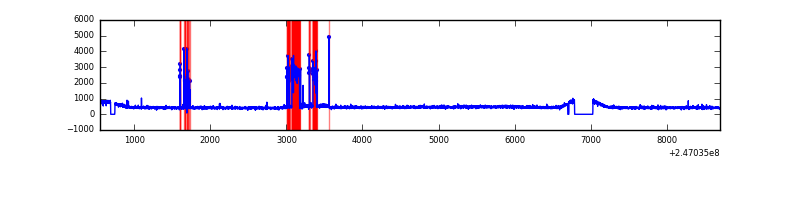 |
| D | 8152 | 7844 | 639 | 639 | 7.84% | 8.15% | 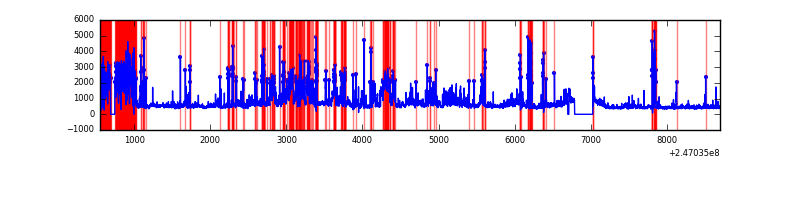 |
Top three noisy pixels from each quadrant. If the there are fewer than three noisy pixels in the level2.evt file, extra rows are filled as -1
| Pixel properties | Quadrant properties | ||||||
|---|---|---|---|---|---|---|---|
| Quadrant | DetID | PixID | Counts | Sigma | Mean | Median | Sigma |
| A | 8 | 5 | 4183918 | 23584.41 | 862 | 840 | 177.4 |
| A | 1 | 162 | 68321 | 380.46 | 862 | 840 | 177.4 |
| A | 1 | 178 | 41484 | 229.15 | 862 | 840 | 177.4 |
| B | 4 | 239 | 973831 | 5433.65 | 920 | 899 | 179.1 |
| B | 3 | 189 | 55888 | 307.1 | 920 | 899 | 179.1 |
| B | 15 | 204 | 47971 | 262.89 | 920 | 899 | 179.1 |
| C | 9 | 204 | 535089 | 2583.57 | 887 | 890 | 206.8 |
| C | 8 | 128 | 10536 | 46.65 | 887 | 890 | 206.8 |
| C | 14 | 234 | 8488 | 36.75 | 887 | 890 | 206.8 |
| D | 1 | 52 | 1906468 | 9575.23 | 824 | 799 | 199.0 |
| D | 10 | 253 | 661723 | 3320.88 | 824 | 799 | 199.0 |
| D | 8 | 195 | 523626 | 2627.0 | 824 | 799 | 199.0 |
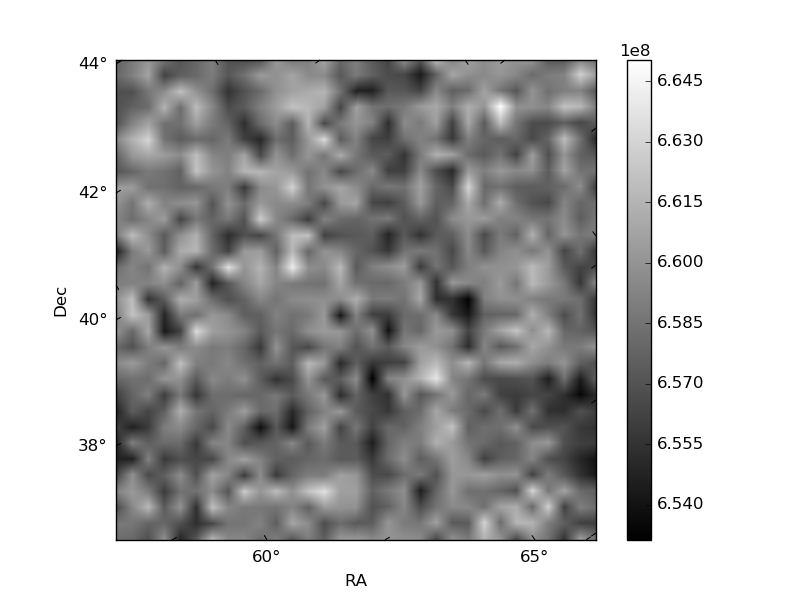
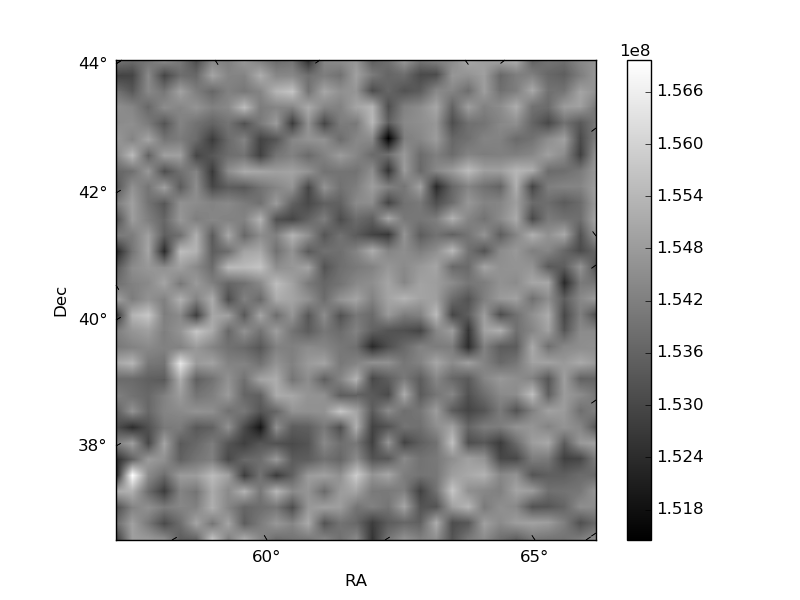
Histogram calculated using DETX and DETY for each event in the final _common_clean file
| Quadrant A | 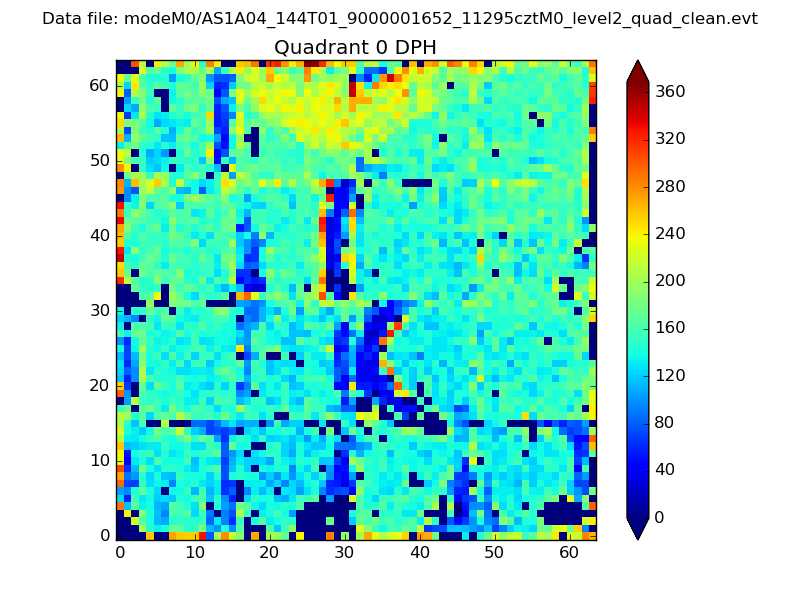 |
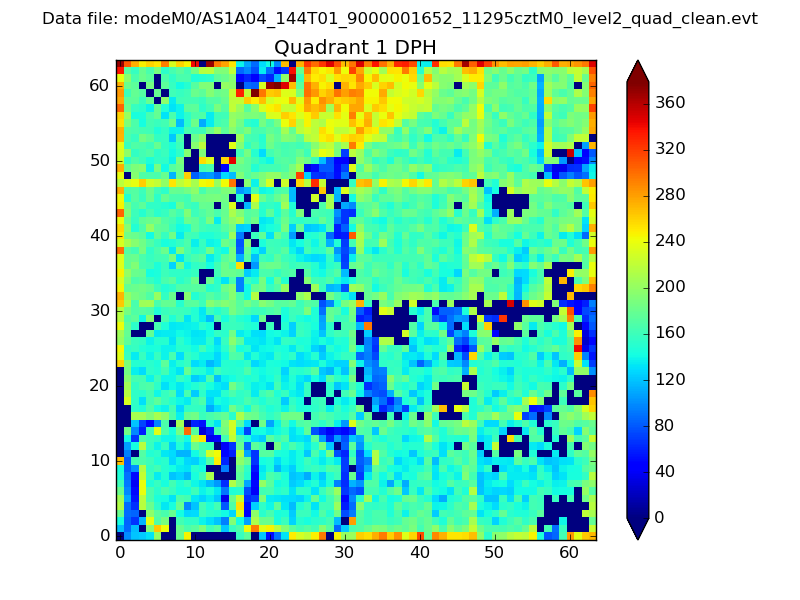 |
Quadrant B |
|---|---|---|---|
| Quadrant D | 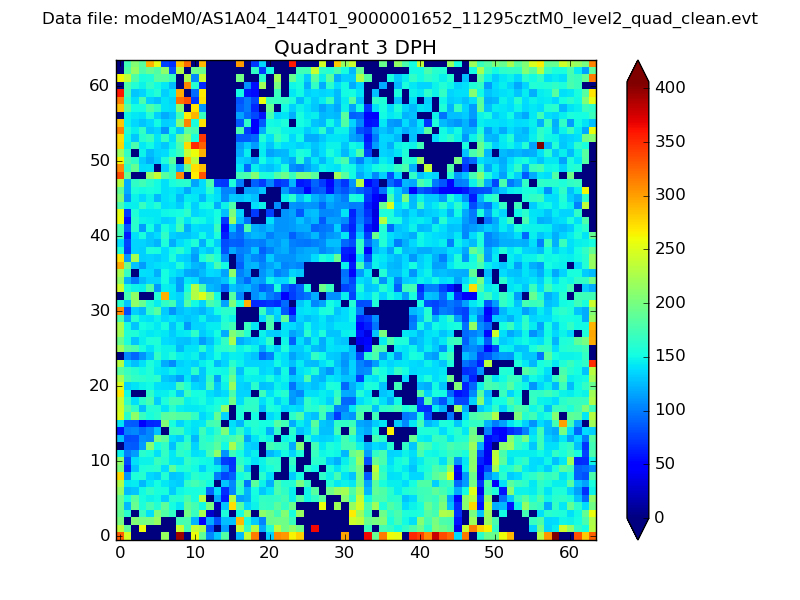 |
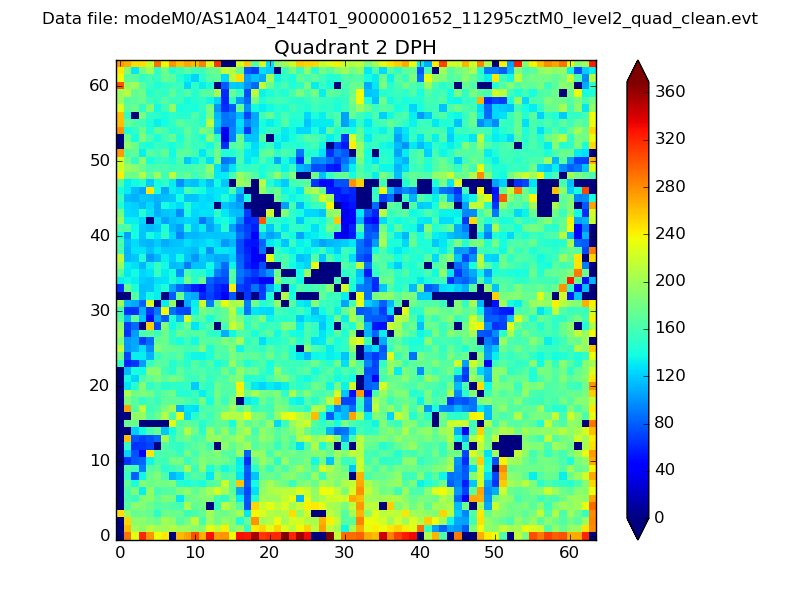 |
Quadrant C |
| Plot type | Count rate plots | Images |
|---|---|---|
| Comparison with Poisson distribution Blue bars denote a histogram of data divided into 1 sec bins. Red curve is a Poisson curve with rate = median count rate of data. |
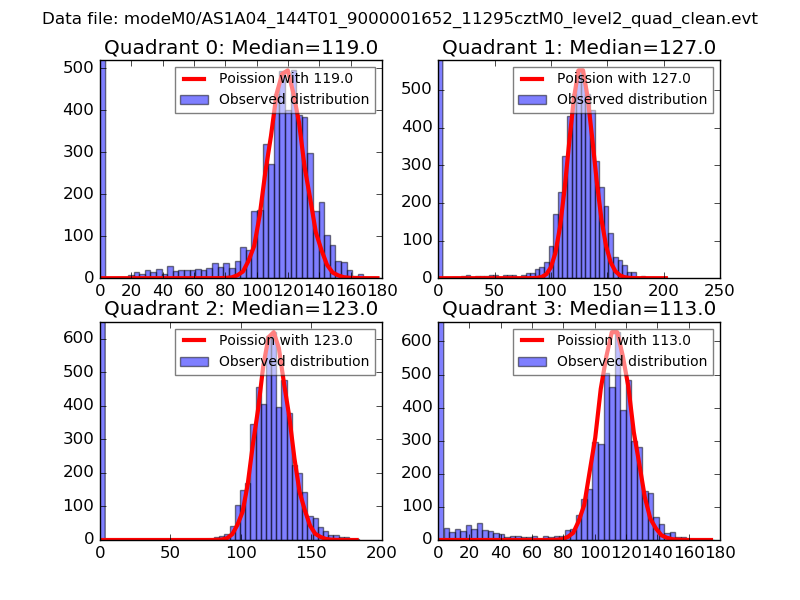 |
 |
| Quadrant-wise count rates Data is divided into 100 sec bins |
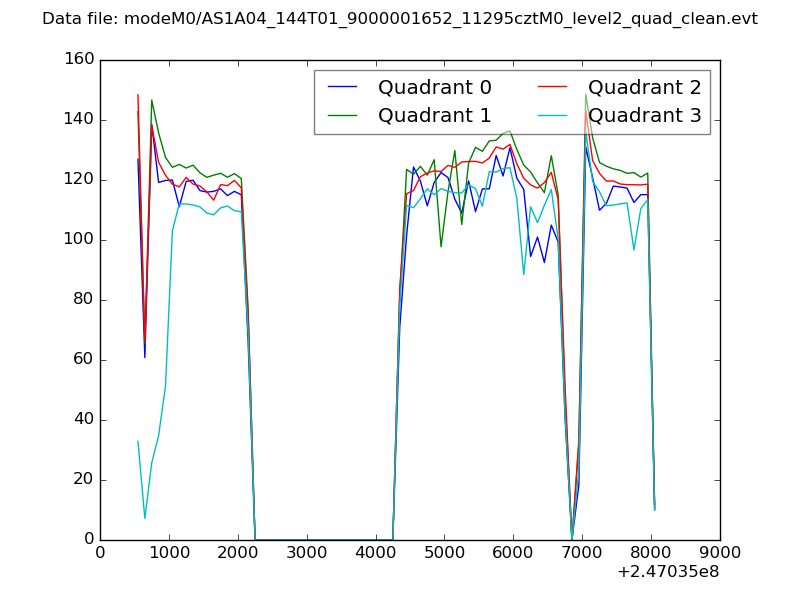 |
|
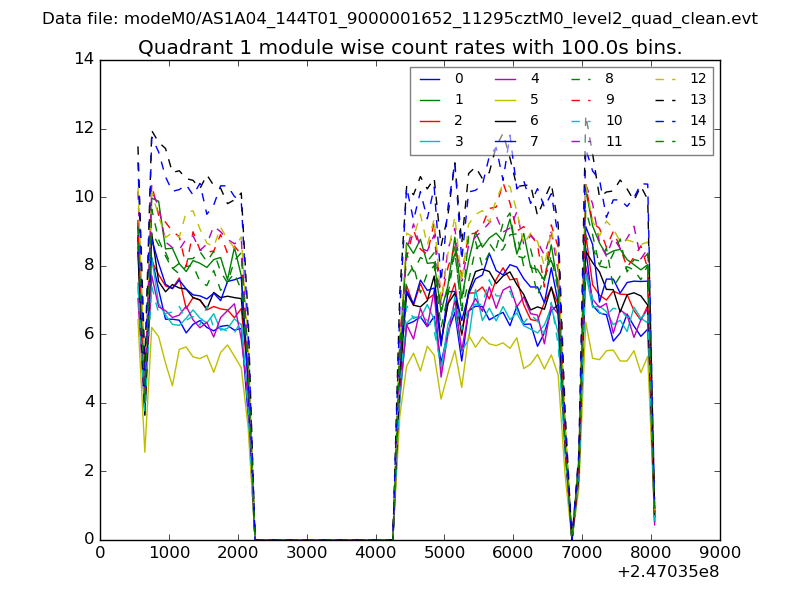
| Module-wise count rates for Quadrant A Data is divided into 100 sec bins |
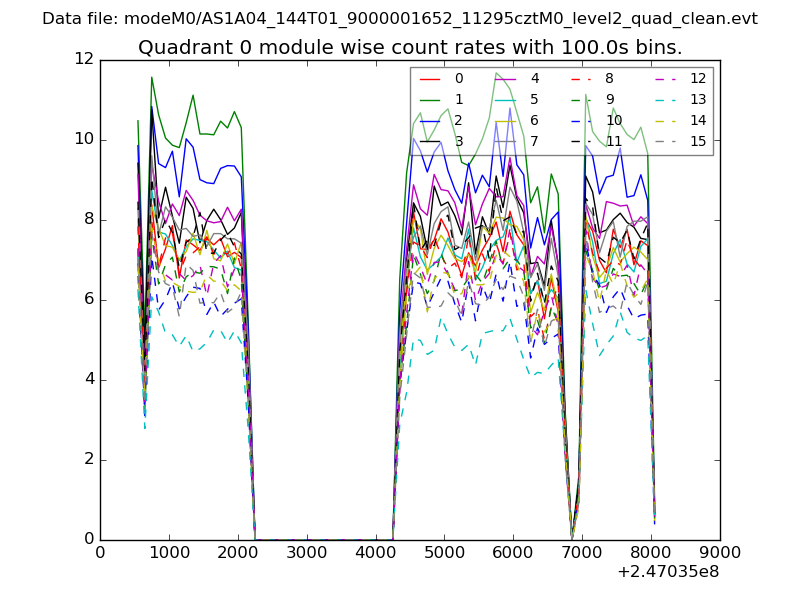 |
 |
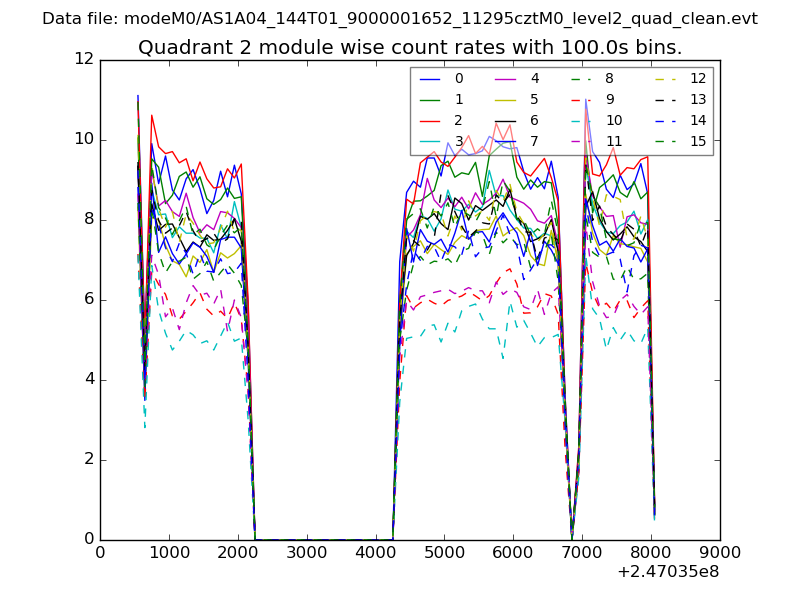
| Module-wise count rates for Quadrant B Data is divided into 100 sec bins |
 |
 |
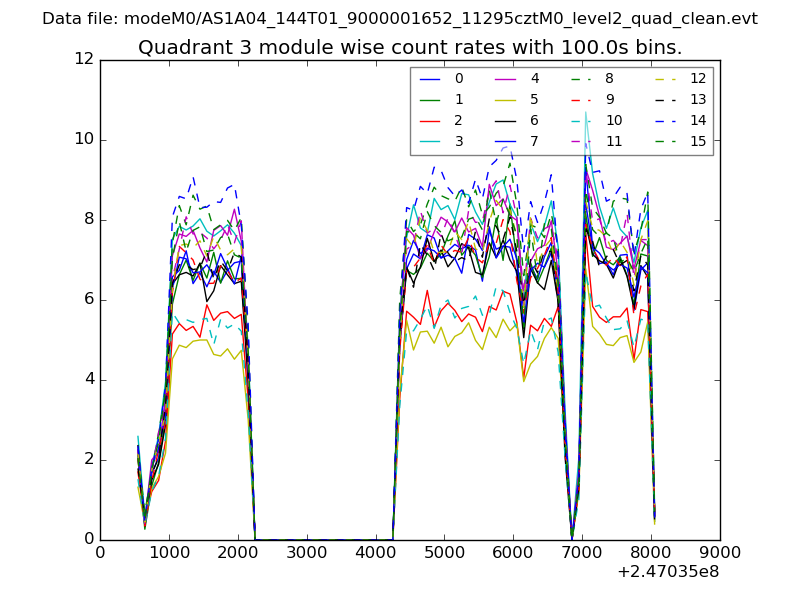
| Module-wise count rates for Quadrant C Data is divided into 100 sec bins |
 |
 |
| Module-wise count rates for Quadrant D Data is divided into 100 sec bins |
 |
 |
| Parameter | Plot |
|---|---|
| CZT HV Monitor | 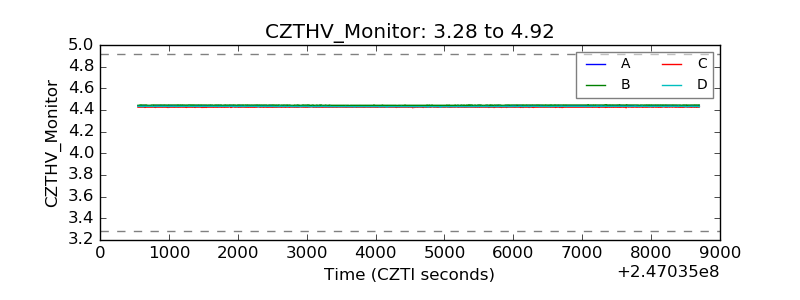 |
| D_VDD | 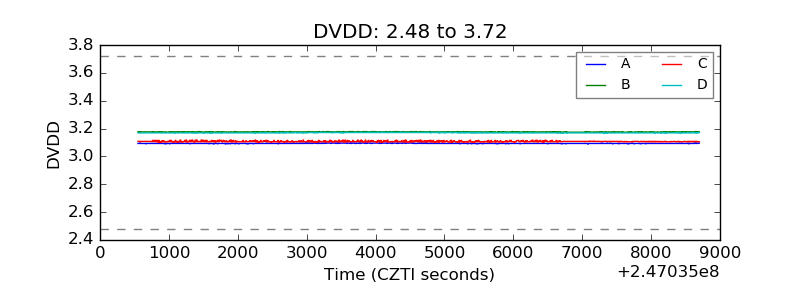 |
| Temperature 1 | 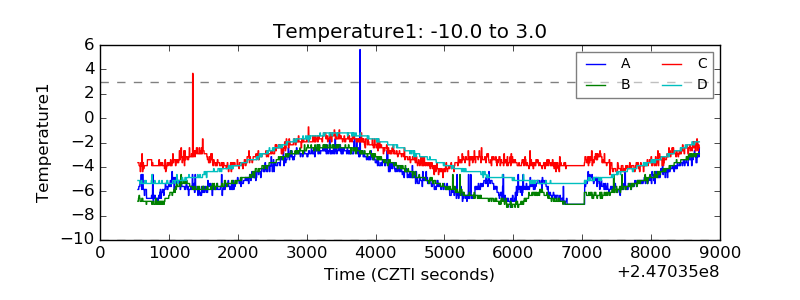 |
| Veto HV Monitor | 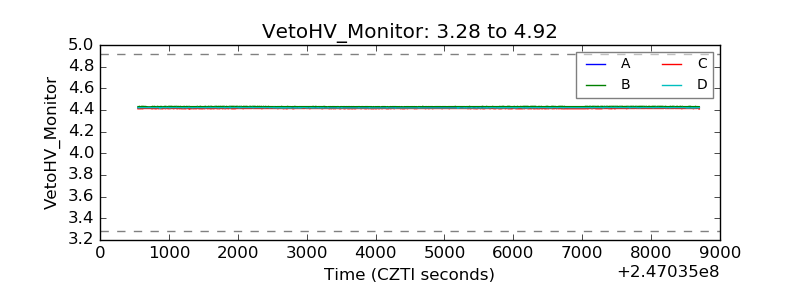 |
| Veto LLD | 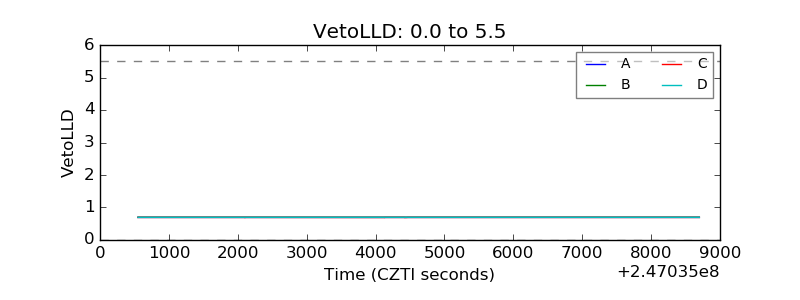 |
| Alpha Counter | 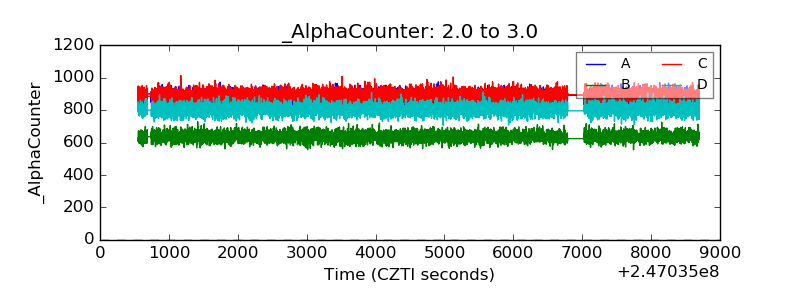 |
| _CPM_Rate | 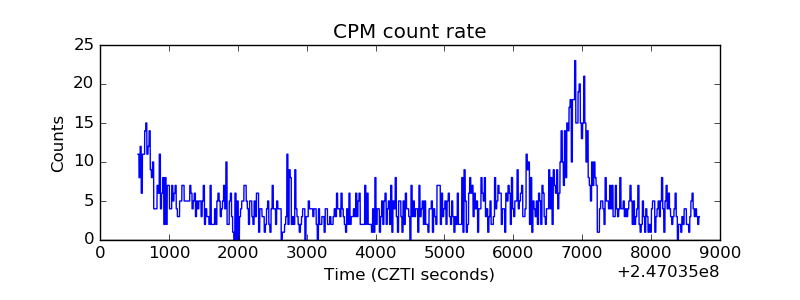 |
| CZT Counter | 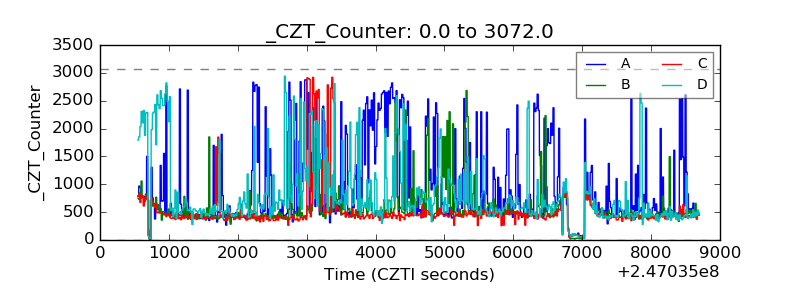 |
| +2.5 Volts monitor |  |
| +5 Volts monitor |  |
| _ROLL_ROT | 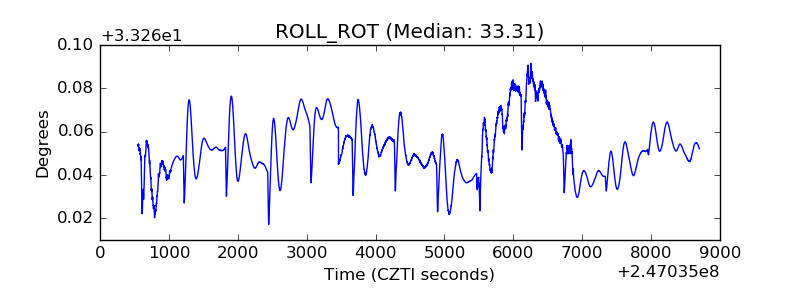 |
| _Roll_DEC | 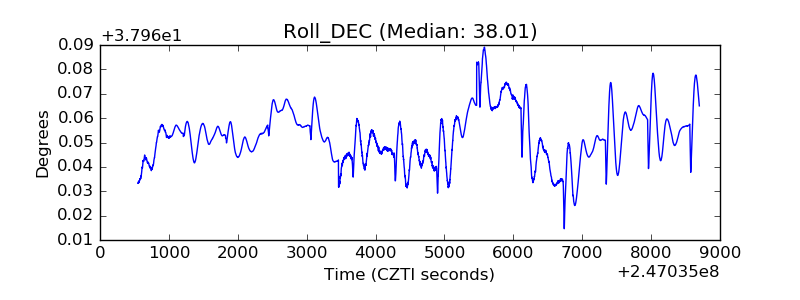 |
| _Roll_RA | 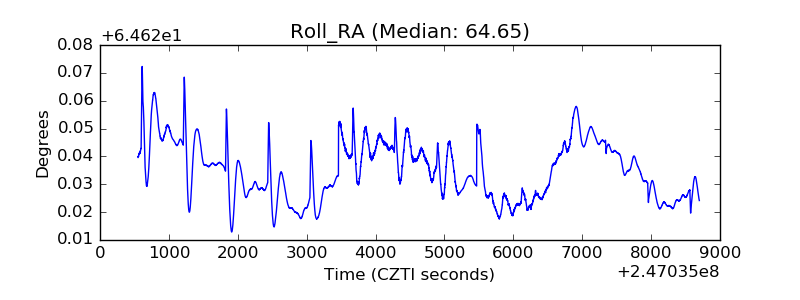 |
| Veto Counter | 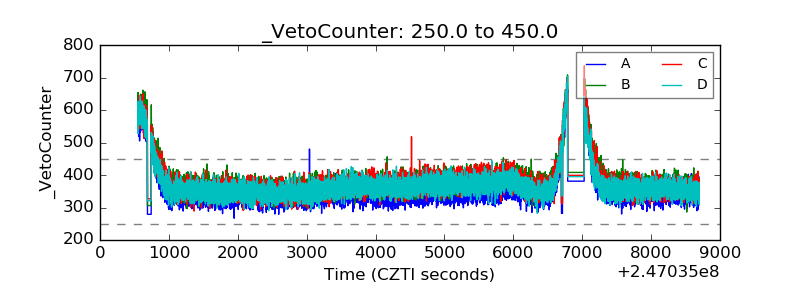 |