| Param | Original file | Final file |
|---|---|---|
| Filename | modeM0/AS1A04_144T01_9000001652_11298cztM0_level2.evt | modeM0/AS1A04_144T01_9000001652_11298cztM0_level2_quad_clean.evt |
| Size (bytes) | 1,721,805,120 | 212,811,840 |
| Size | 1.6 GB | 203.0 MB |
| Events in quadrant A | 11,879,062 | 1,314,610 |
| Events in quadrant B | 12,479,874 | 1,344,587 |
| Events in quadrant C | 8,508,057 | 1,322,386 |
| Events in quadrant D | 18,009,840 | 1,166,148 |
| Mode SS | |||
|---|---|---|---|
| Quadrant | BADHDUFLAG | Total packets | Discarded packets |
| A | 0 | 382 | 0 |
| B | 0 | 382 | 0 |
| C | 0 | 382 | 0 |
| D | 0 | 382 | 0 |
| Mode M0 | |||
|---|---|---|---|
| Quadrant | BADHDUFLAG | Total packets | Discarded packets |
| A | 0 | 47289 | 5 |
| B | 0 | 49308 | 4 |
| C | 0 | 38471 | 4 |
| D | 0 | 66215 | 4 |
| Mode M9 | |||
|---|---|---|---|
| Quadrant | BADHDUFLAG | Total packets | Discarded packets |
| A | 0 | 21 | 0 |
| B | 0 | 21 | 0 |
| C | 0 | 21 | 0 |
| D | 0 | 21 | 0 |
| Quadrant | Total seconds | Saturated seconds | Saturation percentage |
|---|---|---|---|
| A | 18811 | 1149 | 6.108128% |
| B | 18811 | 1404 | 7.463718% |
| C | 18811 | 270 | 1.435330% |
| D | 18811 | 2896 | 15.395247% |
Noise dominated data is calculated using 1-second bins in cleaned event files. If a bin has >2000 counts, and if more than 50% of those come from <1% of pixels, then it is considered to be noise-dominated and hence unusable.
| Quadrant | # 1 sec bins | Bins with >0 counts | Bins with >2000 counts | High rate bins dominated by noise | Noise dominated (total time) | Noise dominated (detector-on time) | Marked lightcurve |
|---|---|---|---|---|---|---|---|
| A | 20946 | 18816 | 515 | 515 | 2.46% | 2.74% | 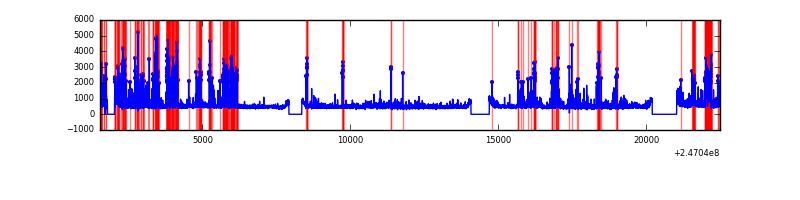 |
| B | 20946 | 18816 | 633 | 633 | 3.02% | 3.36% | 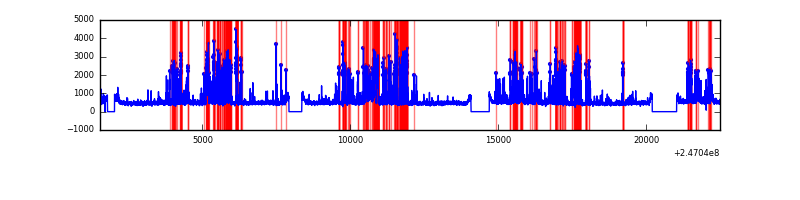 |
| C | 20946 | 18816 | 3 | 3 | 0.01% | 0.02% | 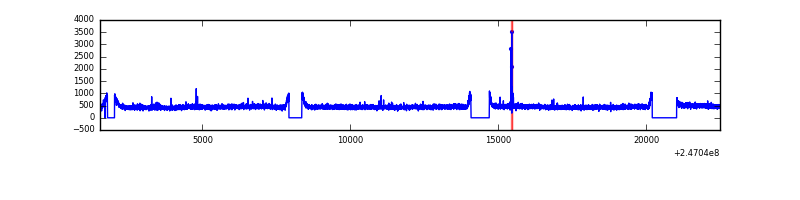 |
| D | 20946 | 18816 | 1931 | 1931 | 9.22% | 10.26% | 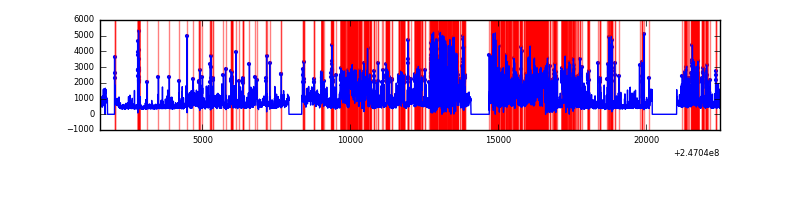 |
Top three noisy pixels from each quadrant. If the there are fewer than three noisy pixels in the level2.evt file, extra rows are filled as -1
| Pixel properties | Quadrant properties | ||||||
|---|---|---|---|---|---|---|---|
| Quadrant | DetID | PixID | Counts | Sigma | Mean | Median | Sigma |
| A | 8 | 5 | 2858332 | 6338.41 | 2206 | 2157 | 450.6 |
| A | 1 | 162 | 131753 | 287.6 | 2206 | 2157 | 450.6 |
| A | 1 | 178 | 82292 | 177.84 | 2206 | 2157 | 450.6 |
| B | 4 | 239 | 3488055 | 8173.88 | 2213 | 2158 | 426.5 |
| B | 3 | 189 | 141191 | 326.01 | 2213 | 2158 | 426.5 |
| B | 15 | 204 | 98325 | 225.5 | 2213 | 2158 | 426.5 |
| C | 14 | 234 | 26476 | 47.88 | 2176 | 2186 | 507.3 |
| C | 13 | 61 | 16199 | 27.62 | 2176 | 2186 | 507.3 |
| C | 3 | 202 | 5385 | 6.31 | 2176 | 2186 | 507.3 |
| D | 13 | 152 | 4466886 | 9175.41 | 2028 | 1965 | 486.6 |
| D | 1 | 52 | 2130803 | 4374.76 | 2028 | 1965 | 486.6 |
| D | 10 | 253 | 1865195 | 3828.93 | 2028 | 1965 | 486.6 |
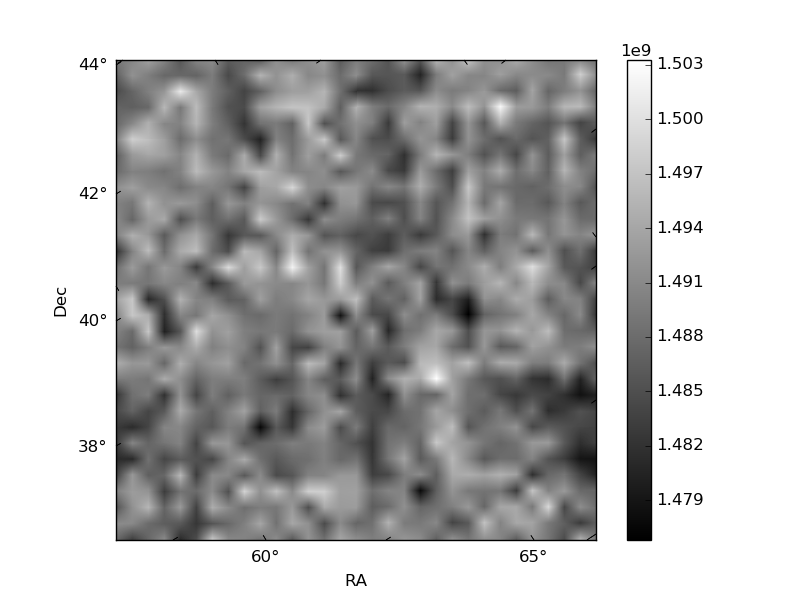
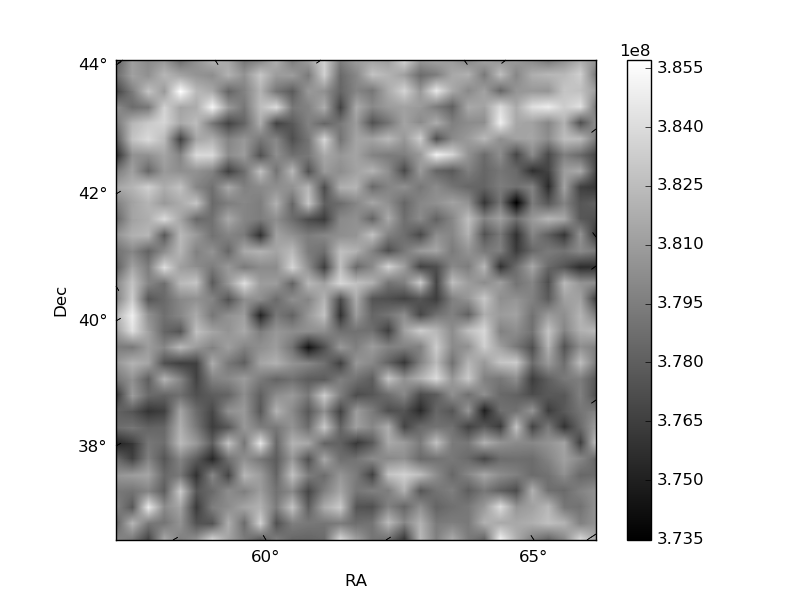
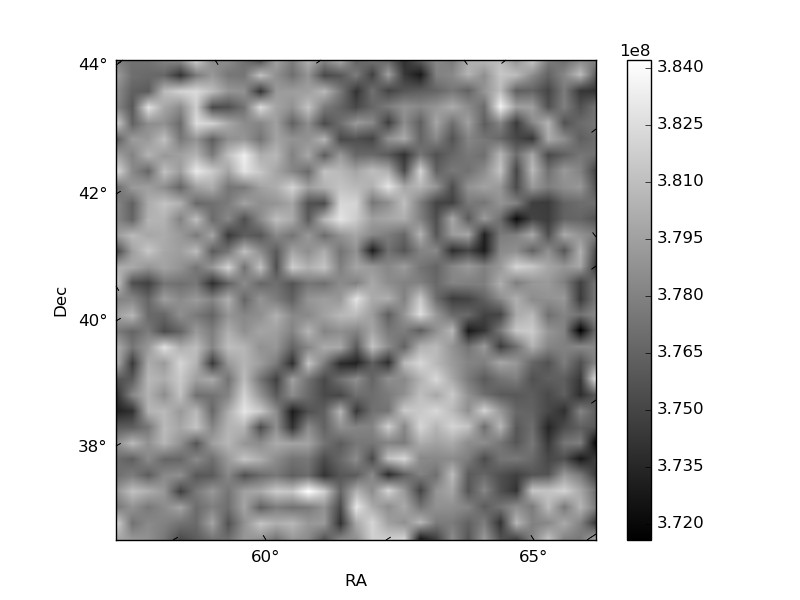
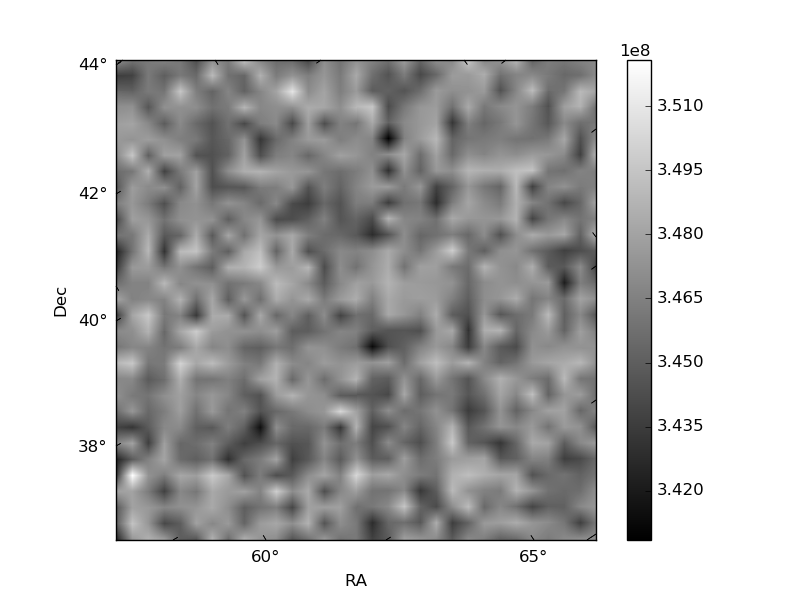
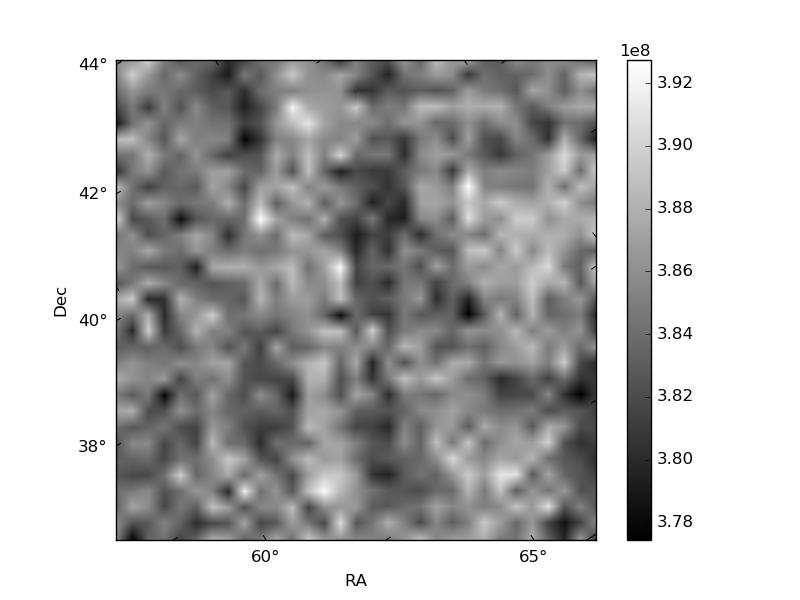
Histogram calculated using DETX and DETY for each event in the final _common_clean file
| Quadrant A | 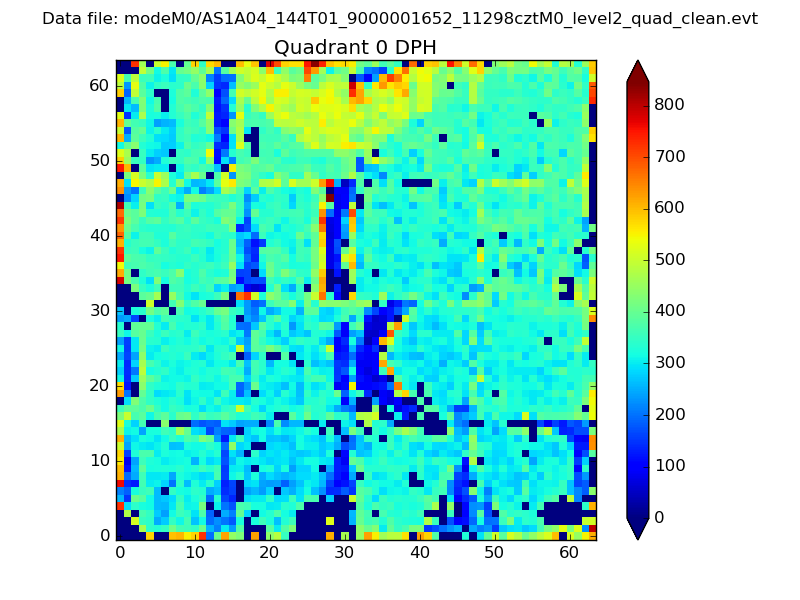 |
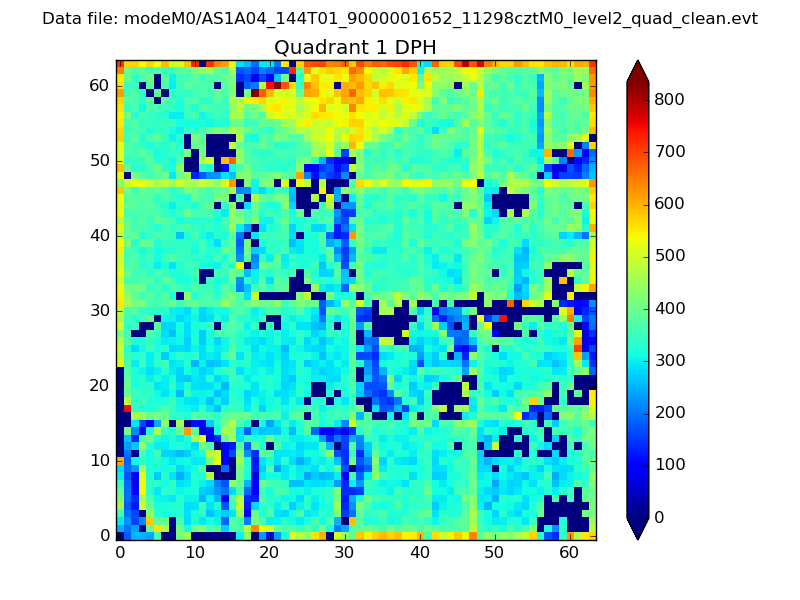 |
Quadrant B |
|---|---|---|---|
| Quadrant D | 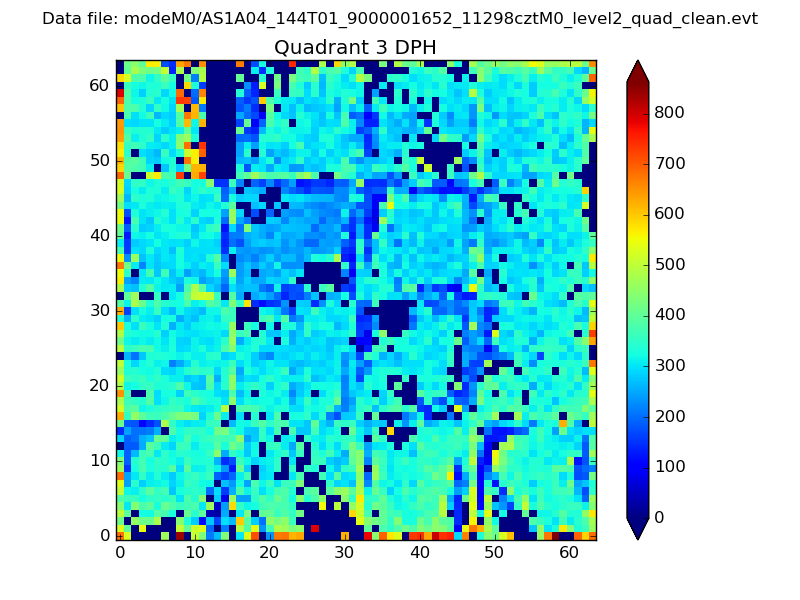 |
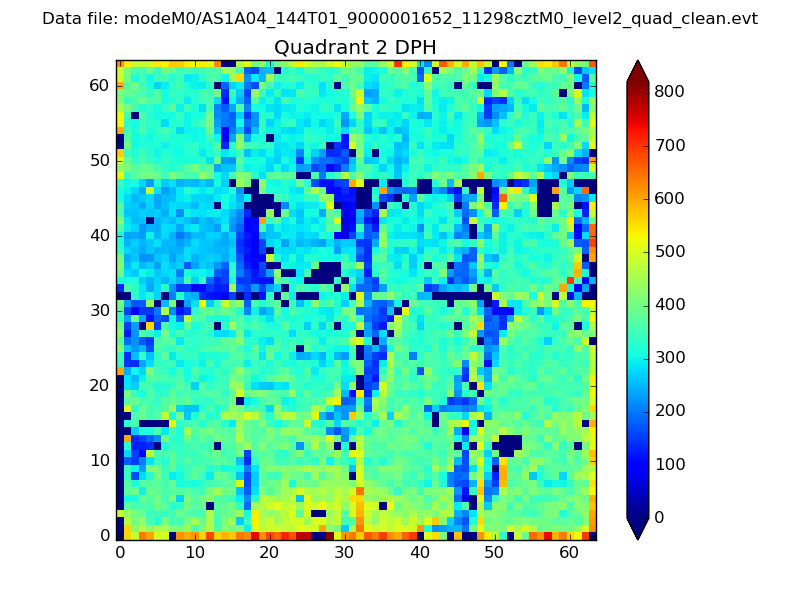 |
Quadrant C |
| Plot type | Count rate plots | Images |
|---|---|---|
| Comparison with Poisson distribution Blue bars denote a histogram of data divided into 1 sec bins. Red curve is a Poisson curve with rate = median count rate of data. |
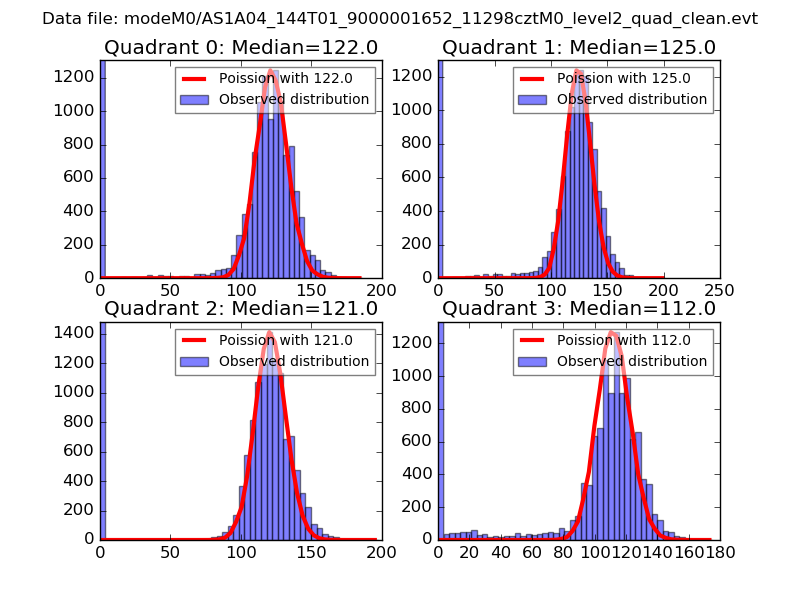 |
 |
| Quadrant-wise count rates Data is divided into 100 sec bins |
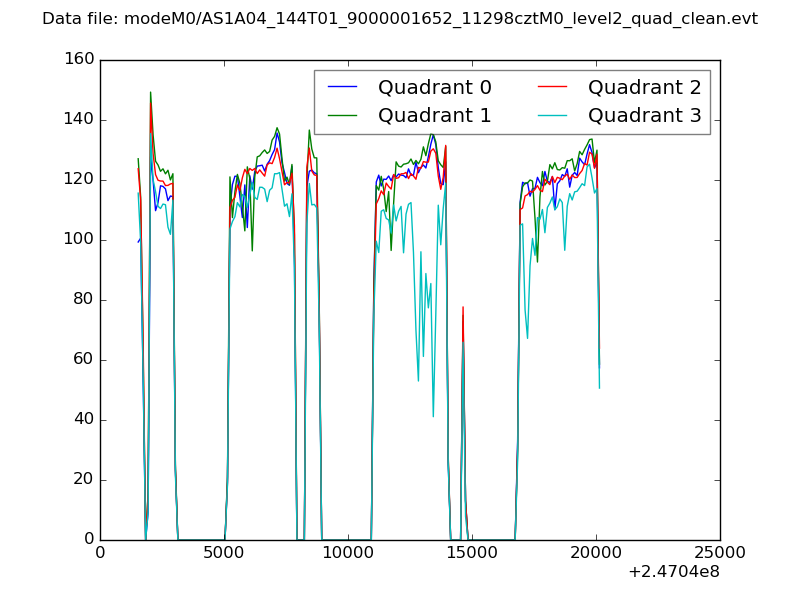 |
|
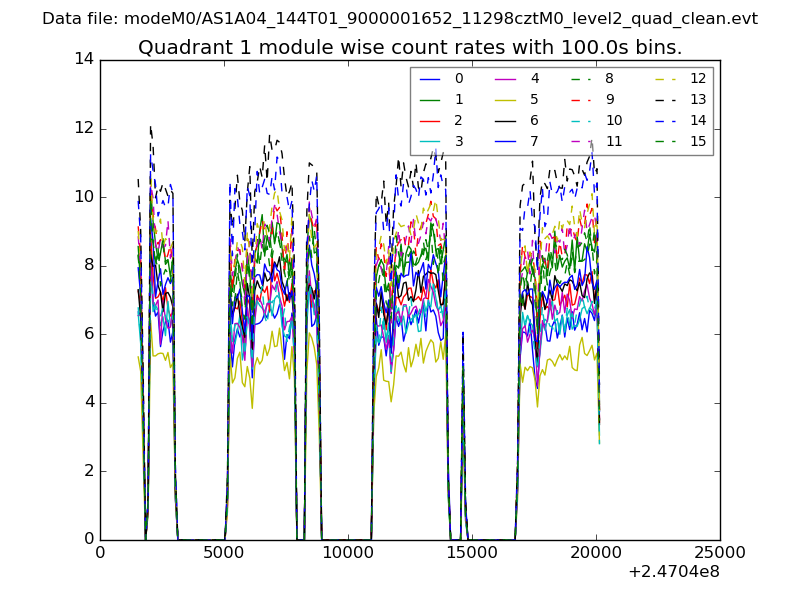
| Module-wise count rates for Quadrant A Data is divided into 100 sec bins |
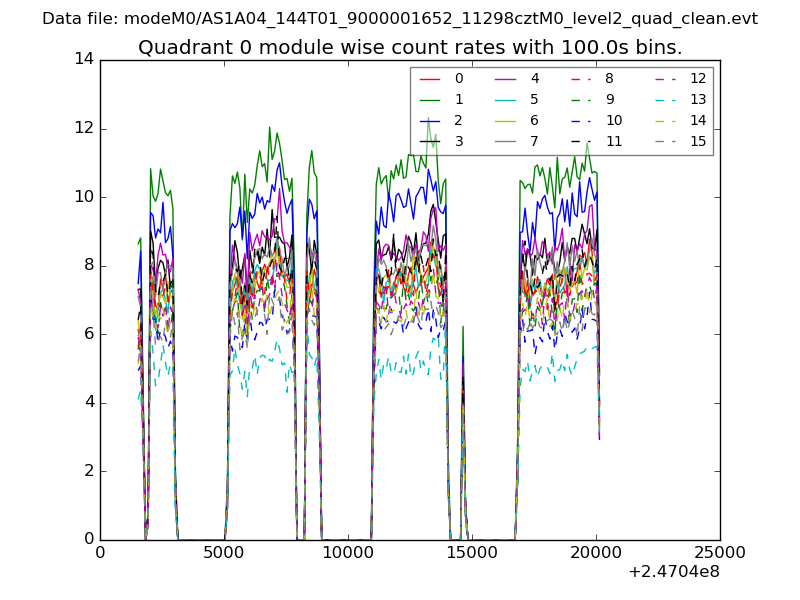 |
 |
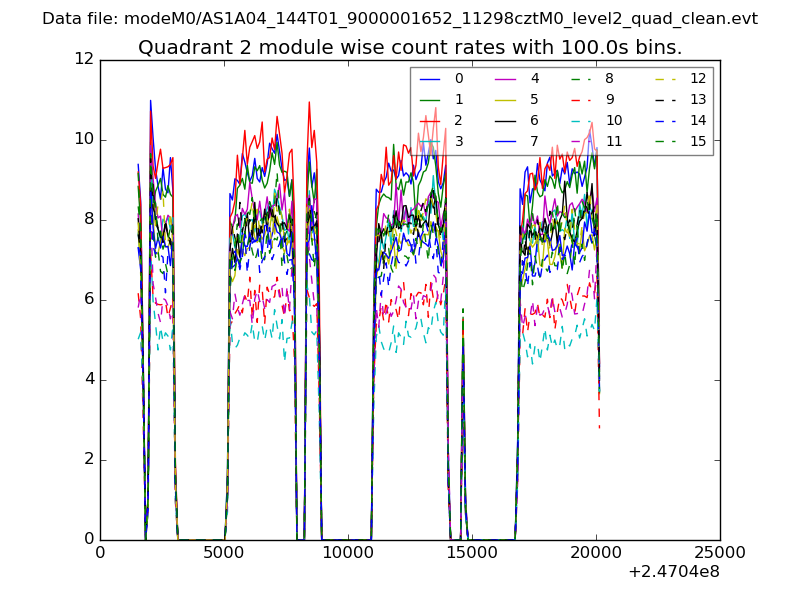
| Module-wise count rates for Quadrant B Data is divided into 100 sec bins |
 |
 |
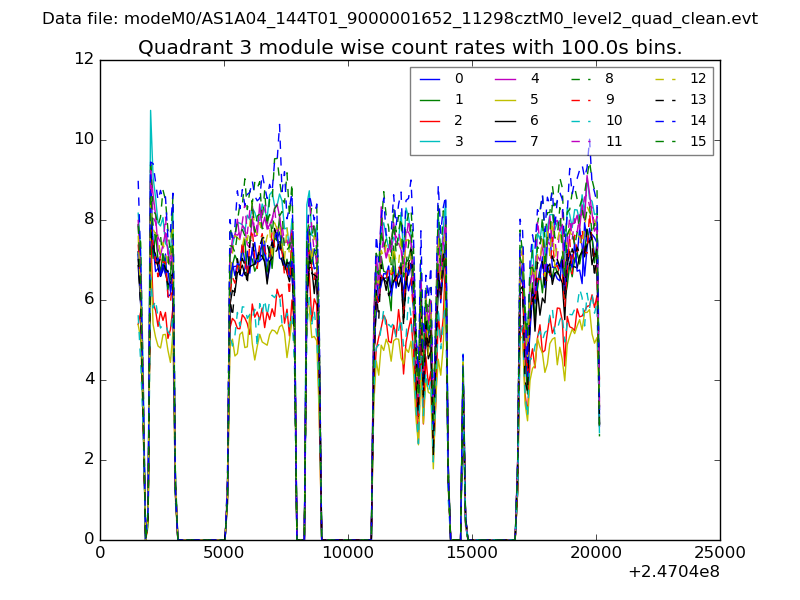
| Module-wise count rates for Quadrant C Data is divided into 100 sec bins |
 |
 |
| Module-wise count rates for Quadrant D Data is divided into 100 sec bins |
 |
 |
| Parameter | Plot |
|---|---|
| CZT HV Monitor | 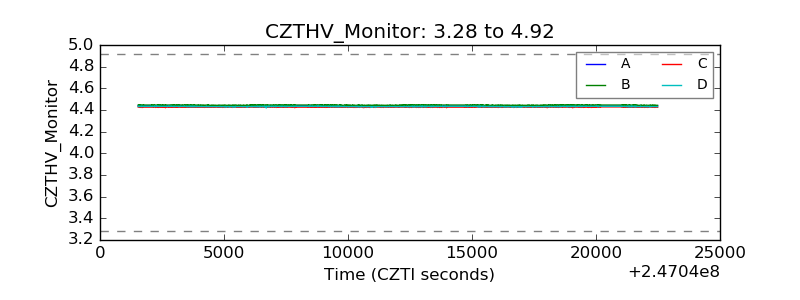 |
| D_VDD | 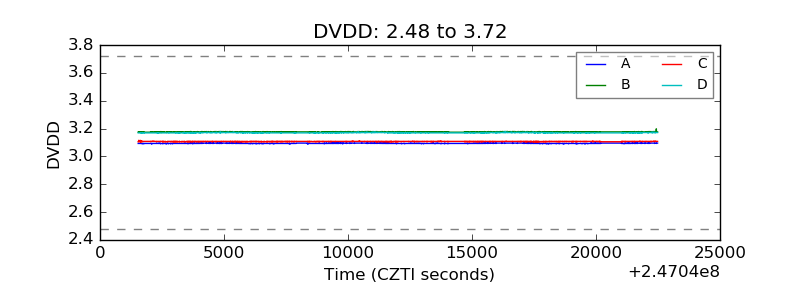 |
| Temperature 1 | 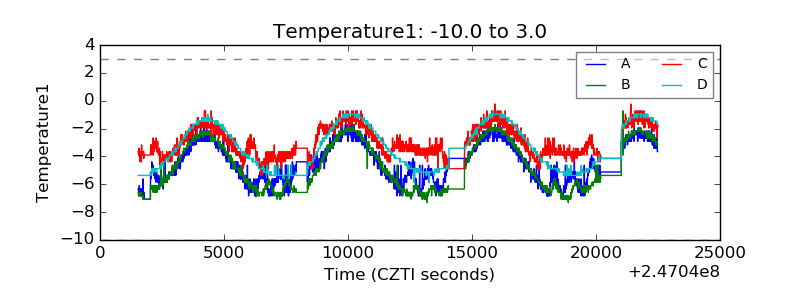 |
| Veto HV Monitor | 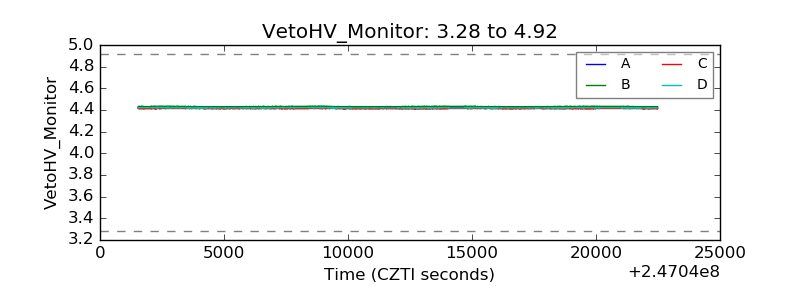 |
| Veto LLD | 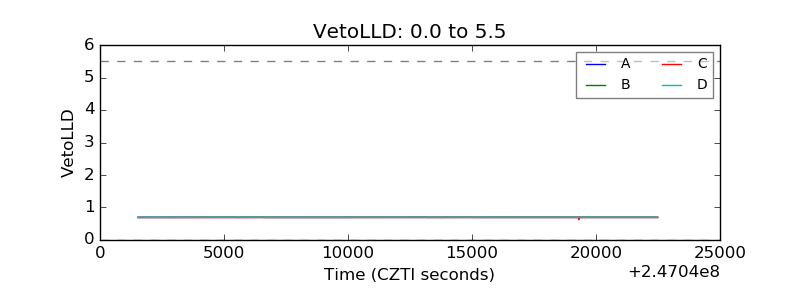 |
| Alpha Counter | 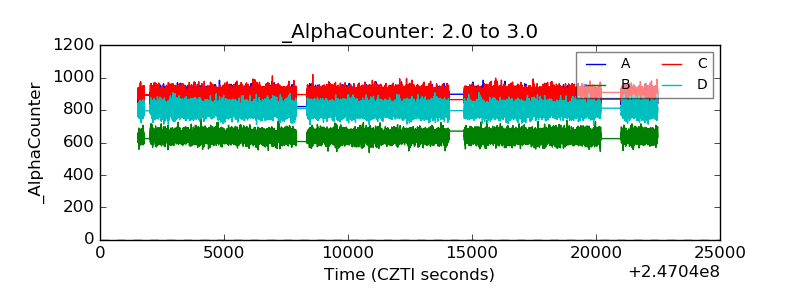 |
| _CPM_Rate | 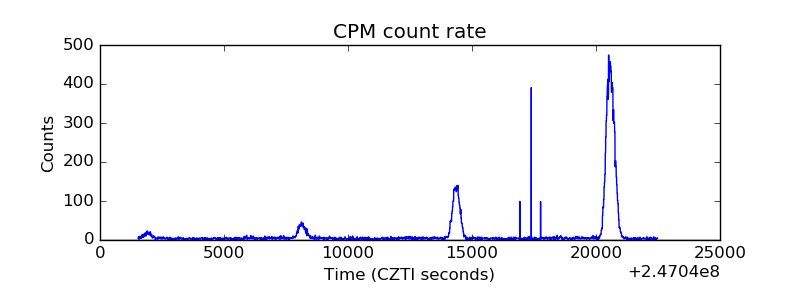 |
| CZT Counter | 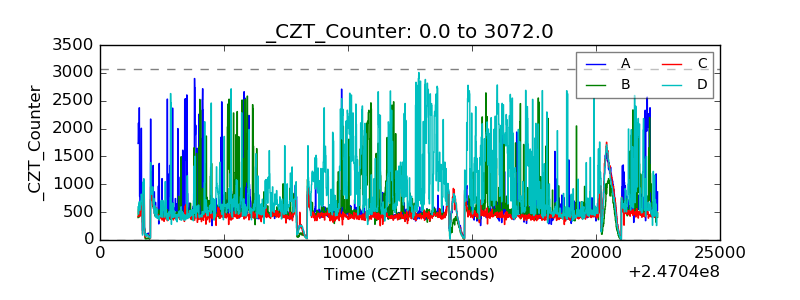 |
| +2.5 Volts monitor | 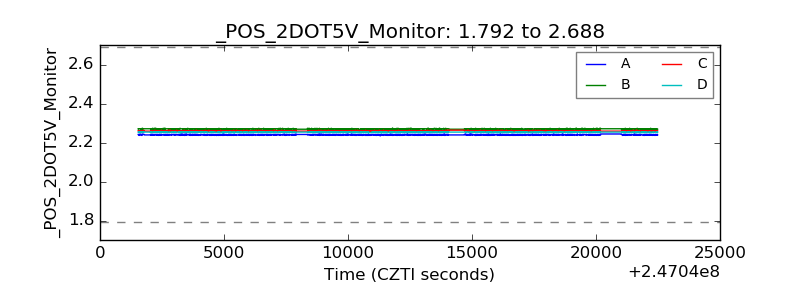 |
| +5 Volts monitor | 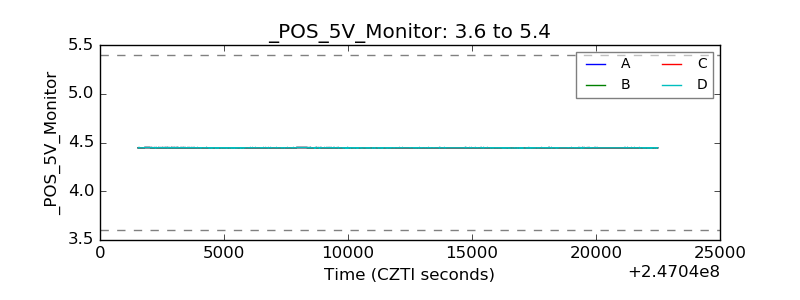 |
| _ROLL_ROT | 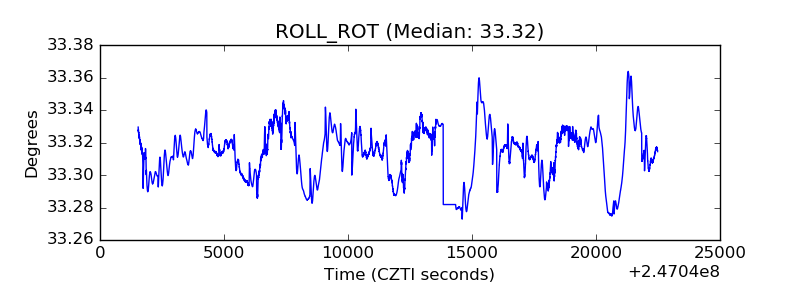 |
| _Roll_DEC | 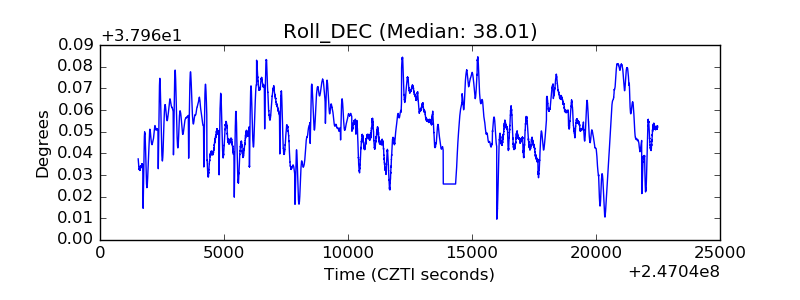 |
| _Roll_RA | 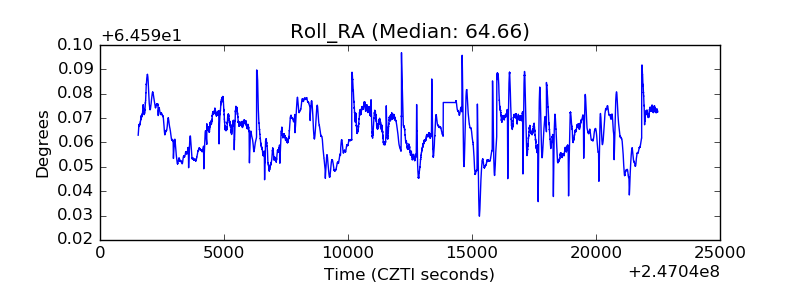 |
| Veto Counter | 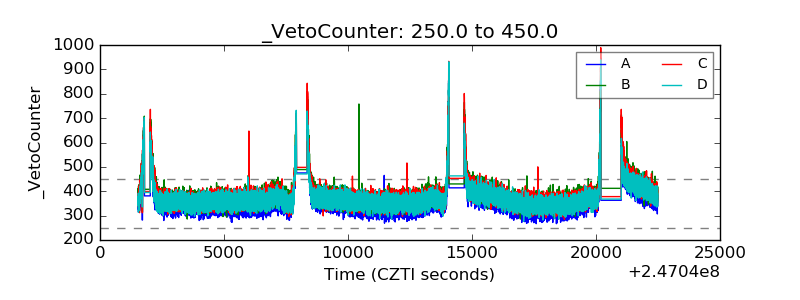 |