| Param | Original file | Final file |
|---|---|---|
| Filename | modeM0/AS1A04_144T01_9000001652_11299cztM0_level2.evt | modeM0/AS1A04_144T01_9000001652_11299cztM0_level2_quad_clean.evt |
| Size (bytes) | 597,329,280 | 72,457,920 |
| Size | 569.7 MB | 69.1 MB |
| Events in quadrant A | 4,725,419 | 436,703 |
| Events in quadrant B | 4,585,085 | 447,082 |
| Events in quadrant C | 3,106,527 | 440,455 |
| Events in quadrant D | 5,221,490 | 404,820 |
| Mode SS | |||
|---|---|---|---|
| Quadrant | BADHDUFLAG | Total packets | Discarded packets |
| A | 0 | 134 | 0 |
| B | 0 | 134 | 0 |
| C | 0 | 134 | 0 |
| D | 0 | 134 | 0 |
| Mode M0 | |||
|---|---|---|---|
| Quadrant | BADHDUFLAG | Total packets | Discarded packets |
| A | 0 | 18482 | 3 |
| B | 0 | 18070 | 2 |
| C | 0 | 13671 | 2 |
| D | 0 | 20088 | 2 |
| Mode M9 | |||
|---|---|---|---|
| Quadrant | BADHDUFLAG | Total packets | Discarded packets |
| A | 0 | 10 | 0 |
| B | 0 | 10 | 0 |
| C | 0 | 10 | 0 |
| D | 0 | 11 | 0 |
| Quadrant | Total seconds | Saturated seconds | Saturation percentage |
|---|---|---|---|
| A | 6670 | 497 | 7.451274% |
| B | 6670 | 448 | 6.716642% |
| C | 6670 | 31 | 0.464768% |
| D | 6670 | 501 | 7.511244% |
Noise dominated data is calculated using 1-second bins in cleaned event files. If a bin has >2000 counts, and if more than 50% of those come from <1% of pixels, then it is considered to be noise-dominated and hence unusable.
| Quadrant | # 1 sec bins | Bins with >0 counts | Bins with >2000 counts | High rate bins dominated by noise | Noise dominated (total time) | Noise dominated (detector-on time) | Marked lightcurve |
|---|---|---|---|---|---|---|---|
| A | 7670 | 6671 | 290 | 290 | 3.78% | 4.35% | 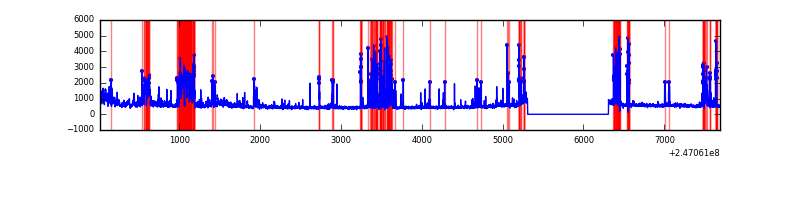 |
| B | 7670 | 6671 | 206 | 206 | 2.69% | 3.09% | 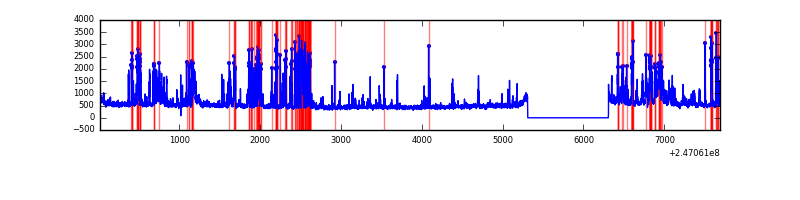 |
| C | 7670 | 6671 | 0 | 0 | 0.00% | 0.00% | 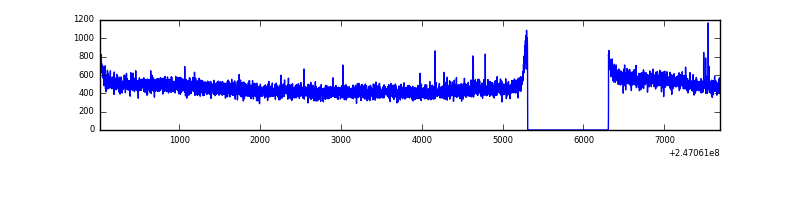 |
| D | 7670 | 6670 | 388 | 388 | 5.06% | 5.82% | 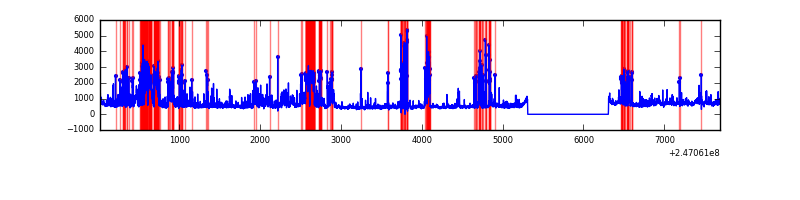 |
Top three noisy pixels from each quadrant. If the there are fewer than three noisy pixels in the level2.evt file, extra rows are filled as -1
| Pixel properties | Quadrant properties | ||||||
|---|---|---|---|---|---|---|---|
| Quadrant | DetID | PixID | Counts | Sigma | Mean | Median | Sigma |
| A | 8 | 5 | 1545831 | 9589.32 | 792 | 777 | 161.1 |
| A | 0 | 8 | 40743 | 248.05 | 792 | 777 | 161.1 |
| A | 1 | 162 | 27076 | 163.22 | 792 | 777 | 161.1 |
| B | 4 | 239 | 1268569 | 8169.62 | 808 | 788 | 155.2 |
| B | 4 | 81 | 44923 | 284.41 | 808 | 788 | 155.2 |
| B | 10 | 244 | 43406 | 274.63 | 808 | 788 | 155.2 |
| C | 9 | 204 | 9741 | 48.22 | 794 | 798 | 185.4 |
| C | 13 | 61 | 5913 | 27.58 | 794 | 798 | 185.4 |
| C | 14 | 234 | 3501 | 14.58 | 794 | 798 | 185.4 |
| D | 1 | 52 | 930433 | 4970.37 | 770 | 748 | 187.0 |
| D | 10 | 253 | 399424 | 2131.44 | 770 | 748 | 187.0 |
| D | 13 | 152 | 369078 | 1969.2 | 770 | 748 | 187.0 |
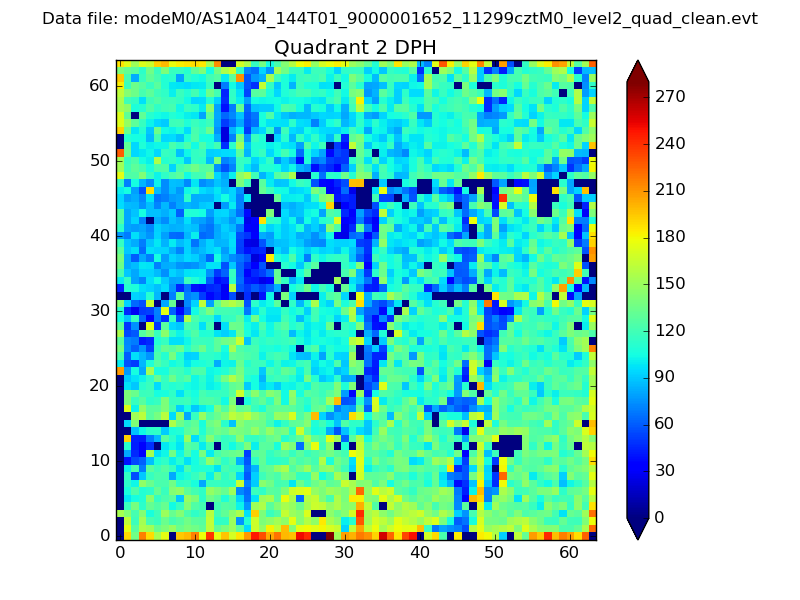
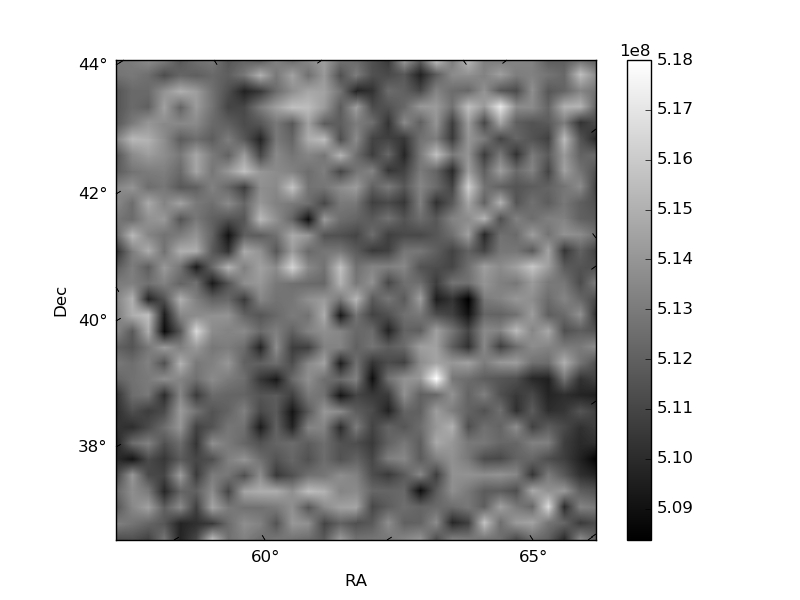
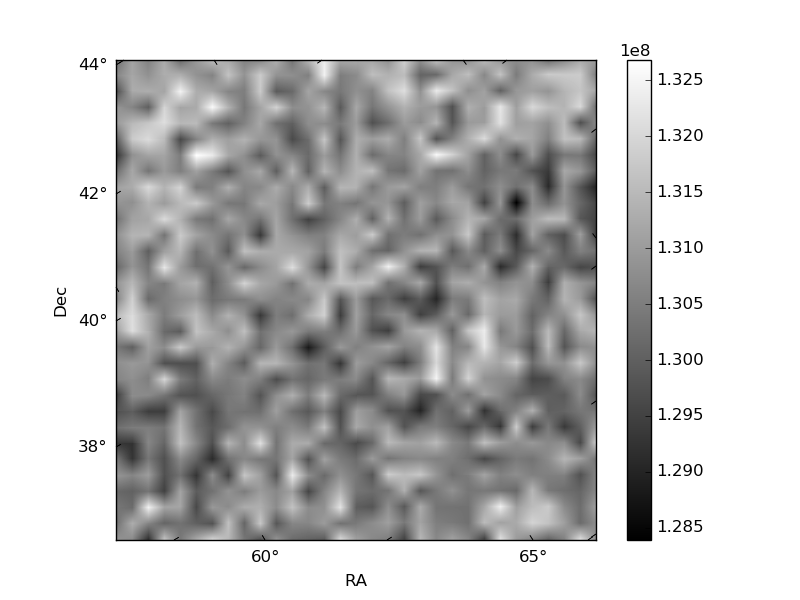
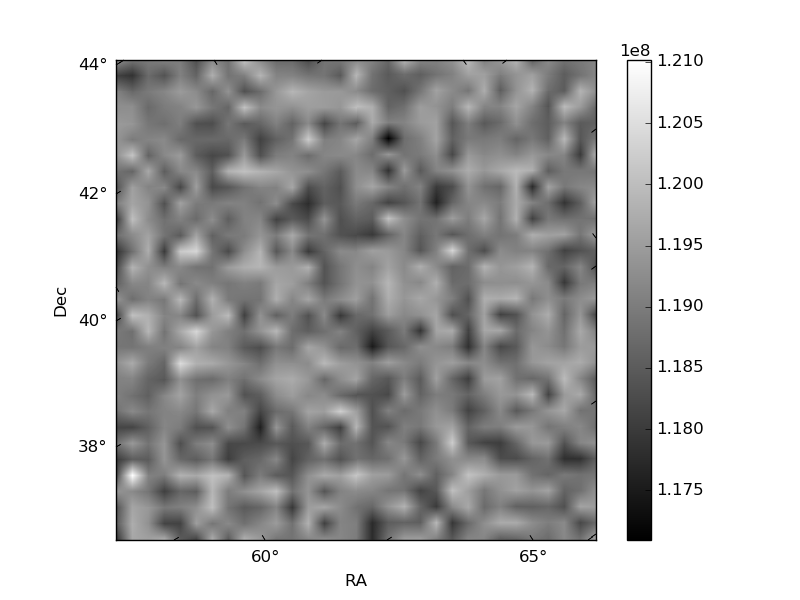
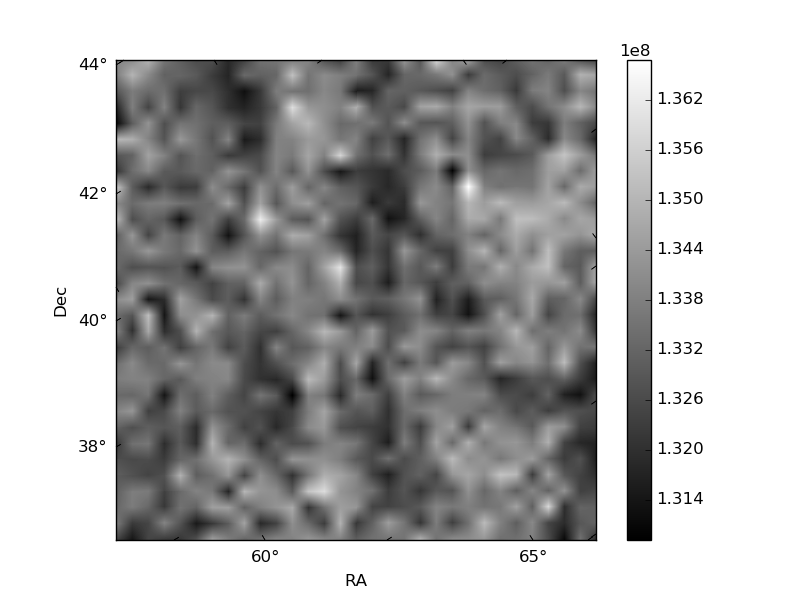
Histogram calculated using DETX and DETY for each event in the final _common_clean file
| Quadrant A | 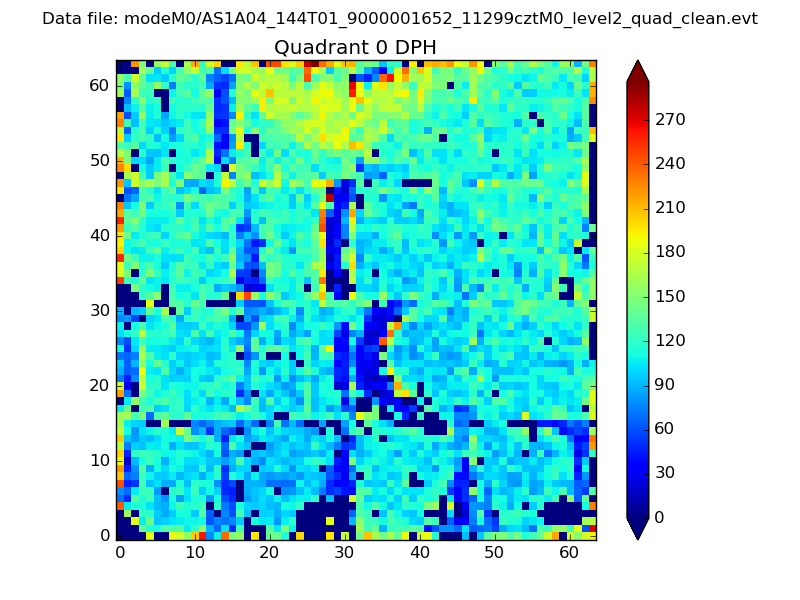 |
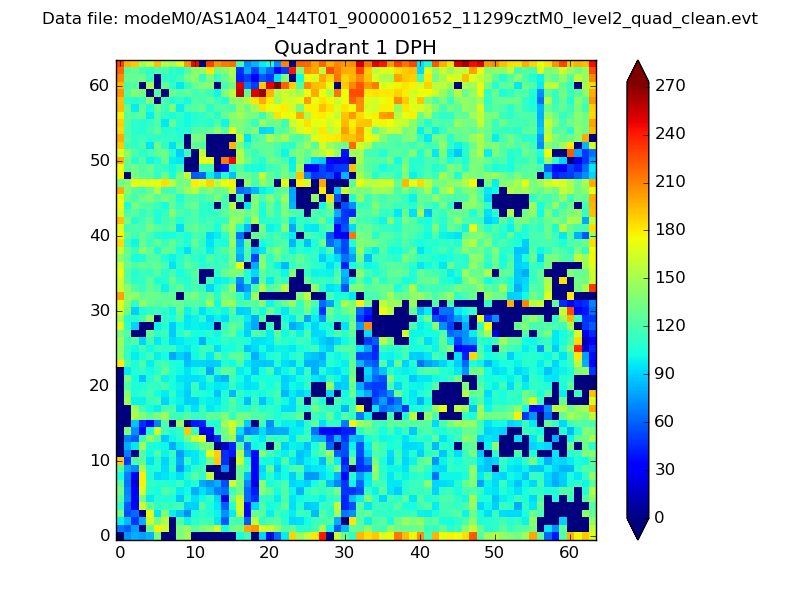 |
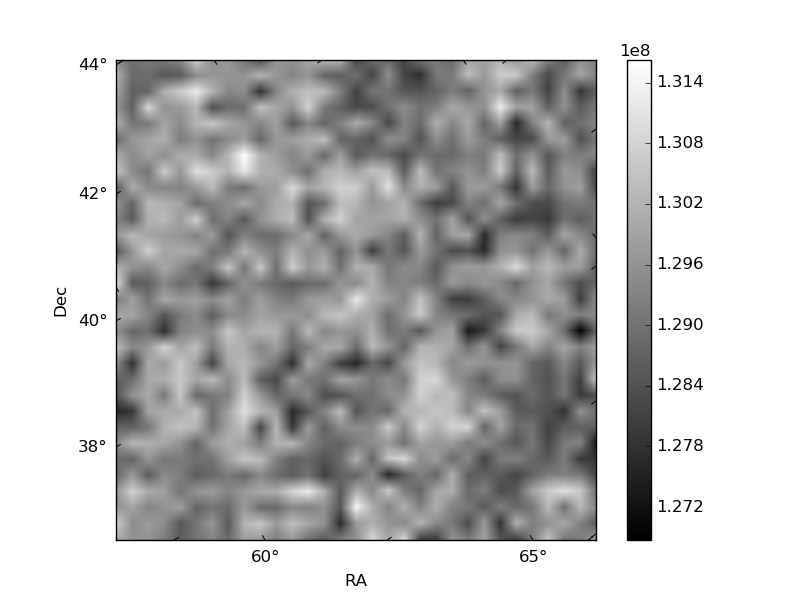
Quadrant B |
|---|---|---|---|
| Quadrant D | 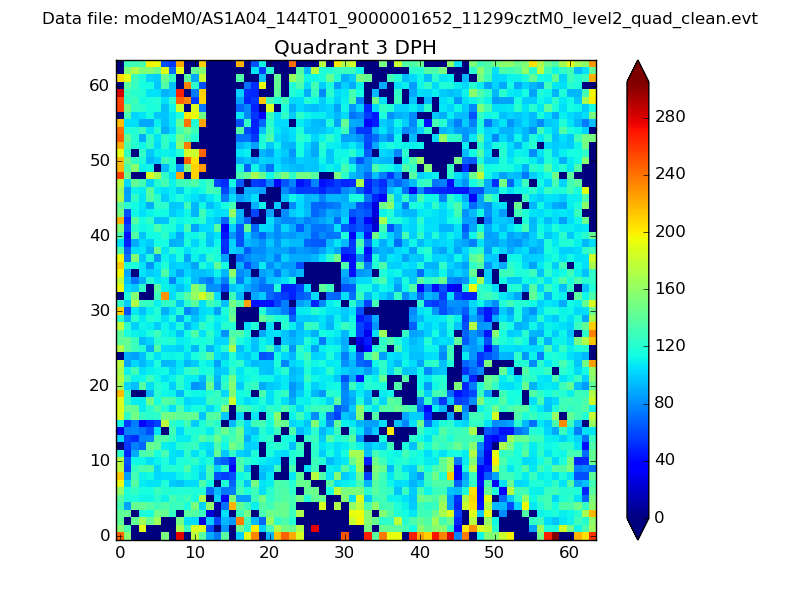 |
 |
Quadrant C |
| Plot type | Count rate plots | Images |
|---|---|---|
| Comparison with Poisson distribution Blue bars denote a histogram of data divided into 1 sec bins. Red curve is a Poisson curve with rate = median count rate of data. |
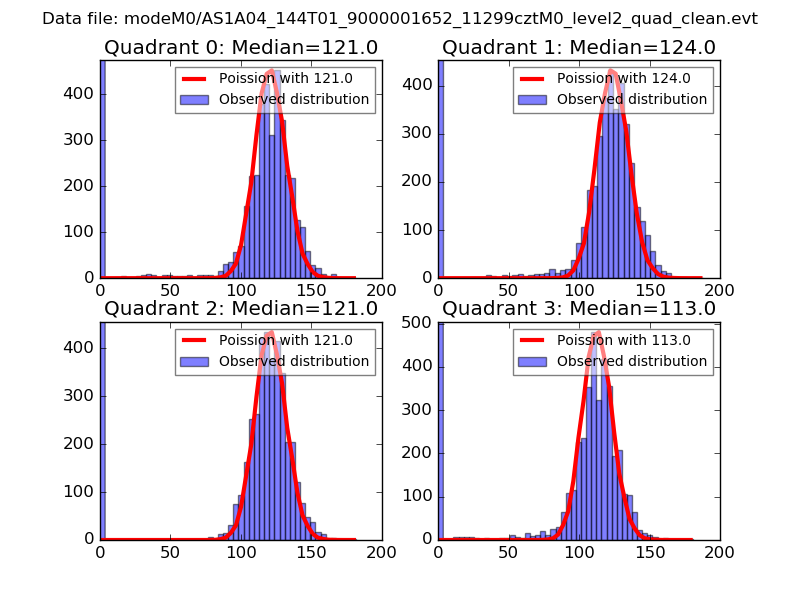 |
 |
| Quadrant-wise count rates Data is divided into 100 sec bins |
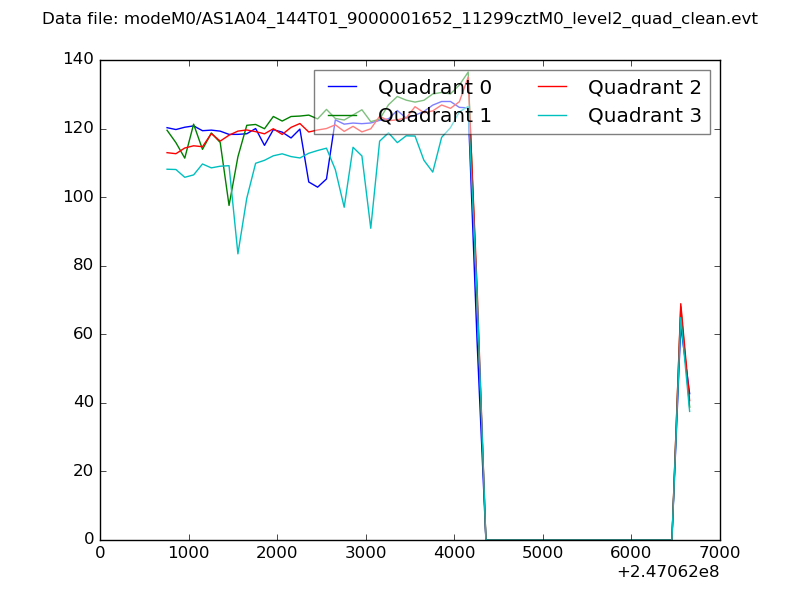 |
|
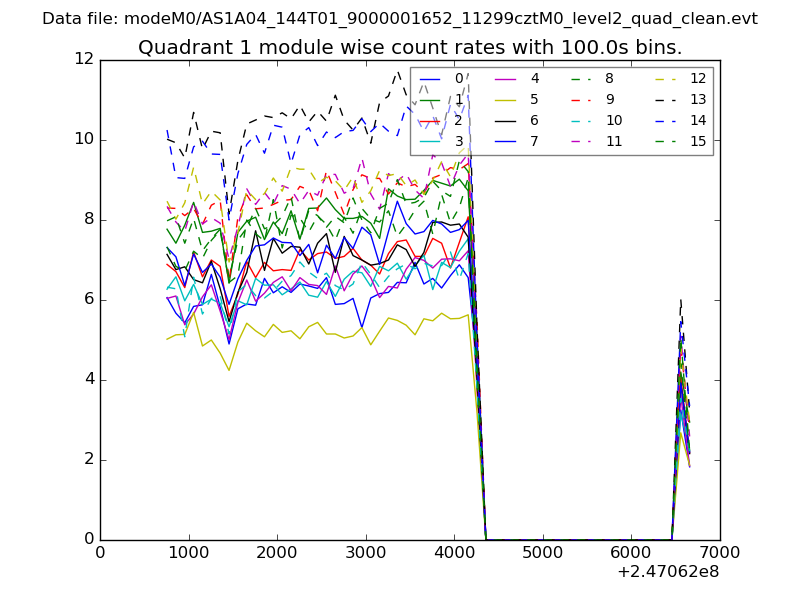
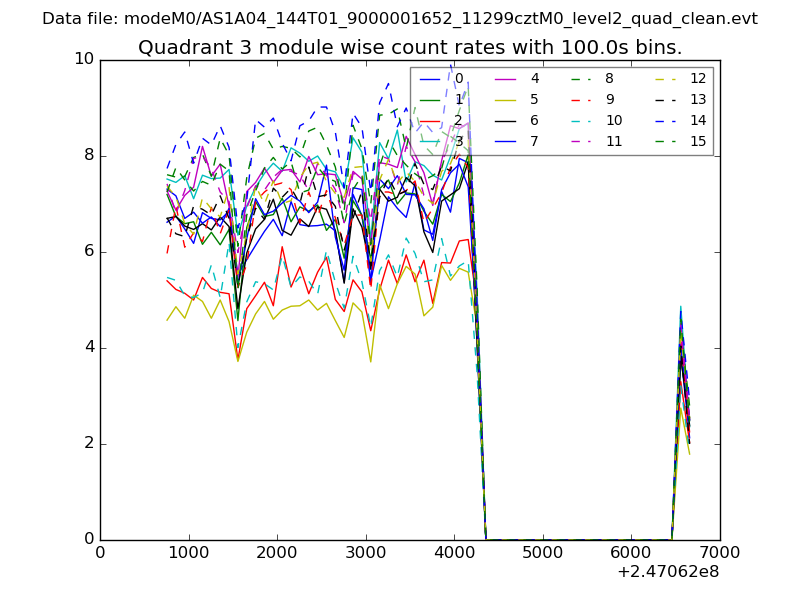
| Module-wise count rates for Quadrant A Data is divided into 100 sec bins |
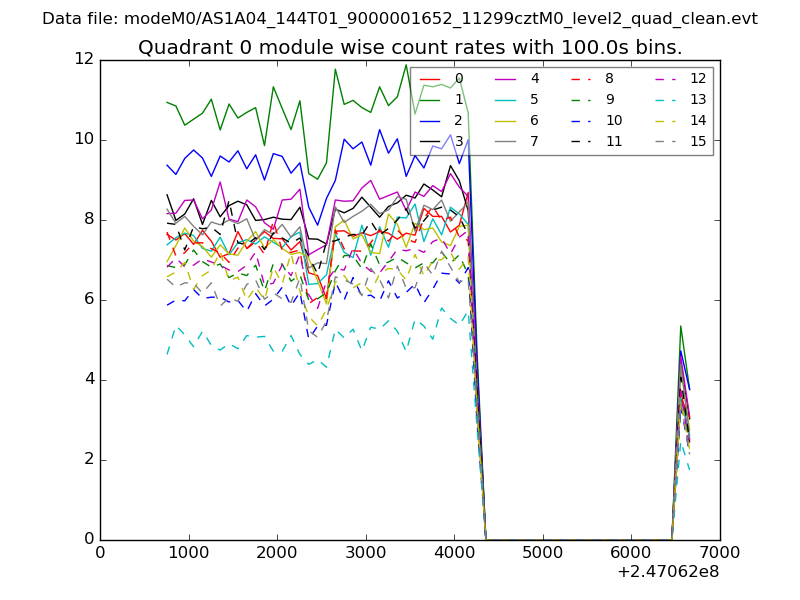 |
 |
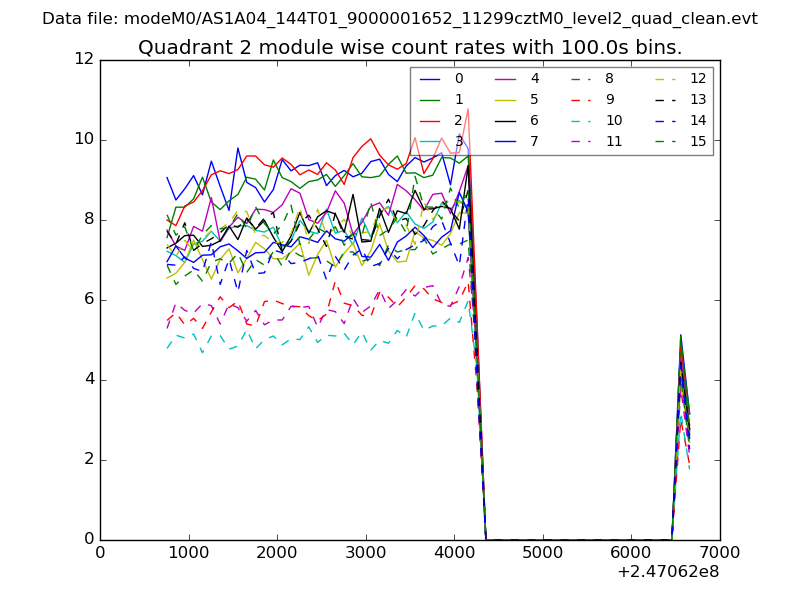
| Module-wise count rates for Quadrant B Data is divided into 100 sec bins |
 |
 |
| Module-wise count rates for Quadrant C Data is divided into 100 sec bins |
 |
 |
| Module-wise count rates for Quadrant D Data is divided into 100 sec bins |
 |
 |
| Parameter | Plot |
|---|---|
| CZT HV Monitor | 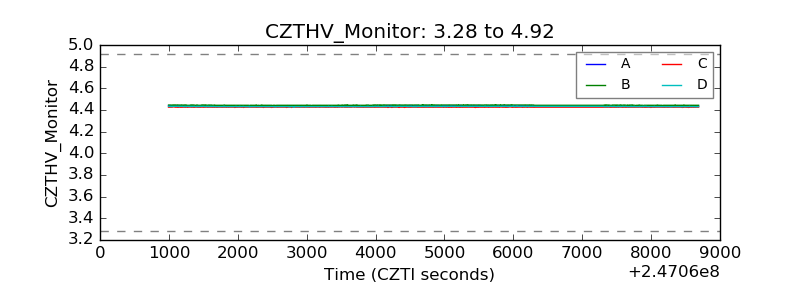 |
| D_VDD | 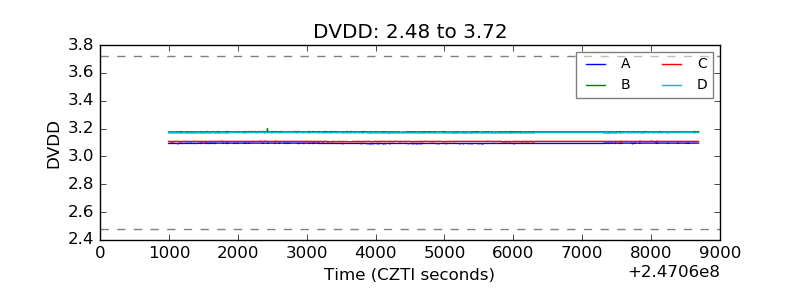 |
| Temperature 1 | 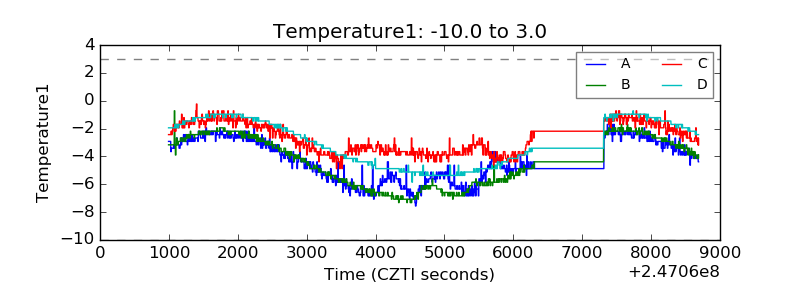 |
| Veto HV Monitor | 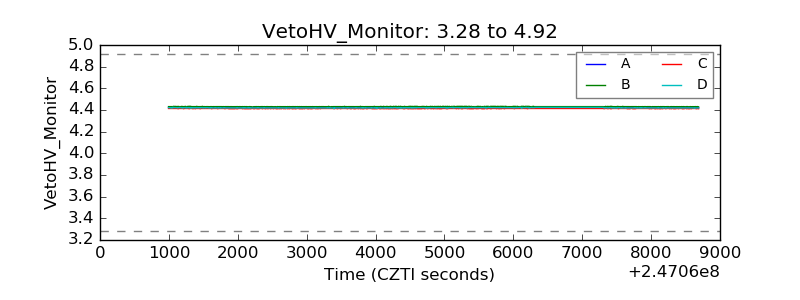 |
| Veto LLD | 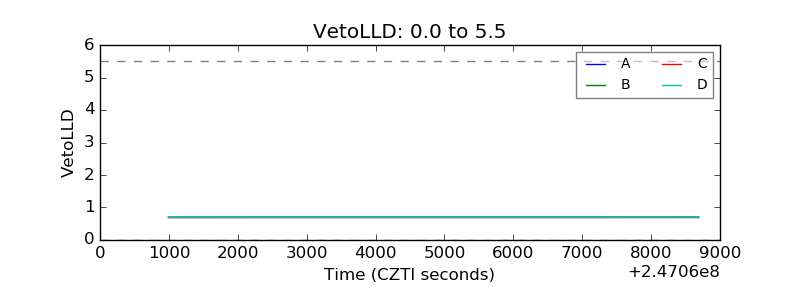 |
| Alpha Counter | 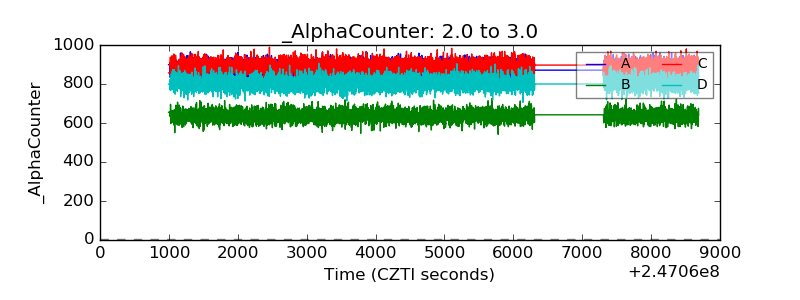 |
| _CPM_Rate | 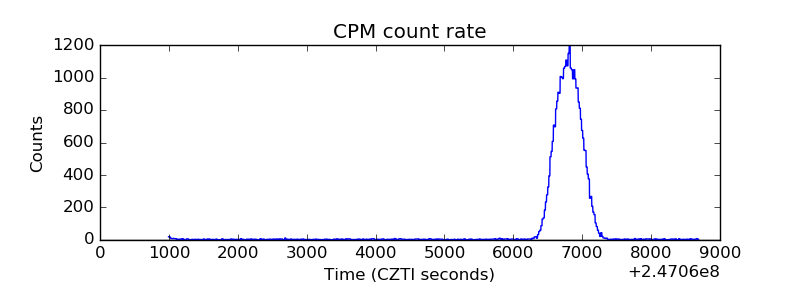 |
| CZT Counter | 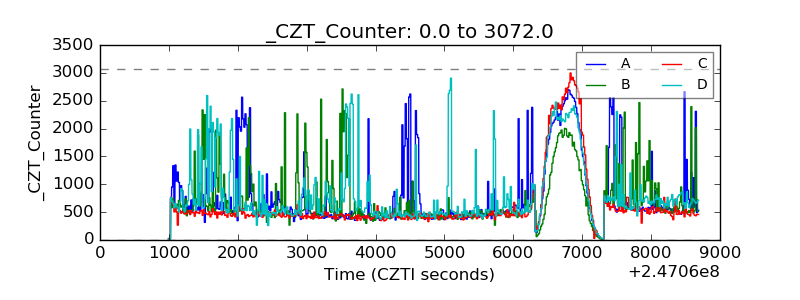 |
| +2.5 Volts monitor |  |
| +5 Volts monitor |  |
| _ROLL_ROT | 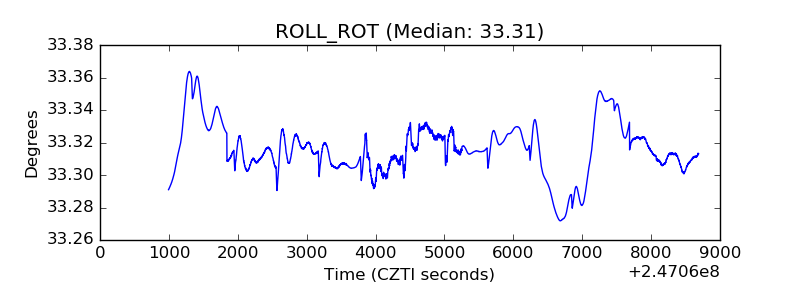 |
| _Roll_DEC | 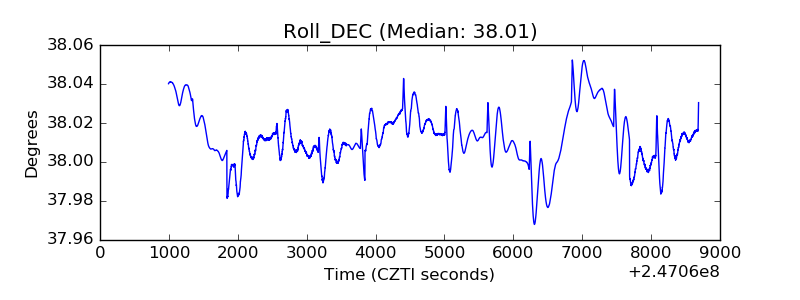 |
| _Roll_RA | 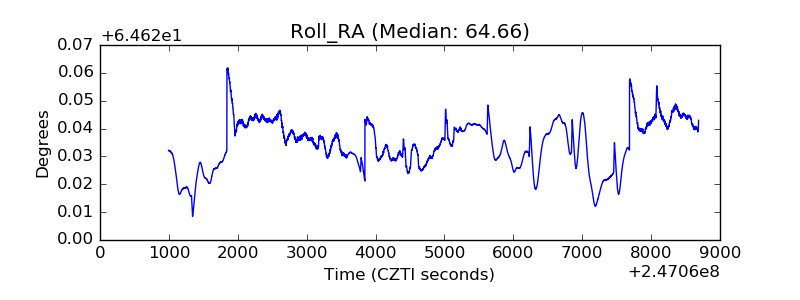 |
| Veto Counter | 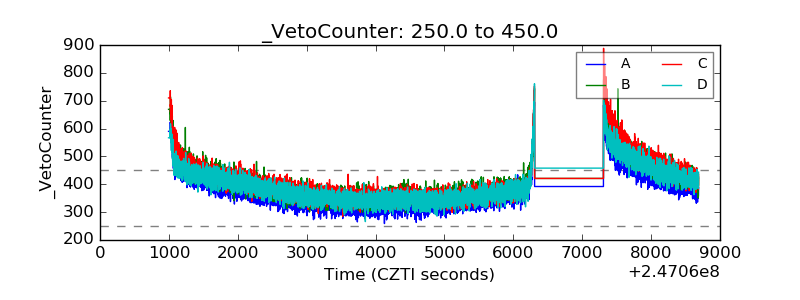 |