| Param | Original file | Final file |
|---|---|---|
| Filename | modeM0/AS1A04_144T01_9000001652_11303cztM0_level2.evt | modeM0/AS1A04_144T01_9000001652_11303cztM0_level2_quad_clean.evt |
| Size (bytes) | 690,318,720 | 100,897,920 |
| Size | 658.3 MB | 96.2 MB |
| Events in quadrant A | 4,839,686 | 672,646 |
| Events in quadrant B | 4,710,718 | 696,434 |
| Events in quadrant C | 3,246,780 | 699,599 |
| Events in quadrant D | 7,673,354 | 536,538 |
| Mode SS | |||
|---|---|---|---|
| Quadrant | BADHDUFLAG | Total packets | Discarded packets |
| A | 0 | 134 | 0 |
| B | 0 | 134 | 0 |
| C | 0 | 134 | 0 |
| D | 0 | 134 | 0 |
| Mode M0 | |||
|---|---|---|---|
| Quadrant | BADHDUFLAG | Total packets | Discarded packets |
| A | 0 | 18759 | 3 |
| B | 0 | 18344 | 2 |
| C | 0 | 13886 | 2 |
| D | 0 | 27180 | 2 |
| Mode M9 | |||
|---|---|---|---|
| Quadrant | BADHDUFLAG | Total packets | Discarded packets |
| A | 0 | 24 | 0 |
| B | 0 | 24 | 0 |
| C | 0 | 24 | 0 |
| D | 0 | 24 | 0 |
| Quadrant | Total seconds | Saturated seconds | Saturation percentage |
|---|---|---|---|
| A | 6444 | 468 | 7.262570% |
| B | 6444 | 591 | 9.171322% |
| C | 6444 | 79 | 1.225947% |
| D | 6444 | 1539 | 23.882682% |
Noise dominated data is calculated using 1-second bins in cleaned event files. If a bin has >2000 counts, and if more than 50% of those come from <1% of pixels, then it is considered to be noise-dominated and hence unusable.
| Quadrant | # 1 sec bins | Bins with >0 counts | Bins with >2000 counts | High rate bins dominated by noise | Noise dominated (total time) | Noise dominated (detector-on time) | Marked lightcurve |
|---|---|---|---|---|---|---|---|
| A | 8970 | 6446 | 281 | 281 | 3.13% | 4.36% | 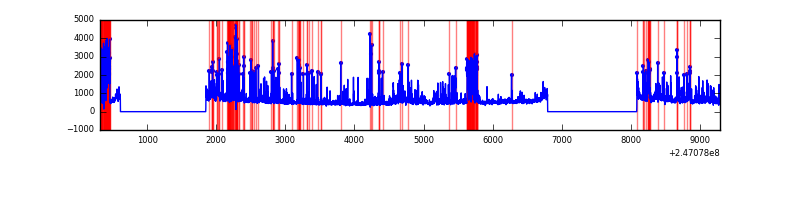 |
| B | 8970 | 6446 | 296 | 296 | 3.30% | 4.59% | 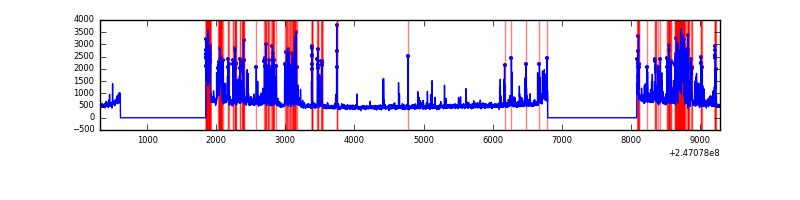 |
| C | 8970 | 6446 | 0 | 0 | 0.00% | 0.00% | 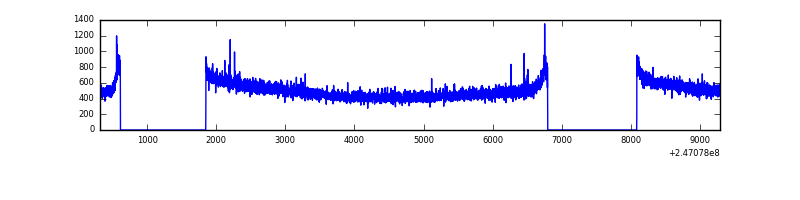 |
| D | 8970 | 6446 | 1298 | 1298 | 14.47% | 20.14% | 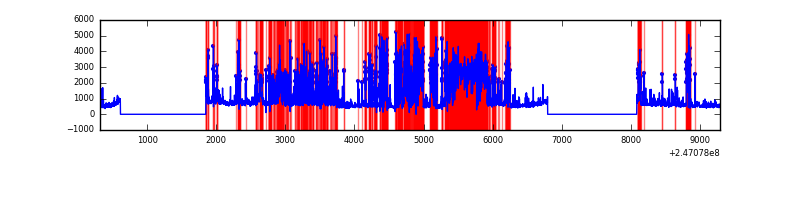 |
Top three noisy pixels from each quadrant. If the there are fewer than three noisy pixels in the level2.evt file, extra rows are filled as -1
| Pixel properties | Quadrant properties | ||||||
|---|---|---|---|---|---|---|---|
| Quadrant | DetID | PixID | Counts | Sigma | Mean | Median | Sigma |
| A | 8 | 5 | 1383449 | 8426.9 | 812 | 797 | 164.1 |
| A | 0 | 8 | 249325 | 1514.71 | 812 | 797 | 164.1 |
| A | 8 | 6 | 21768 | 127.81 | 812 | 797 | 164.1 |
| B | 4 | 239 | 1392272 | 8949.5 | 816 | 799 | 155.5 |
| B | 0 | 219 | 32348 | 202.91 | 816 | 799 | 155.5 |
| B | 3 | 189 | 26419 | 164.78 | 816 | 799 | 155.5 |
| C | 14 | 234 | 6528 | 29.7 | 831 | 838 | 191.6 |
| C | 13 | 61 | 5980 | 26.84 | 831 | 838 | 191.6 |
| C | 5 | 128 | 2438 | 8.35 | 831 | 838 | 191.6 |
| D | 10 | 253 | 3165631 | 18145.11 | 722 | 701 | 174.4 |
| D | 7 | 80 | 856071 | 4903.99 | 722 | 701 | 174.4 |
| D | 8 | 195 | 429043 | 2455.76 | 722 | 701 | 174.4 |
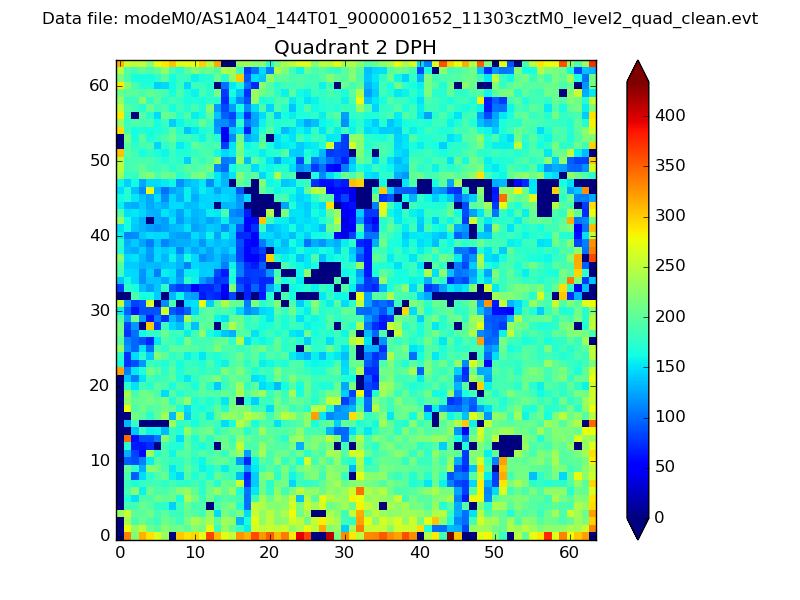
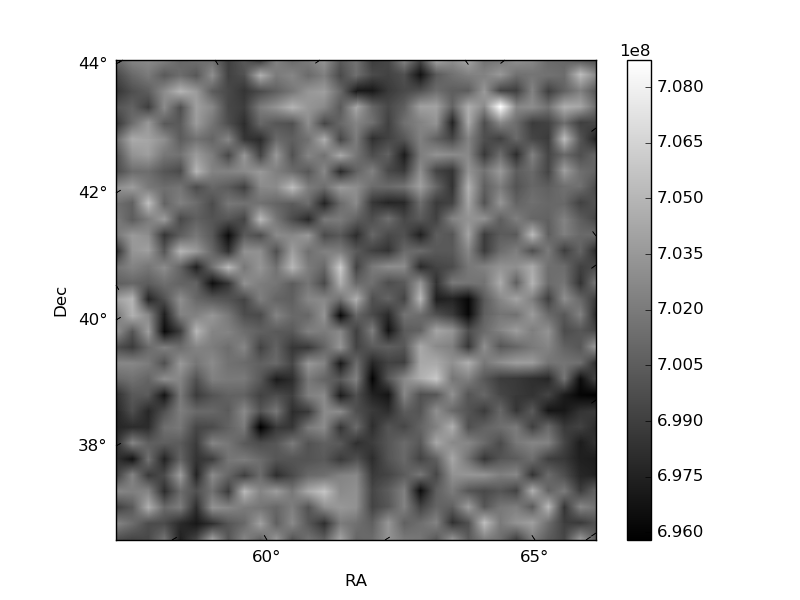
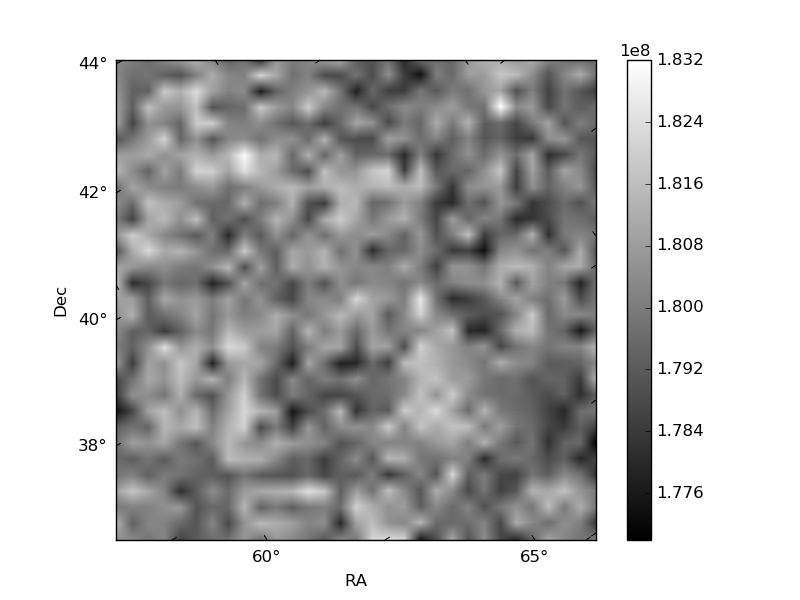
Histogram calculated using DETX and DETY for each event in the final _common_clean file
| Quadrant A | 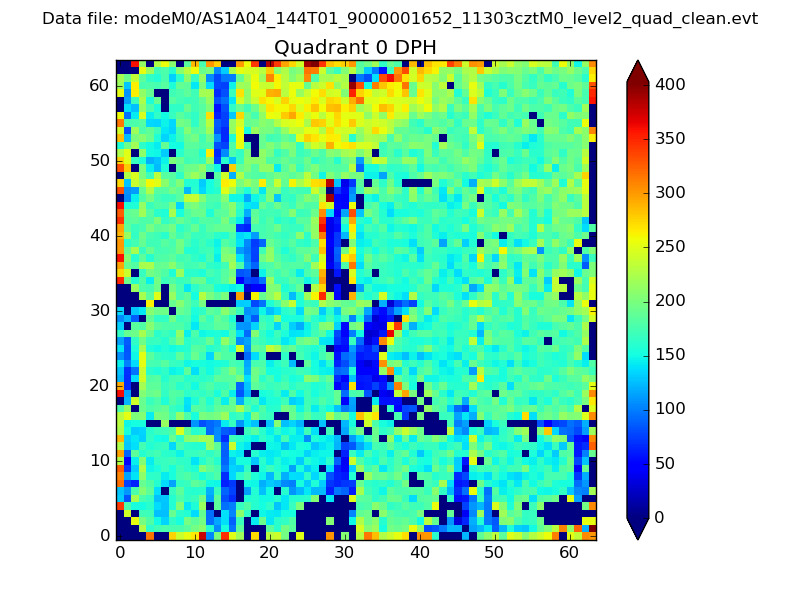 |
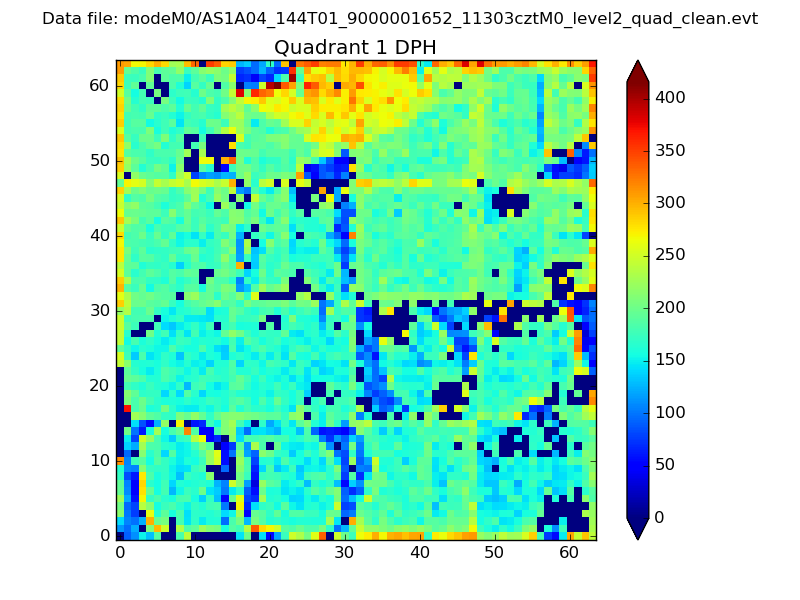 |
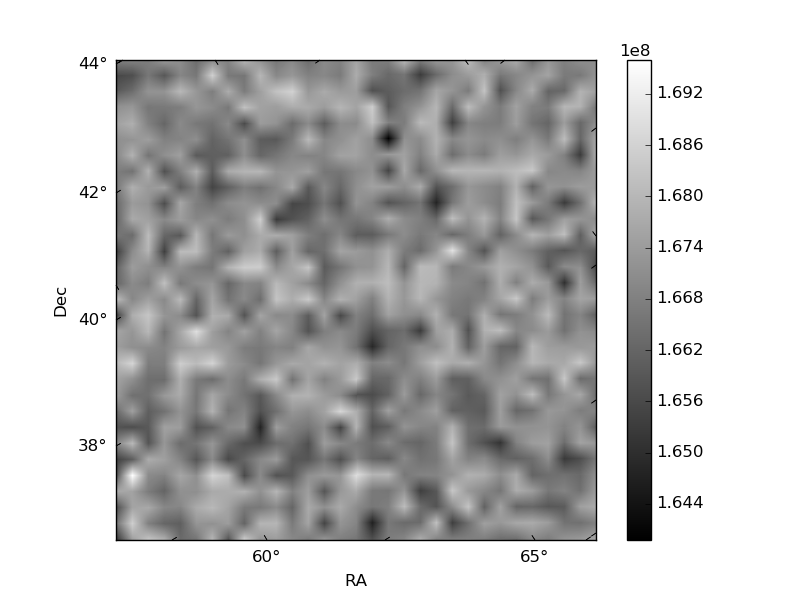
Quadrant B |
|---|---|---|---|
| Quadrant D | 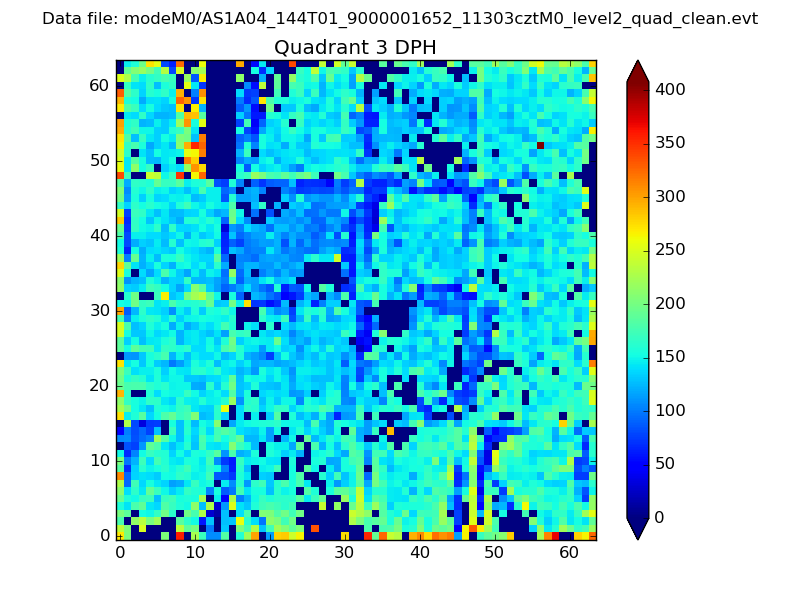 |
 |
Quadrant C |
| Plot type | Count rate plots | Images |
|---|---|---|
| Comparison with Poisson distribution Blue bars denote a histogram of data divided into 1 sec bins. Red curve is a Poisson curve with rate = median count rate of data. |
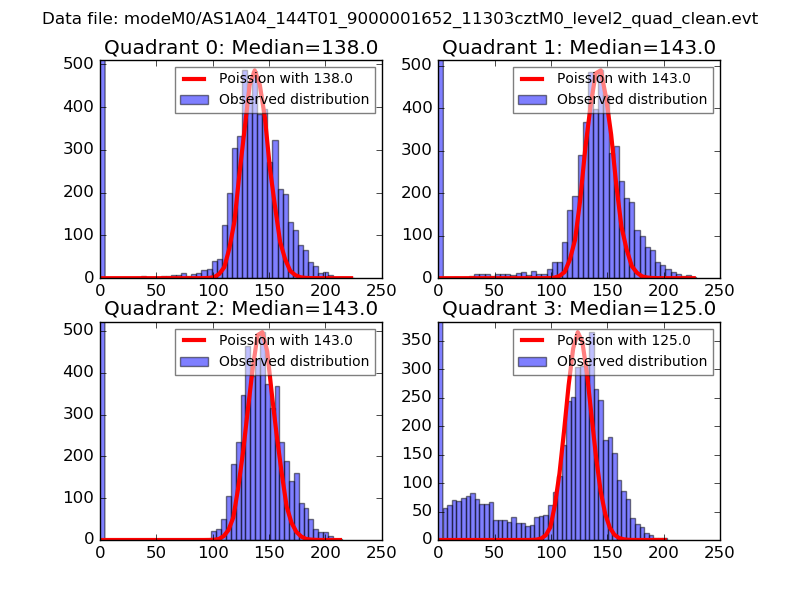 |
 |
| Quadrant-wise count rates Data is divided into 100 sec bins |
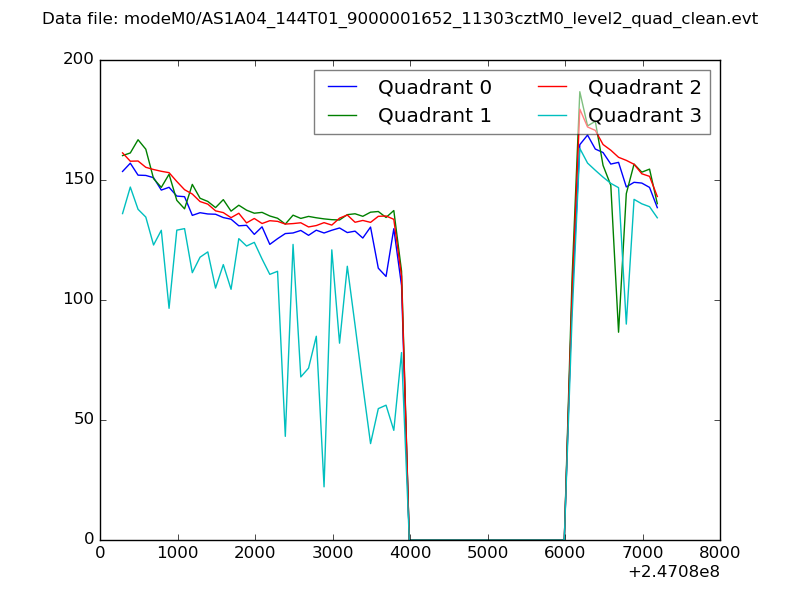 |
|
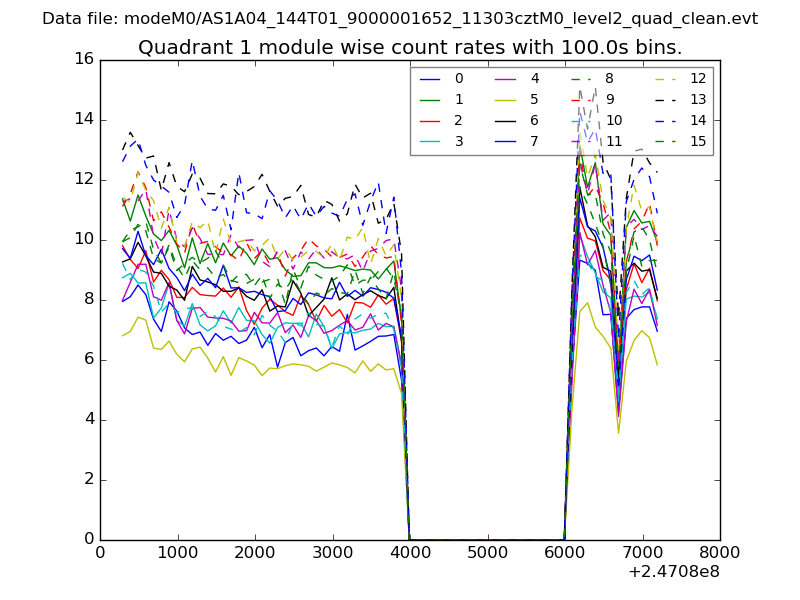
| Module-wise count rates for Quadrant A Data is divided into 100 sec bins |
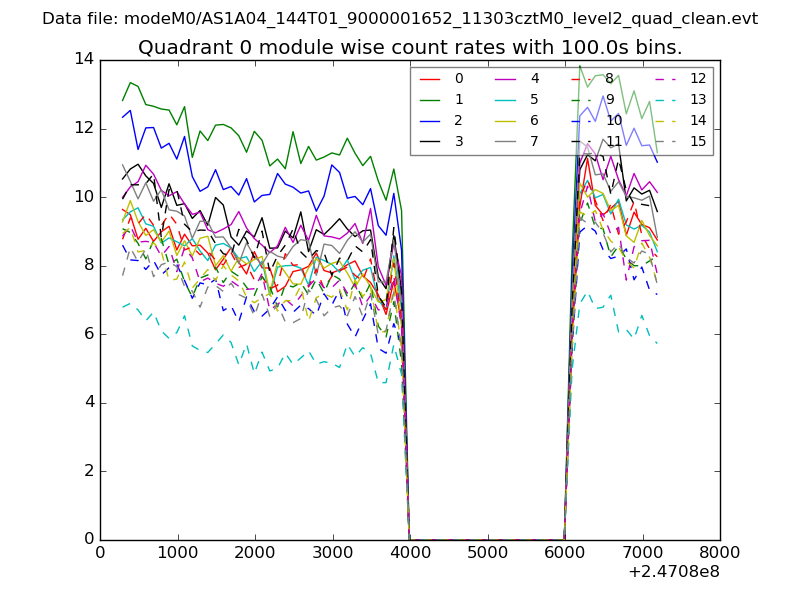 |
 |
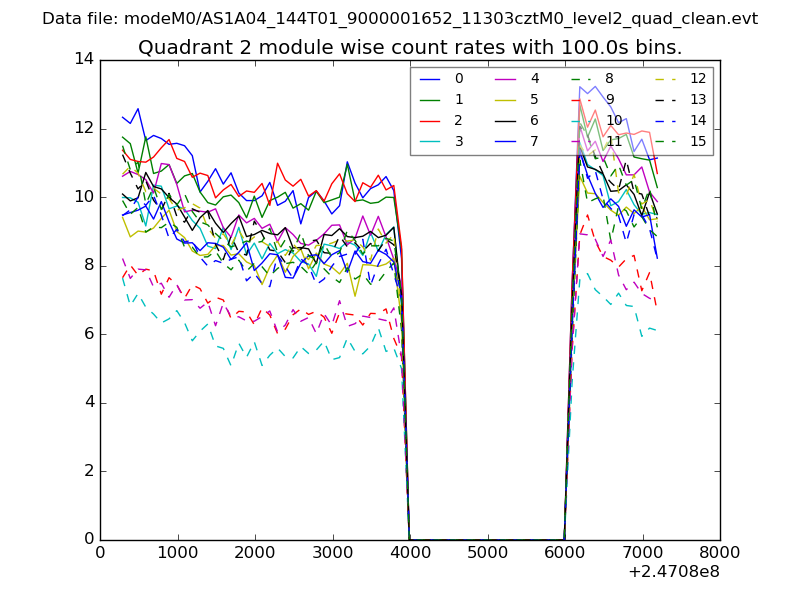
| Module-wise count rates for Quadrant B Data is divided into 100 sec bins |
 |
 |
| Module-wise count rates for Quadrant C Data is divided into 100 sec bins |
 |
 |
| Module-wise count rates for Quadrant D Data is divided into 100 sec bins |
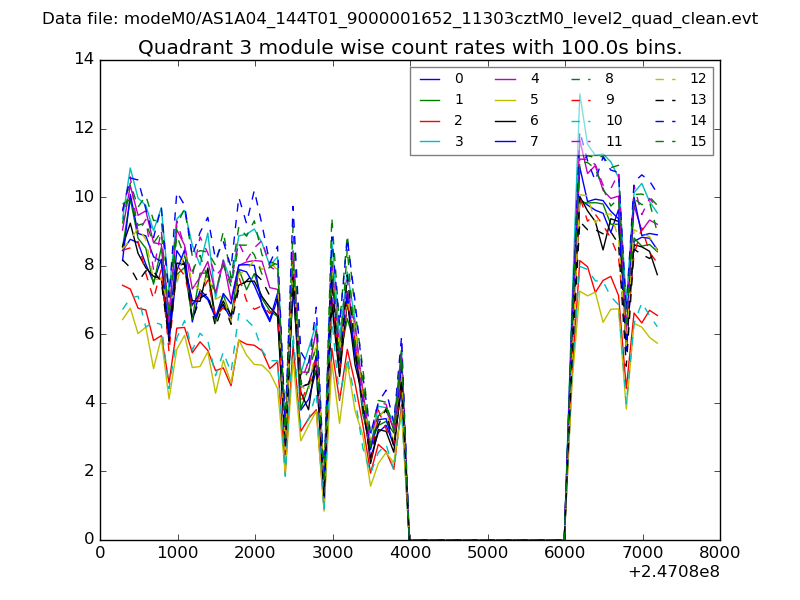 |
 |
| Parameter | Plot |
|---|---|
| CZT HV Monitor | 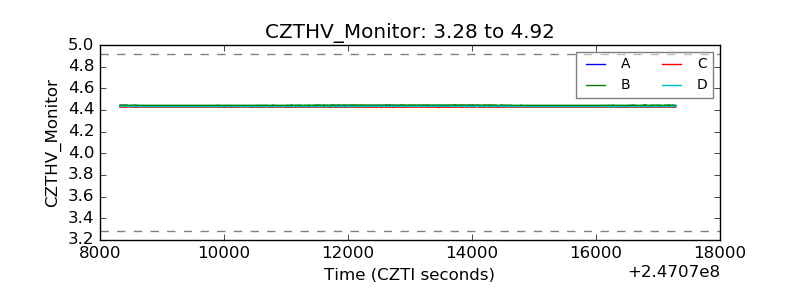 |
| D_VDD | 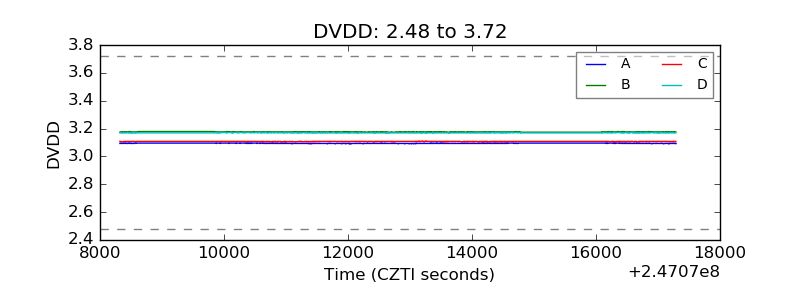 |
| Temperature 1 | 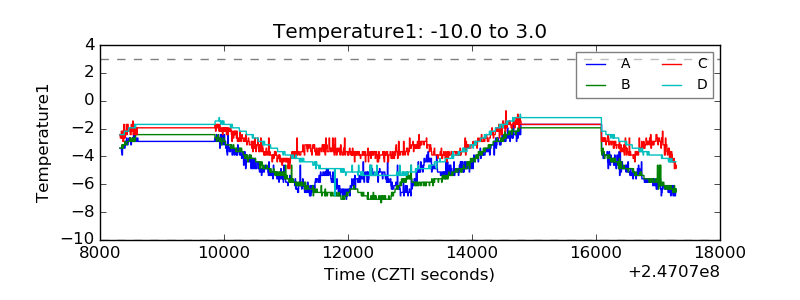 |
| Veto HV Monitor | 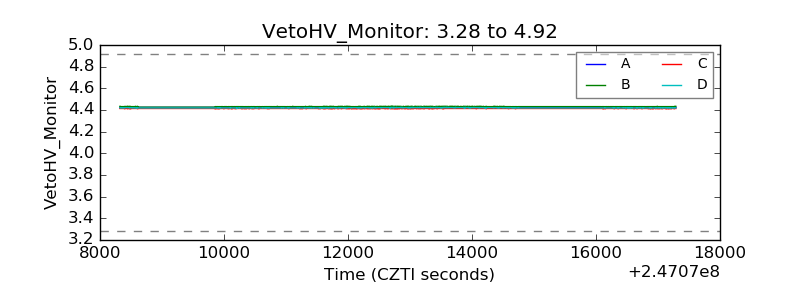 |
| Veto LLD | 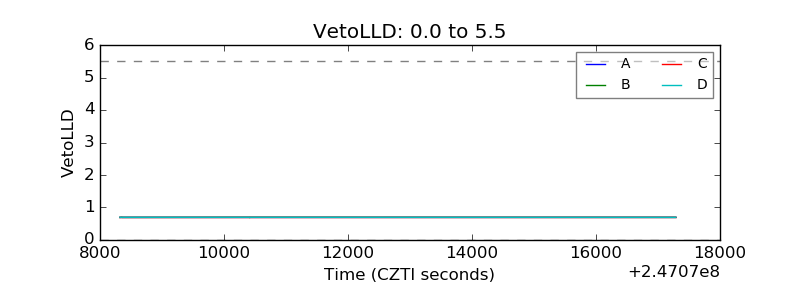 |
| Alpha Counter | 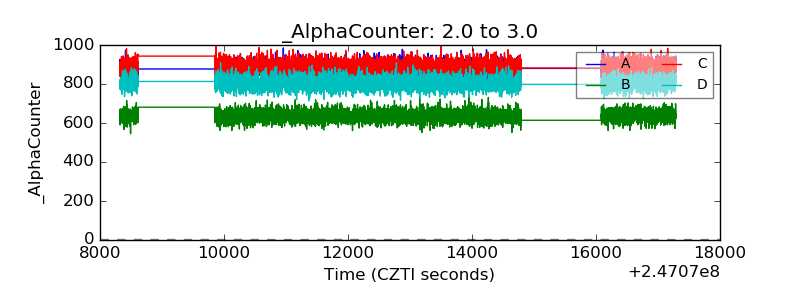 |
| _CPM_Rate | 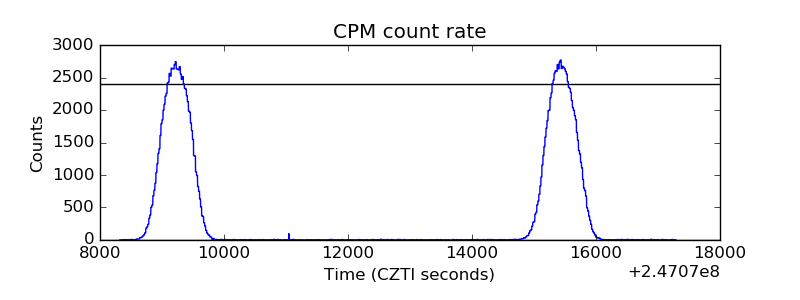 |
| CZT Counter | 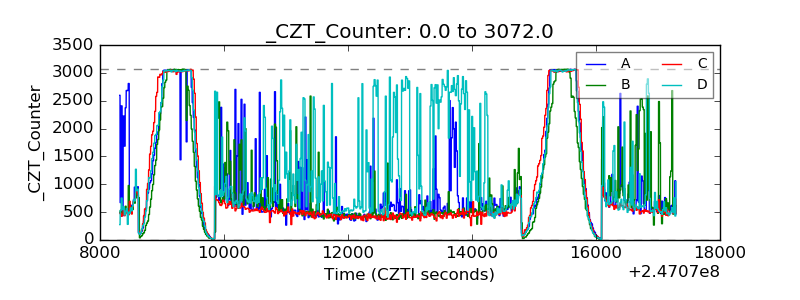 |
| +2.5 Volts monitor |  |
| +5 Volts monitor |  |
| _ROLL_ROT | 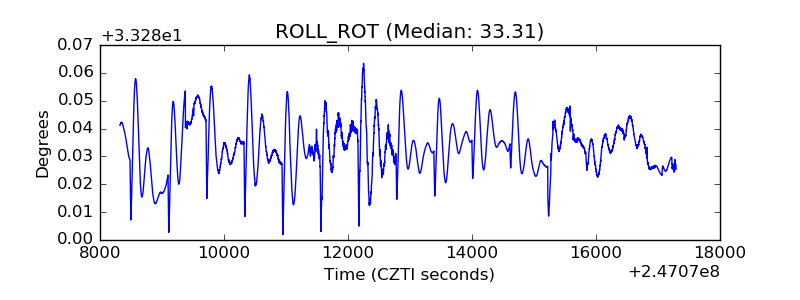 |
| _Roll_DEC | 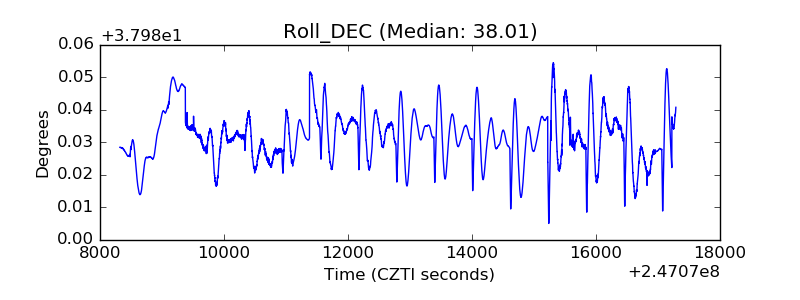 |
| _Roll_RA |  |
| Veto Counter | 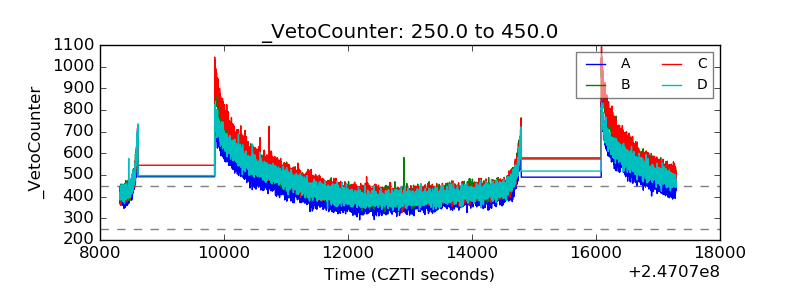 |