| Param | Original file | Final file |
|---|---|---|
| Filename | modeM0/AS1A04_144T01_9000001652_11304cztM0_level2.evt | modeM0/AS1A04_144T01_9000001652_11304cztM0_level2_quad_clean.evt |
| Size (bytes) | 543,124,800 | 104,328,000 |
| Size | 518.0 MB | 99.5 MB |
| Events in quadrant A | 3,776,366 | 692,990 |
| Events in quadrant B | 4,618,767 | 703,554 |
| Events in quadrant C | 3,017,554 | 712,649 |
| Events in quadrant D | 4,619,664 | 621,692 |
| Mode SS | |||
|---|---|---|---|
| Quadrant | BADHDUFLAG | Total packets | Discarded packets |
| A | 0 | 126 | 0 |
| B | 0 | 126 | 0 |
| C | 0 | 126 | 0 |
| D | 0 | 126 | 0 |
| Mode M0 | |||
|---|---|---|---|
| Quadrant | BADHDUFLAG | Total packets | Discarded packets |
| A | 0 | 15271 | 3 |
| B | 0 | 17799 | 2 |
| C | 0 | 13015 | 2 |
| D | 0 | 17803 | 2 |
| Mode M9 | |||
|---|---|---|---|
| Quadrant | BADHDUFLAG | Total packets | Discarded packets |
| A | 0 | 18 | 0 |
| B | 0 | 18 | 0 |
| C | 0 | 18 | 0 |
| D | 0 | 19 | 0 |
| Quadrant | Total seconds | Saturated seconds | Saturation percentage |
|---|---|---|---|
| A | 6133 | 128 | 2.087070% |
| B | 6133 | 617 | 10.060329% |
| C | 6133 | 42 | 0.684820% |
| D | 6133 | 554 | 9.033100% |
Noise dominated data is calculated using 1-second bins in cleaned event files. If a bin has >2000 counts, and if more than 50% of those come from <1% of pixels, then it is considered to be noise-dominated and hence unusable.
| Quadrant | # 1 sec bins | Bins with >0 counts | Bins with >2000 counts | High rate bins dominated by noise | Noise dominated (total time) | Noise dominated (detector-on time) | Marked lightcurve |
|---|---|---|---|---|---|---|---|
| A | 7443 | 6134 | 37 | 37 | 0.50% | 0.60% |  |
| B | 7443 | 6134 | 288 | 288 | 3.87% | 4.70% | 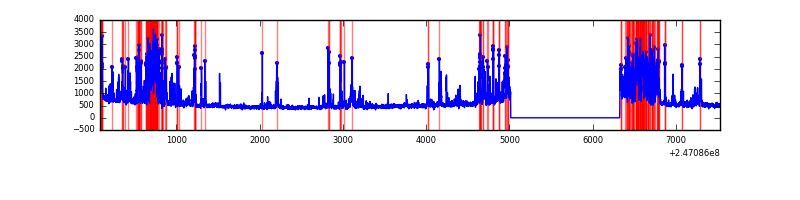 |
| C | 7443 | 6134 | 0 | 0 | 0.00% | 0.00% | 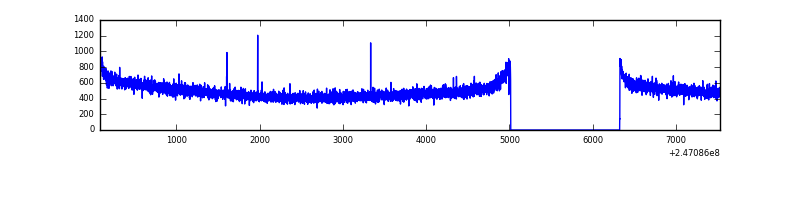 |
| D | 7443 | 6134 | 434 | 434 | 5.83% | 7.08% |  |
Top three noisy pixels from each quadrant. If the there are fewer than three noisy pixels in the level2.evt file, extra rows are filled as -1
| Pixel properties | Quadrant properties | ||||||
|---|---|---|---|---|---|---|---|
| Quadrant | DetID | PixID | Counts | Sigma | Mean | Median | Sigma |
| A | 8 | 5 | 698840 | 4449.62 | 771 | 758 | 156.9 |
| A | 0 | 8 | 45262 | 283.67 | 771 | 758 | 156.9 |
| A | 1 | 162 | 17281 | 105.32 | 771 | 758 | 156.9 |
| B | 4 | 239 | 1372464 | 9557.84 | 760 | 744 | 143.5 |
| B | 3 | 189 | 96588 | 667.82 | 760 | 744 | 143.5 |
| B | 3 | 64 | 89800 | 620.52 | 760 | 744 | 143.5 |
| C | 13 | 61 | 5689 | 27.59 | 773 | 779 | 177.9 |
| C | 14 | 234 | 3000 | 12.48 | 773 | 779 | 177.9 |
| C | 12 | 4 | 2323 | 8.68 | 773 | 779 | 177.9 |
| D | 10 | 253 | 1269610 | 7413.91 | 717 | 699 | 171.2 |
| D | 7 | 80 | 144962 | 842.89 | 717 | 699 | 171.2 |
| D | 2 | 120 | 113891 | 661.35 | 717 | 699 | 171.2 |
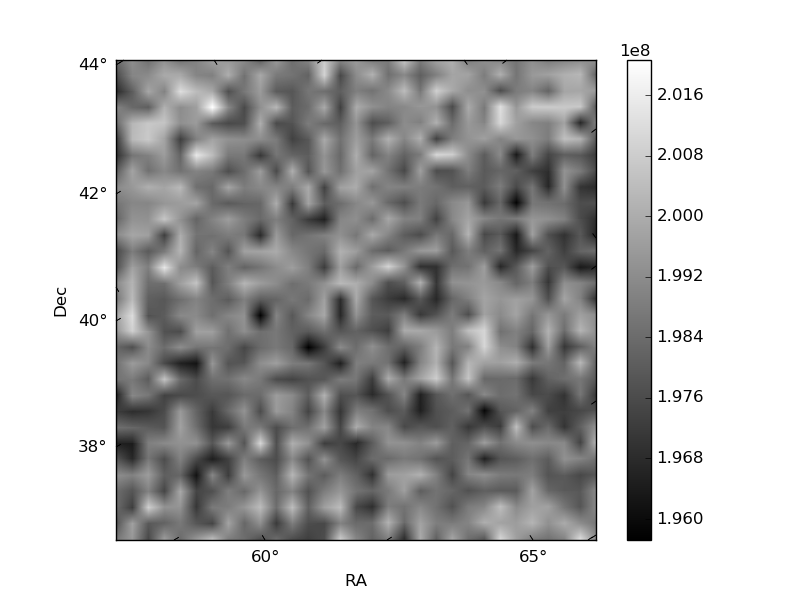
Histogram calculated using DETX and DETY for each event in the final _common_clean file
| Quadrant A | 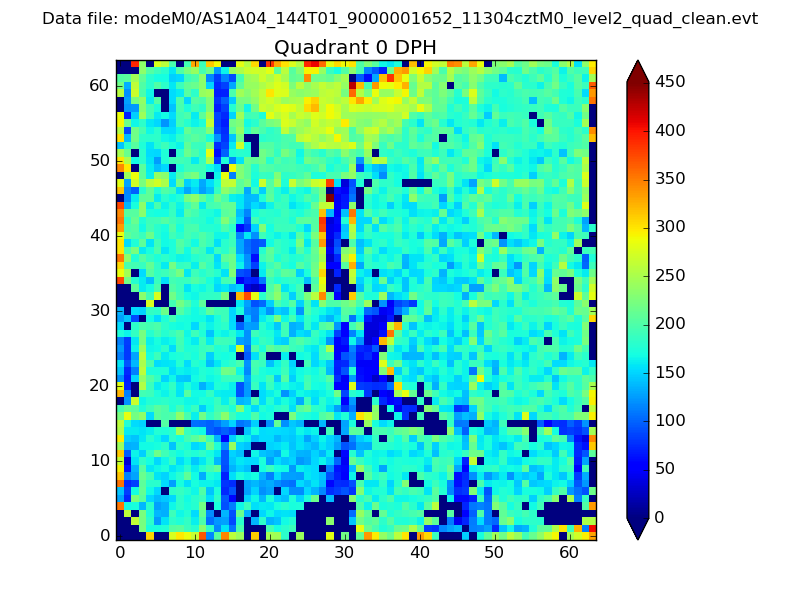 |
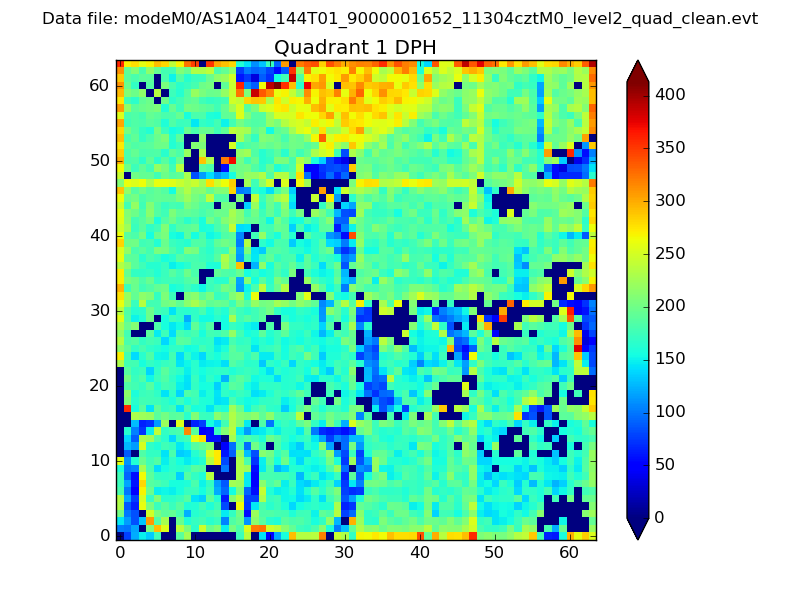 |
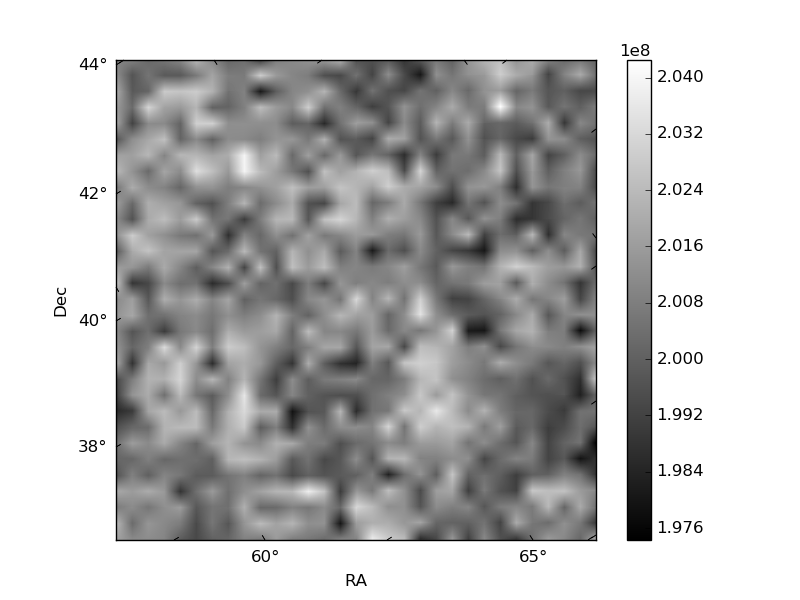
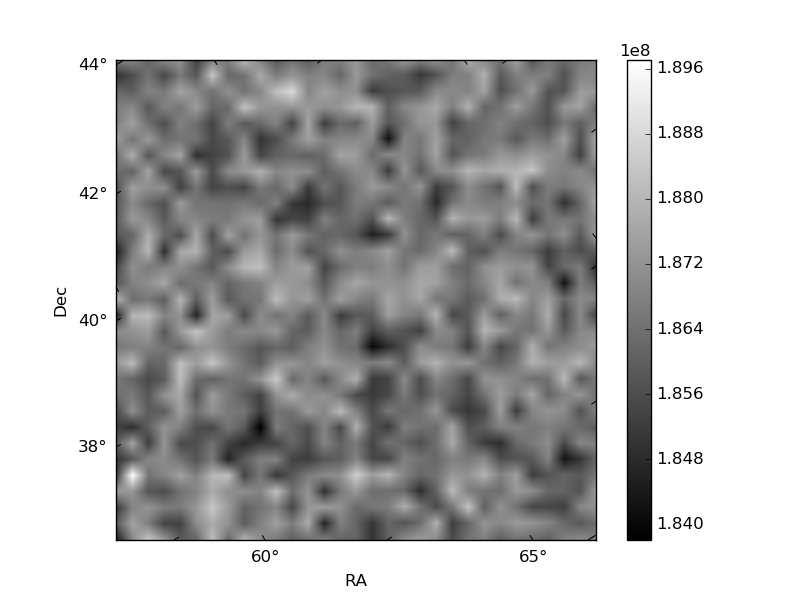
Quadrant B |
|---|---|---|---|
| Quadrant D |  |
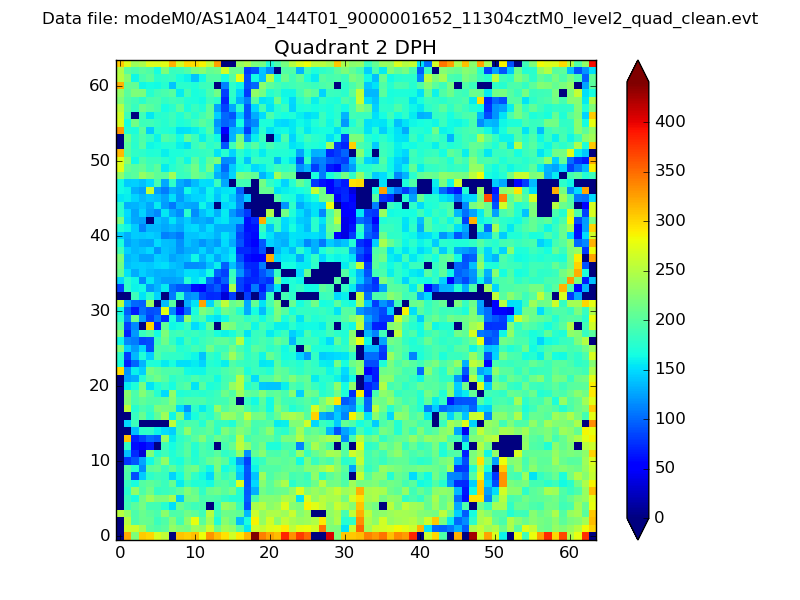 |
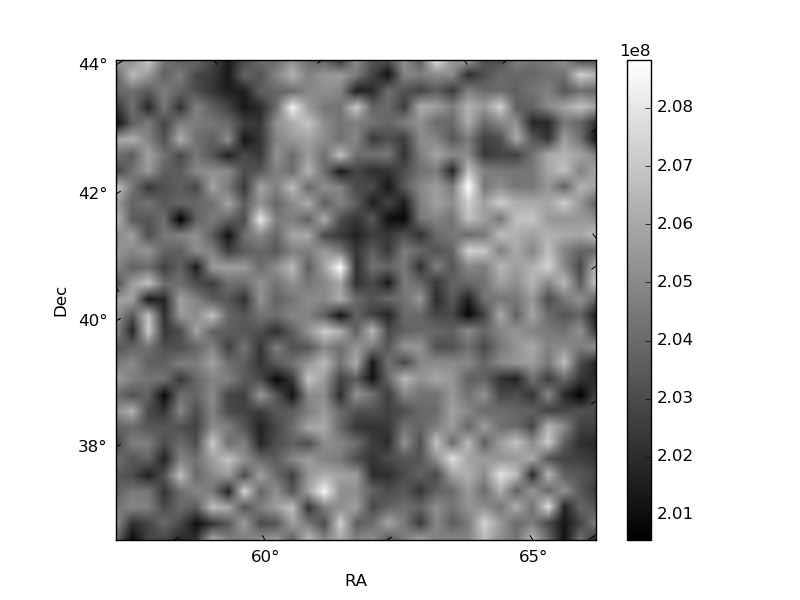
Quadrant C |
| Plot type | Count rate plots | Images |
|---|---|---|
| Comparison with Poisson distribution Blue bars denote a histogram of data divided into 1 sec bins. Red curve is a Poisson curve with rate = median count rate of data. |
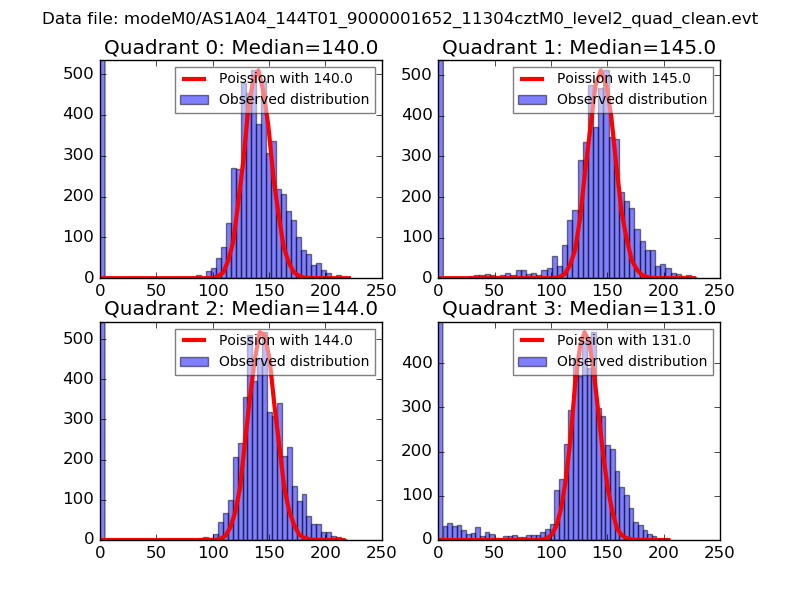 |
 |
| Quadrant-wise count rates Data is divided into 100 sec bins |
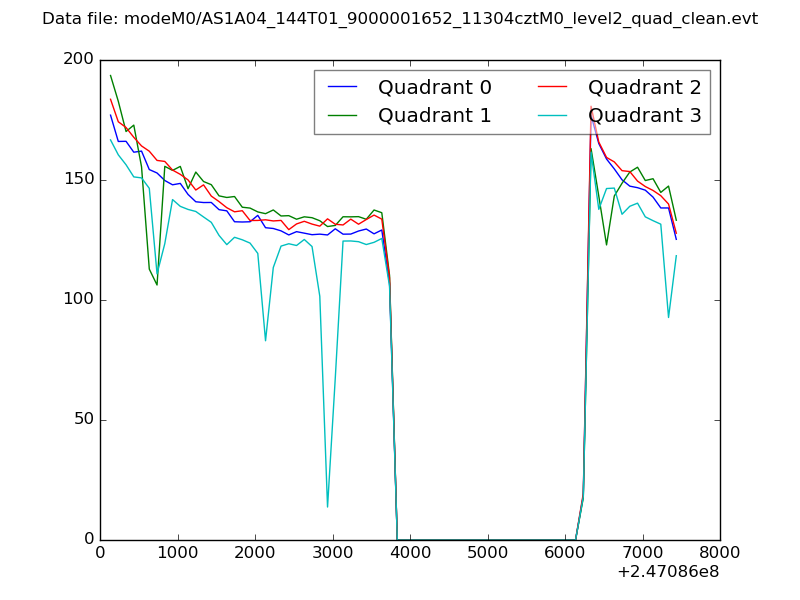 |
|
| Module-wise count rates for Quadrant A Data is divided into 100 sec bins |
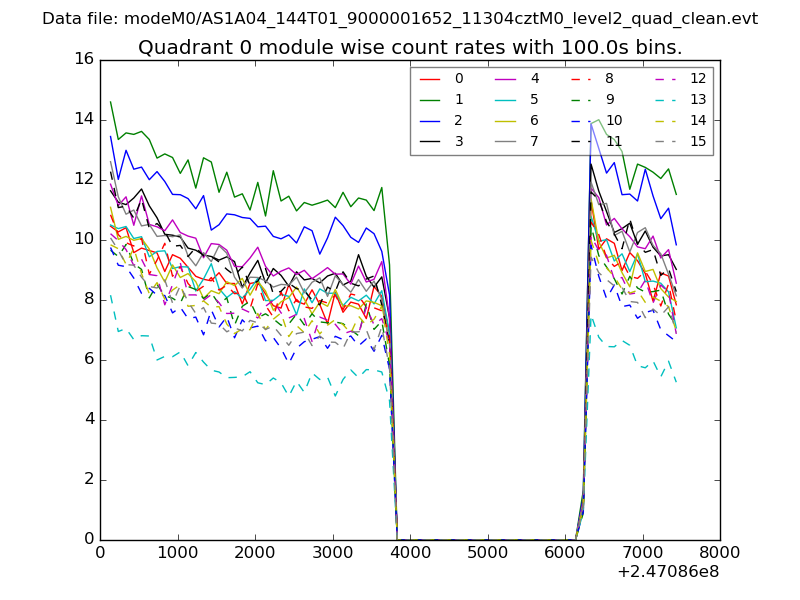 |
 |
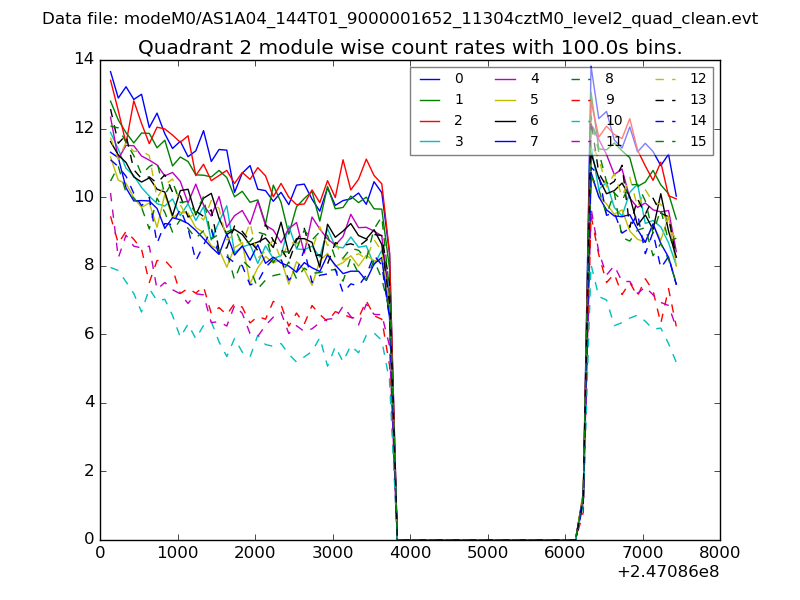
| Module-wise count rates for Quadrant B Data is divided into 100 sec bins |
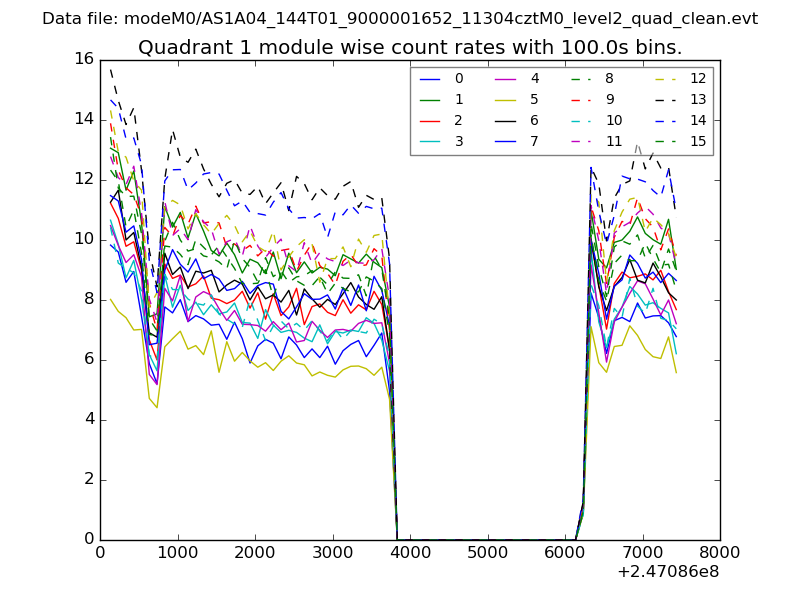 |
 |
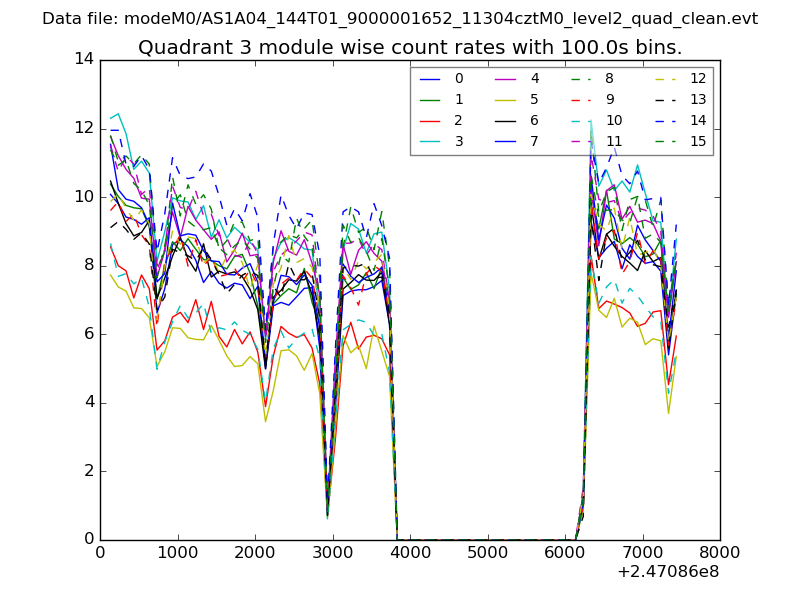
| Module-wise count rates for Quadrant C Data is divided into 100 sec bins |
 |
 |
| Module-wise count rates for Quadrant D Data is divided into 100 sec bins |
 |
 |
| Parameter | Plot |
|---|---|
| CZT HV Monitor | 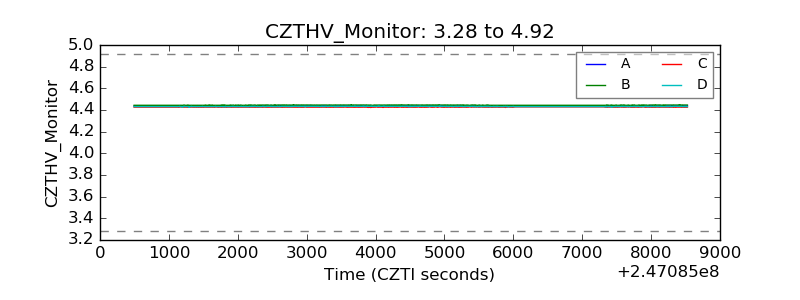 |
| D_VDD | 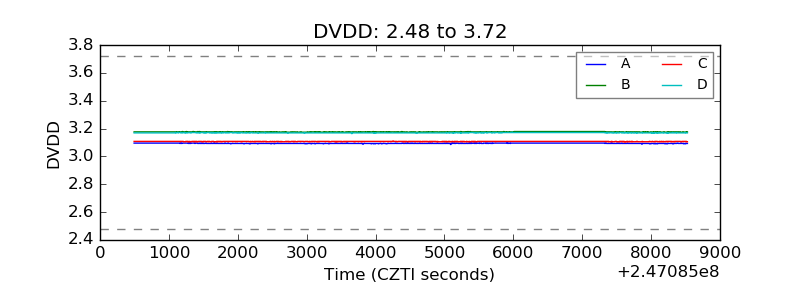 |
| Temperature 1 |  |
| Veto HV Monitor | 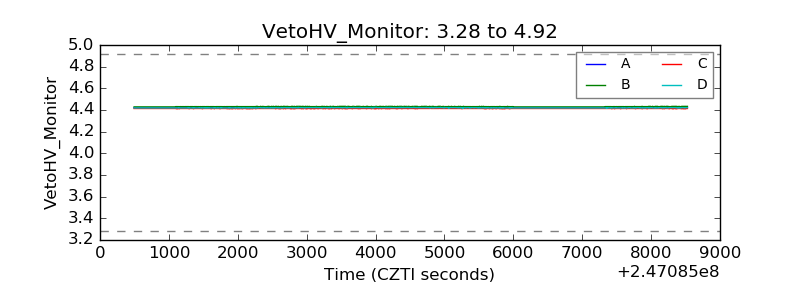 |
| Veto LLD | 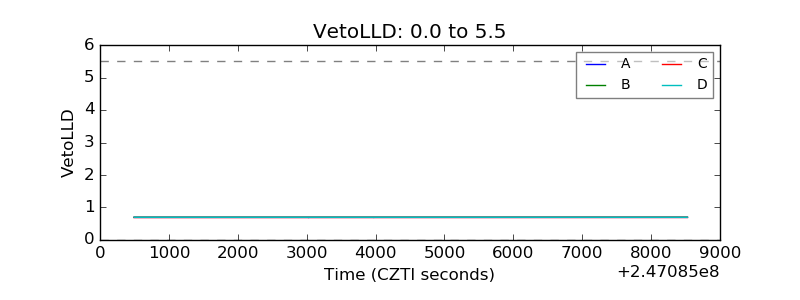 |
| Alpha Counter | 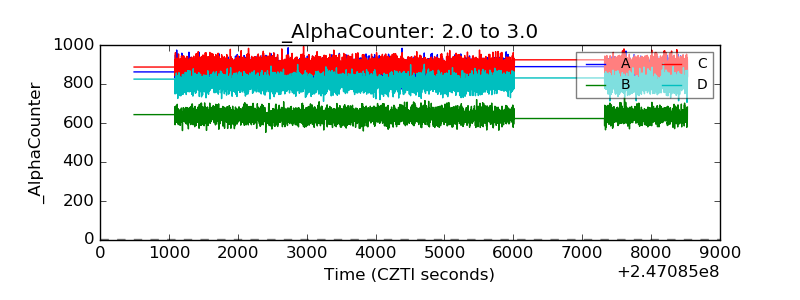 |
| _CPM_Rate | 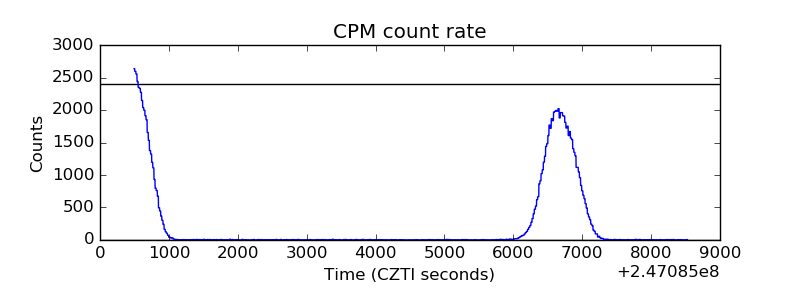 |
| CZT Counter | 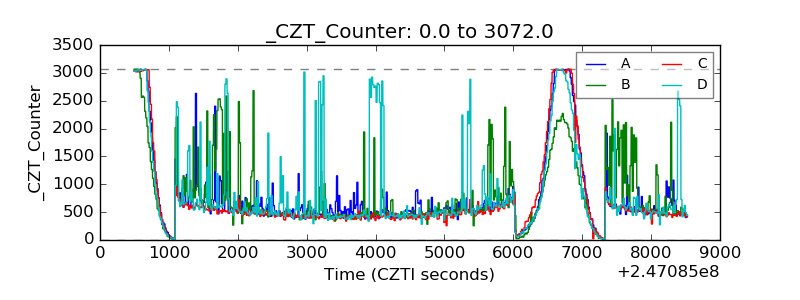 |
| +2.5 Volts monitor | 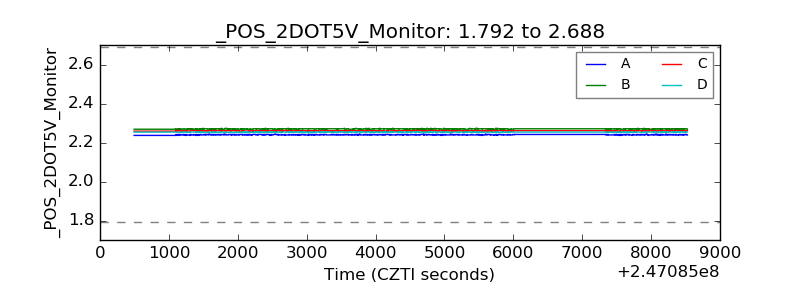 |
| +5 Volts monitor |  |
| _ROLL_ROT | 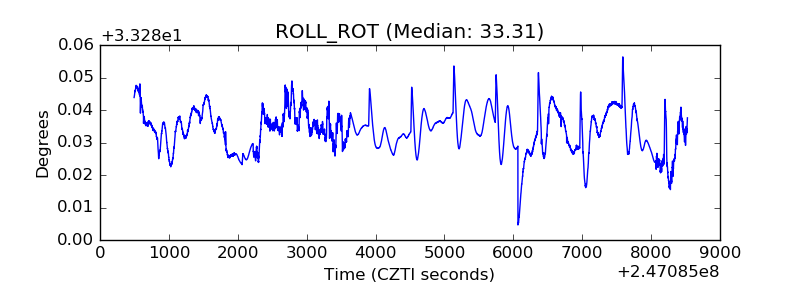 |
| _Roll_DEC | 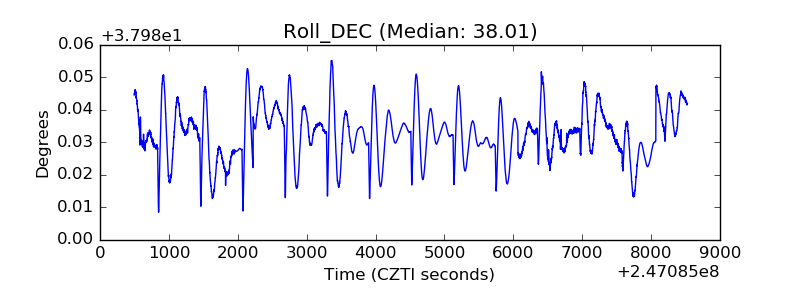 |
| _Roll_RA | 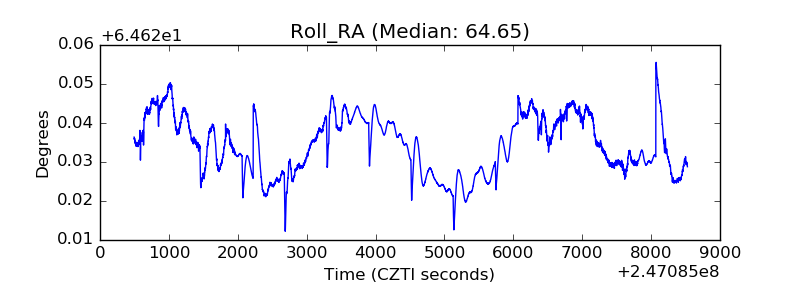 |
| Veto Counter | 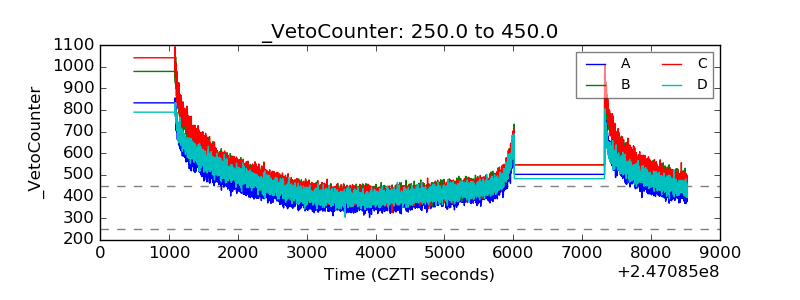 |