| Param | Original file | Final file |
|---|---|---|
| Filename | modeM0/AS1A04_144T01_9000001652_11305cztM0_level2.evt | modeM0/AS1A04_144T01_9000001652_11305cztM0_level2_quad_clean.evt |
| Size (bytes) | 660,067,200 | 94,302,720 |
| Size | 629.5 MB | 89.9 MB |
| Events in quadrant A | 4,559,000 | 613,721 |
| Events in quadrant B | 5,868,393 | 602,587 |
| Events in quadrant C | 3,182,022 | 644,578 |
| Events in quadrant D | 5,933,535 | 533,729 |
| Mode SS | |||
|---|---|---|---|
| Quadrant | BADHDUFLAG | Total packets | Discarded packets |
| A | 0 | 136 | 0 |
| B | 0 | 136 | 0 |
| C | 0 | 136 | 0 |
| D | 0 | 136 | 0 |
| Mode M0 | |||
|---|---|---|---|
| Quadrant | BADHDUFLAG | Total packets | Discarded packets |
| A | 0 | 17932 | 3 |
| B | 0 | 21922 | 2 |
| C | 0 | 13893 | 2 |
| D | 0 | 22117 | 2 |
| Mode M9 | |||
|---|---|---|---|
| Quadrant | BADHDUFLAG | Total packets | Discarded packets |
| A | 0 | 25 | 0 |
| B | 0 | 25 | 0 |
| C | 0 | 25 | 0 |
| D | 0 | 25 | 0 |
| Quadrant | Total seconds | Saturated seconds | Saturation percentage |
|---|---|---|---|
| A | 6605 | 410 | 6.207419% |
| B | 6605 | 1168 | 17.683573% |
| C | 6605 | 70 | 1.059803% |
| D | 6605 | 922 | 13.959122% |
Noise dominated data is calculated using 1-second bins in cleaned event files. If a bin has >2000 counts, and if more than 50% of those come from <1% of pixels, then it is considered to be noise-dominated and hence unusable.
| Quadrant | # 1 sec bins | Bins with >0 counts | Bins with >2000 counts | High rate bins dominated by noise | Noise dominated (total time) | Noise dominated (detector-on time) | Marked lightcurve |
|---|---|---|---|---|---|---|---|
| A | 9155 | 6607 | 261 | 261 | 2.85% | 3.95% |  |
| B | 9155 | 6607 | 615 | 615 | 6.72% | 9.31% |  |
| C | 9155 | 6607 | 0 | 0 | 0.00% | 0.00% |  |
| D | 9155 | 6607 | 719 | 719 | 7.85% | 10.88% | 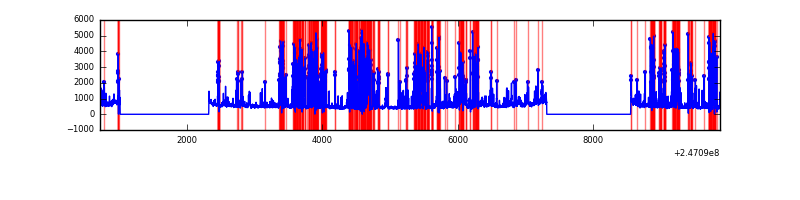 |
Top three noisy pixels from each quadrant. If the there are fewer than three noisy pixels in the level2.evt file, extra rows are filled as -1
| Pixel properties | Quadrant properties | ||||||
|---|---|---|---|---|---|---|---|
| Quadrant | DetID | PixID | Counts | Sigma | Mean | Median | Sigma |
| A | 8 | 5 | 1384577 | 8450.94 | 804 | 788 | 163.7 |
| A | 1 | 162 | 19175 | 112.29 | 804 | 788 | 163.7 |
| A | 13 | 251 | 12864 | 73.75 | 804 | 788 | 163.7 |
| B | 3 | 64 | 1492310 | 10135.38 | 777 | 761 | 147.2 |
| B | 4 | 239 | 1145968 | 7781.92 | 777 | 761 | 147.2 |
| B | 3 | 189 | 96386 | 649.79 | 777 | 761 | 147.2 |
| C | 13 | 61 | 6120 | 27.99 | 814 | 818 | 189.4 |
| C | 9 | 204 | 4960 | 21.86 | 814 | 818 | 189.4 |
| C | 14 | 234 | 2736 | 10.12 | 814 | 818 | 189.4 |
| D | 10 | 253 | 2407362 | 13635.3 | 735 | 714 | 176.5 |
| D | 1 | 52 | 186112 | 1050.41 | 735 | 714 | 176.5 |
| D | 8 | 195 | 167631 | 945.7 | 735 | 714 | 176.5 |
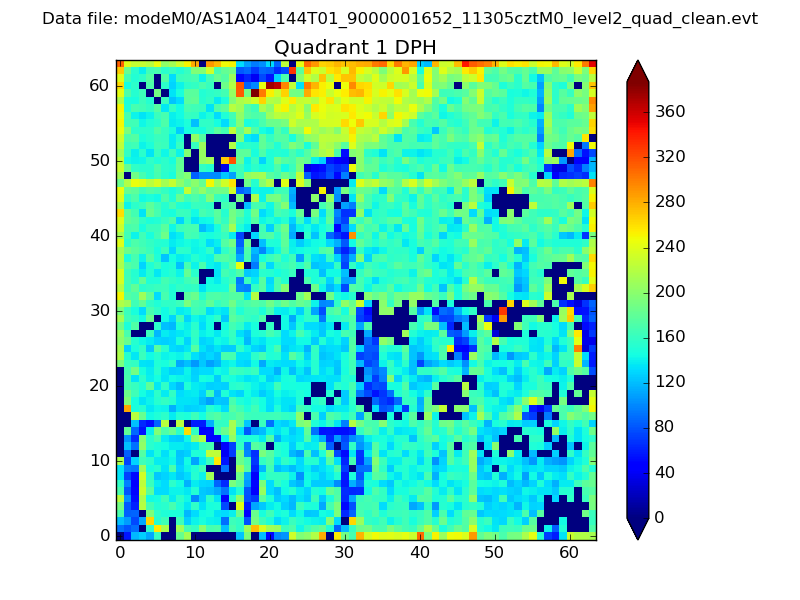
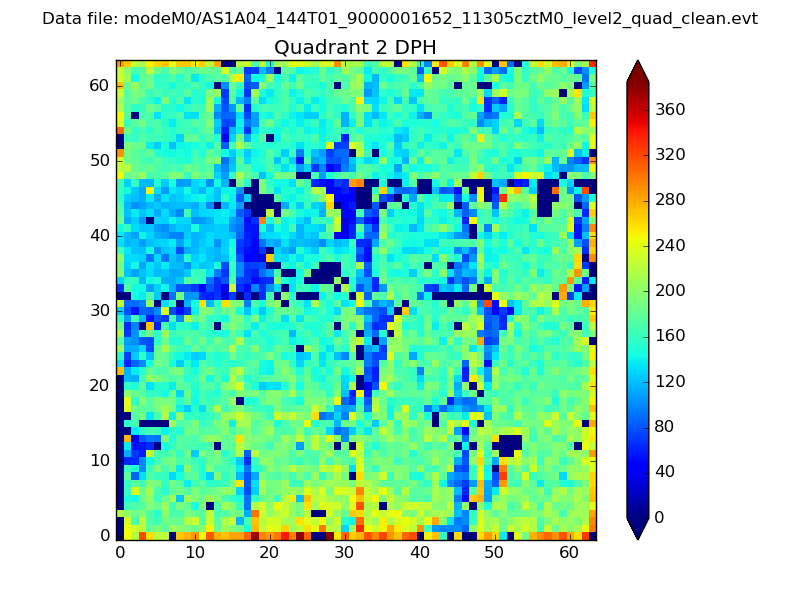
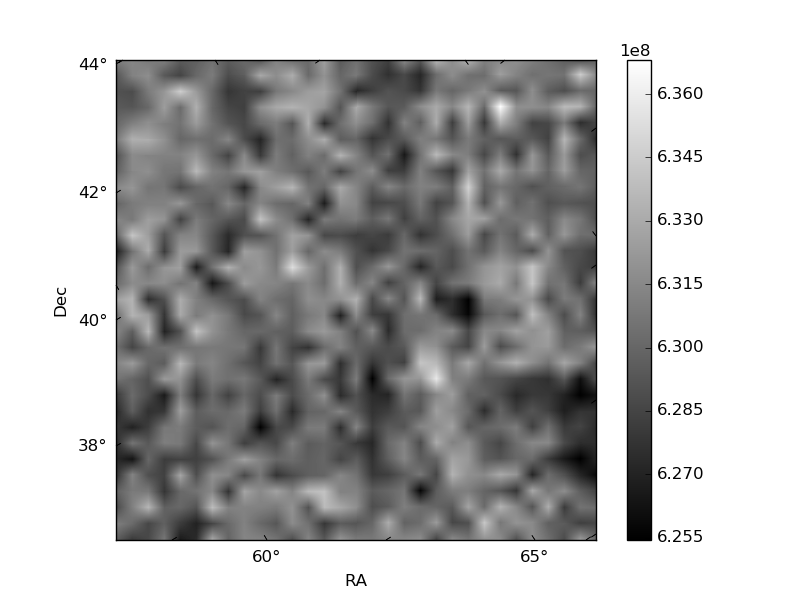
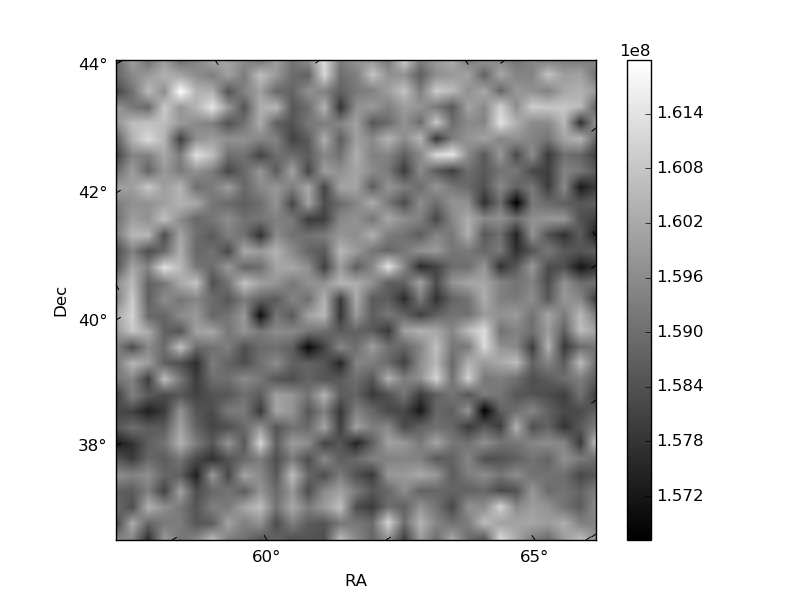
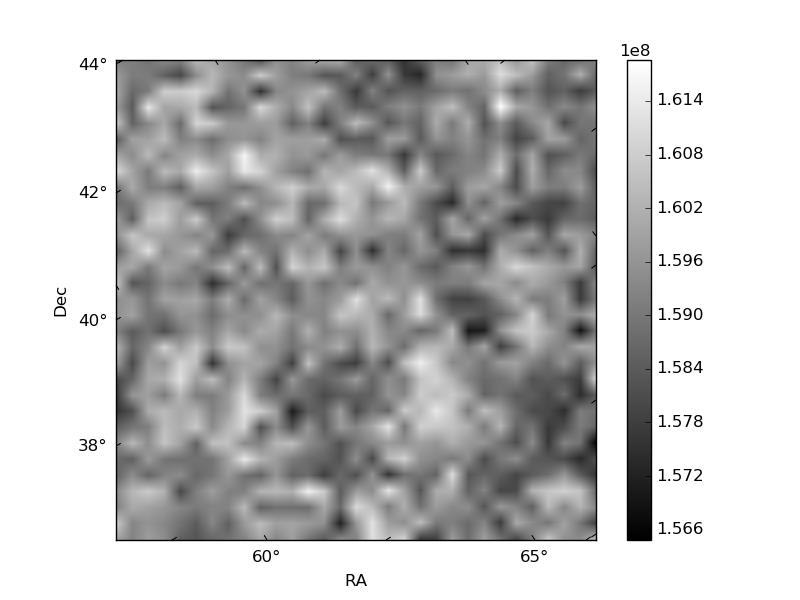
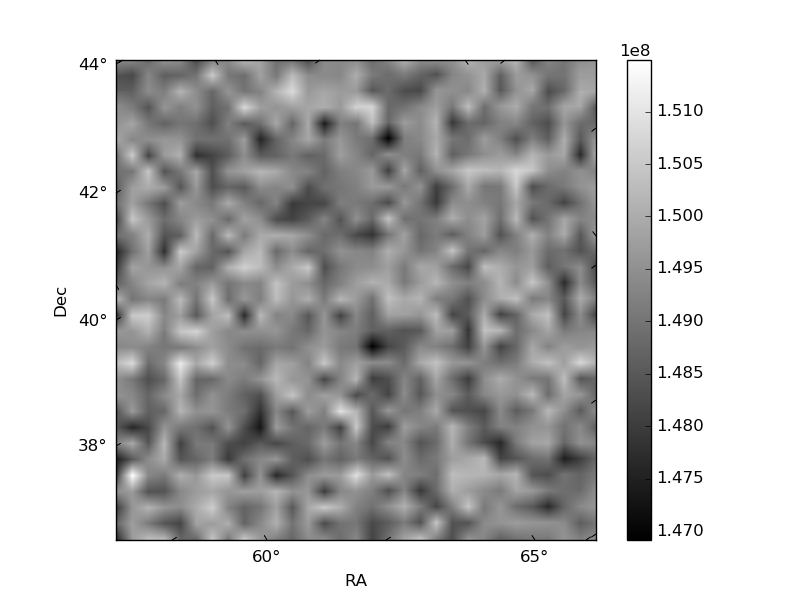
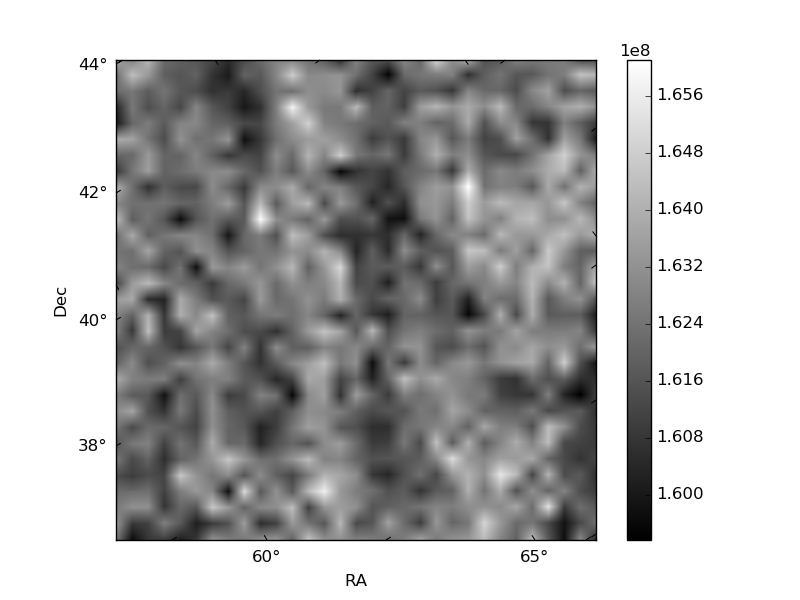
Histogram calculated using DETX and DETY for each event in the final _common_clean file
| Quadrant A |  |
 |
Quadrant B |
|---|---|---|---|
| Quadrant D |  |
 |
Quadrant C |
| Plot type | Count rate plots | Images |
|---|---|---|
| Comparison with Poisson distribution Blue bars denote a histogram of data divided into 1 sec bins. Red curve is a Poisson curve with rate = median count rate of data. |
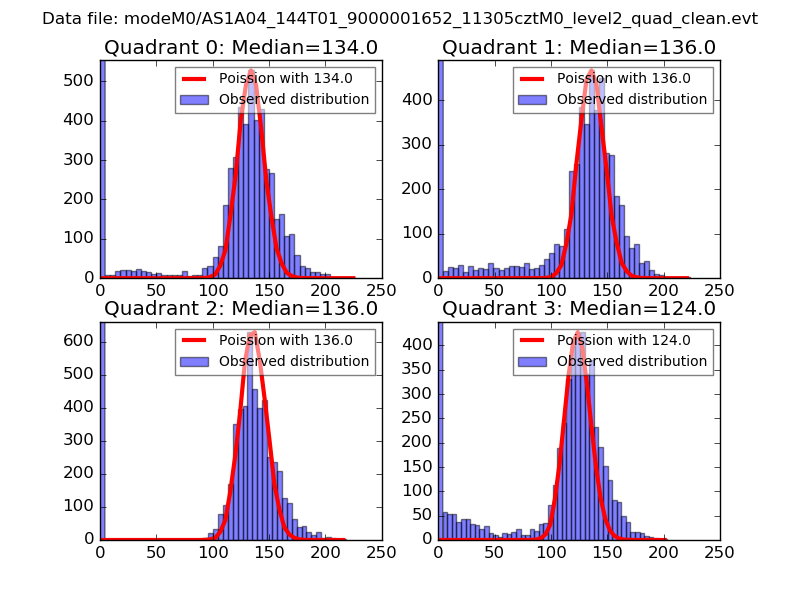 |
 |
| Quadrant-wise count rates Data is divided into 100 sec bins |
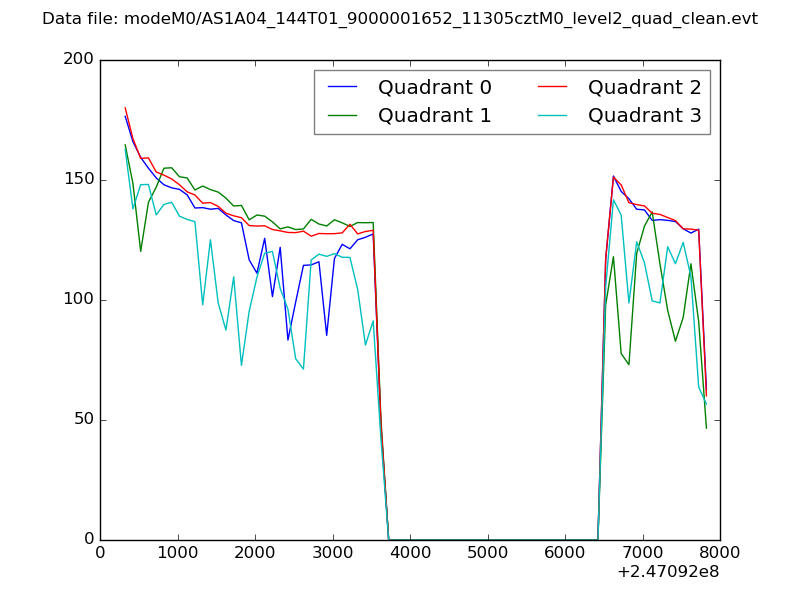 |
|
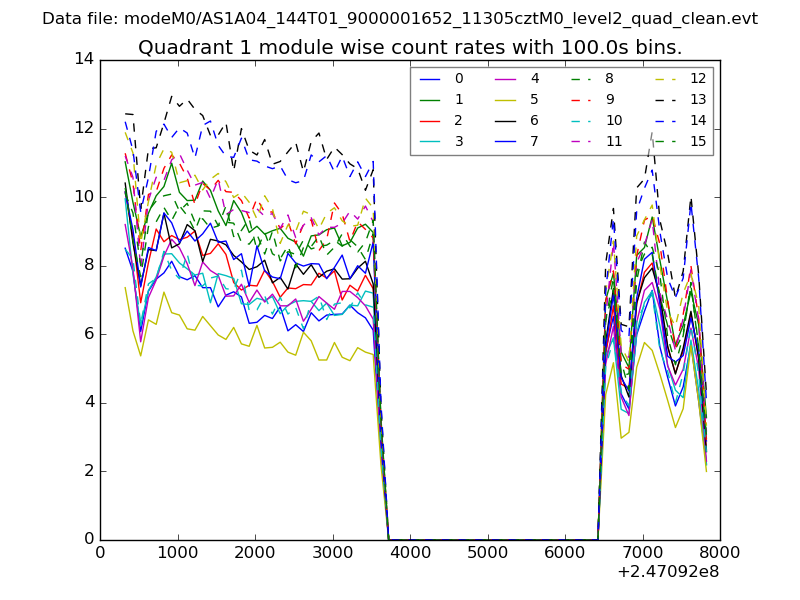
| Module-wise count rates for Quadrant A Data is divided into 100 sec bins |
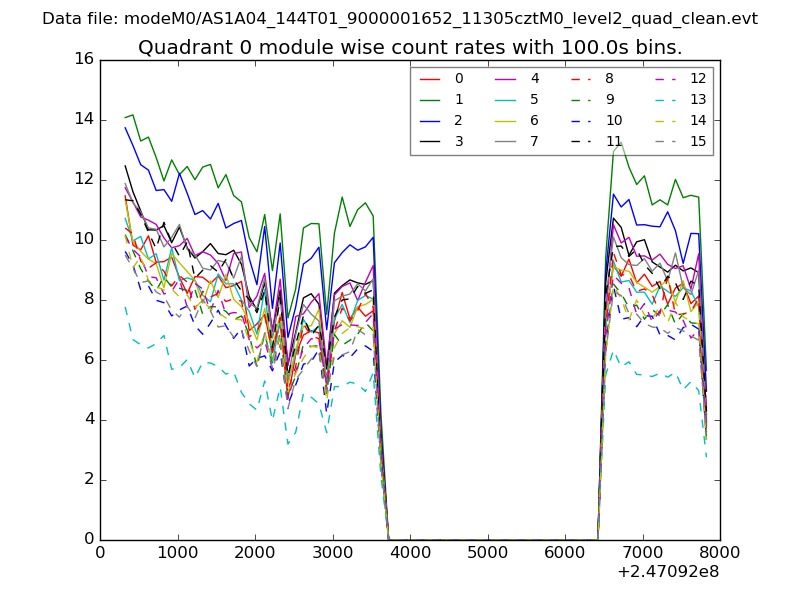 |
 |
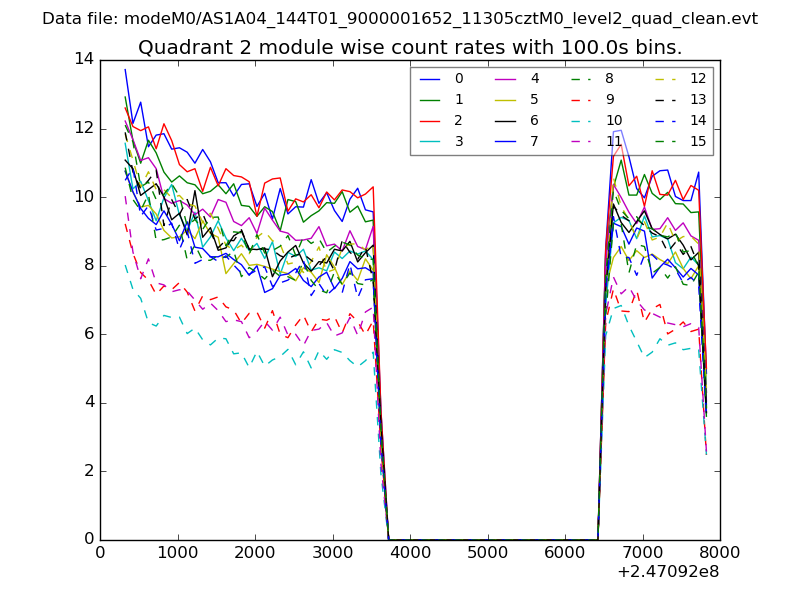
| Module-wise count rates for Quadrant B Data is divided into 100 sec bins |
 |
 |
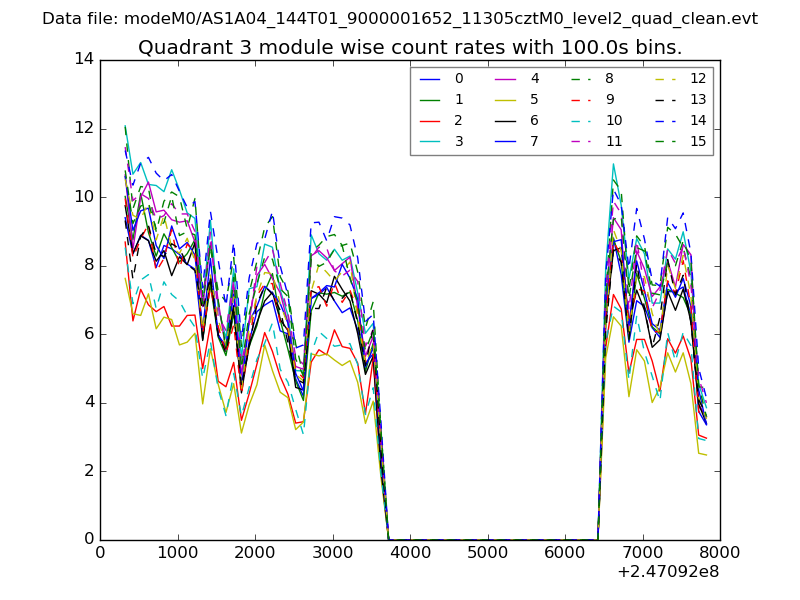
| Module-wise count rates for Quadrant C Data is divided into 100 sec bins |
 |
 |
| Module-wise count rates for Quadrant D Data is divided into 100 sec bins |
 |
 |
| Parameter | Plot |
|---|---|
| CZT HV Monitor | 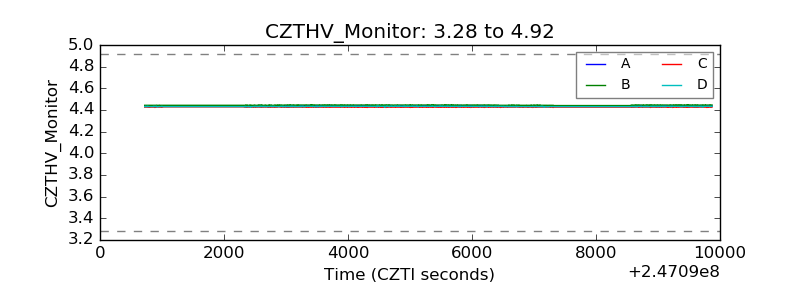 |
| D_VDD | 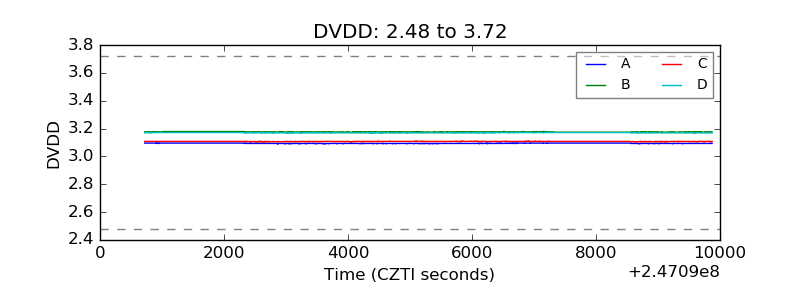 |
| Temperature 1 | 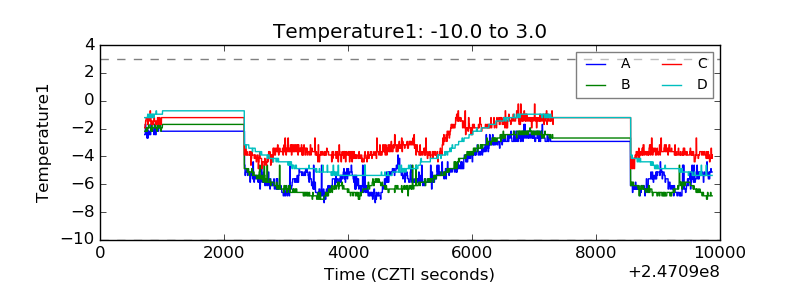 |
| Veto HV Monitor | 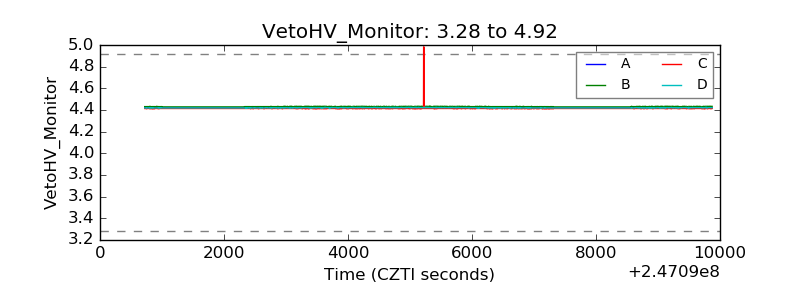 |
| Veto LLD | 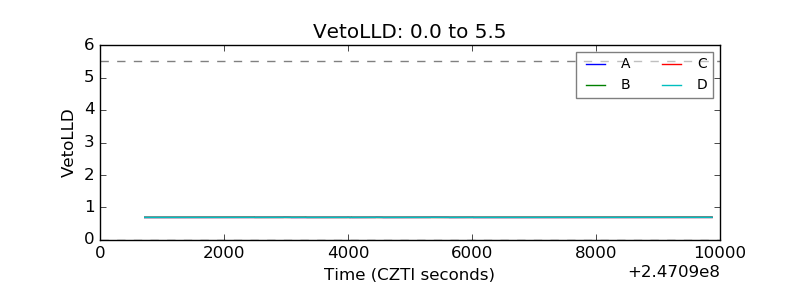 |
| Alpha Counter | 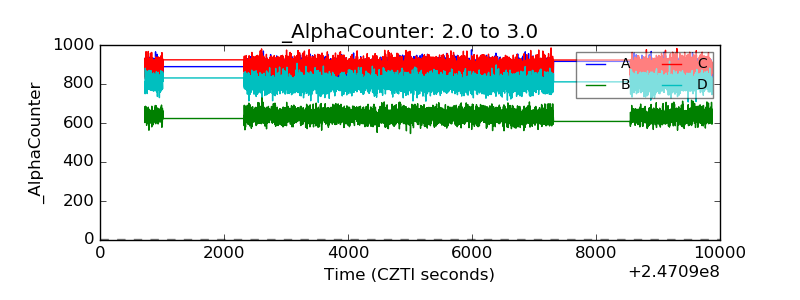 |
| _CPM_Rate | 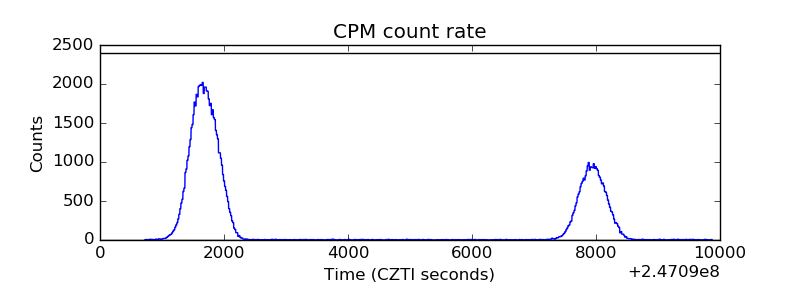 |
| CZT Counter | 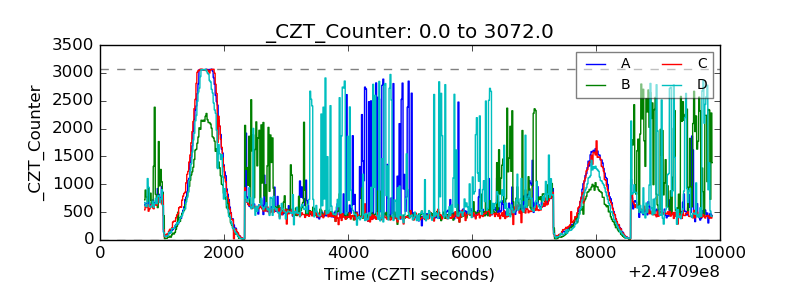 |
| +2.5 Volts monitor |  |
| +5 Volts monitor |  |
| _ROLL_ROT | 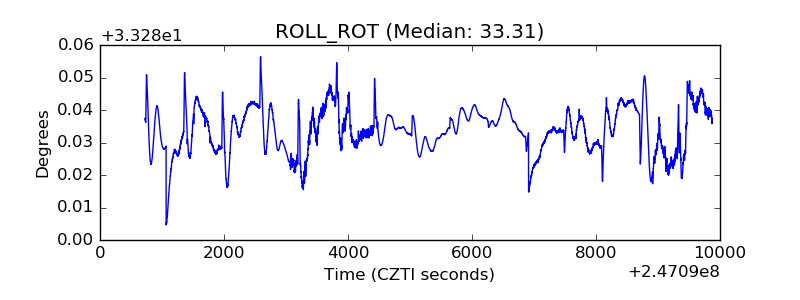 |
| _Roll_DEC | 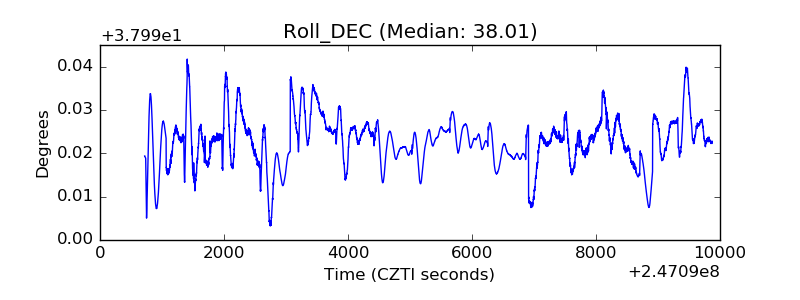 |
| _Roll_RA | 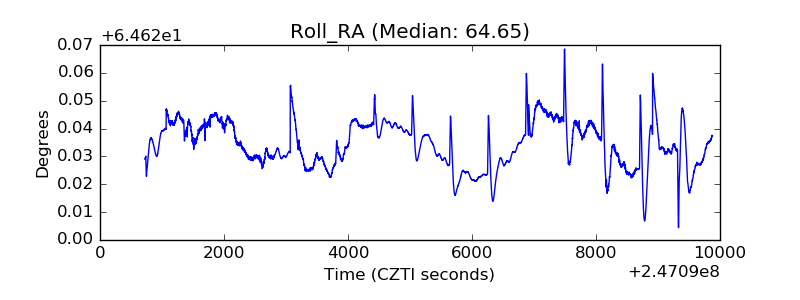 |
| Veto Counter | 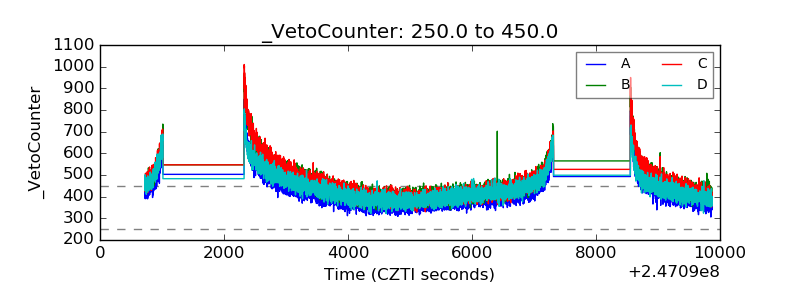 |