| Param | Original file | Final file |
|---|---|---|
| Filename | modeM0/AS1A04_144T01_9000001652_11306cztM0_level2.evt | modeM0/AS1A04_144T01_9000001652_11306cztM0_level2_quad_clean.evt |
| Size (bytes) | 621,875,520 | 84,870,720 |
| Size | 593.1 MB | 80.9 MB |
| Events in quadrant A | 5,327,053 | 543,530 |
| Events in quadrant B | 5,034,696 | 526,831 |
| Events in quadrant C | 2,978,985 | 562,029 |
| Events in quadrant D | 5,054,388 | 485,720 |
| Mode SS | |||
|---|---|---|---|
| Quadrant | BADHDUFLAG | Total packets | Discarded packets |
| A | 0 | 132 | 0 |
| B | 0 | 132 | 0 |
| C | 0 | 132 | 0 |
| D | 0 | 132 | 0 |
| Mode M0 | |||
|---|---|---|---|
| Quadrant | BADHDUFLAG | Total packets | Discarded packets |
| A | 0 | 20221 | 3 |
| B | 0 | 19371 | 2 |
| C | 0 | 13378 | 2 |
| D | 0 | 19431 | 2 |
| Mode M9 | |||
|---|---|---|---|
| Quadrant | BADHDUFLAG | Total packets | Discarded packets |
| A | 0 | 17 | 0 |
| B | 0 | 17 | 0 |
| C | 0 | 17 | 0 |
| D | 0 | 18 | 0 |
| Quadrant | Total seconds | Saturated seconds | Saturation percentage |
|---|---|---|---|
| A | 6470 | 603 | 9.319938% |
| B | 6470 | 806 | 12.457496% |
| C | 6470 | 24 | 0.370943% |
| D | 6470 | 572 | 8.840804% |
Noise dominated data is calculated using 1-second bins in cleaned event files. If a bin has >2000 counts, and if more than 50% of those come from <1% of pixels, then it is considered to be noise-dominated and hence unusable.
| Quadrant | # 1 sec bins | Bins with >0 counts | Bins with >2000 counts | High rate bins dominated by noise | Noise dominated (total time) | Noise dominated (detector-on time) | Marked lightcurve |
|---|---|---|---|---|---|---|---|
| A | 7490 | 6471 | 449 | 449 | 5.99% | 6.94% | 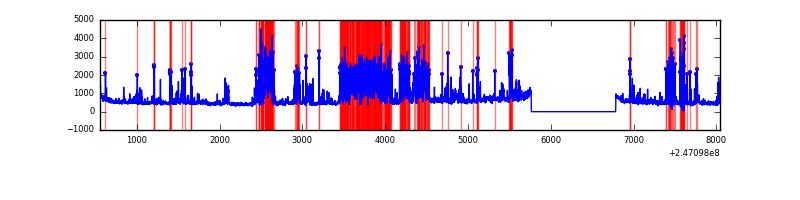 |
| B | 7490 | 6471 | 505 | 505 | 6.74% | 7.80% | 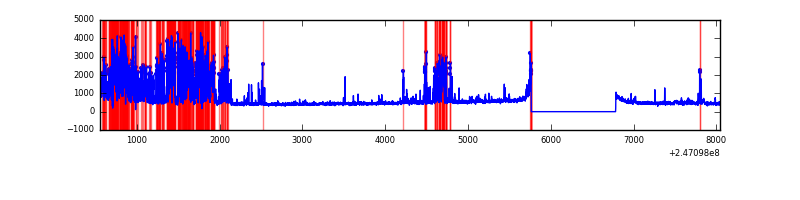 |
| C | 7490 | 6471 | 0 | 0 | 0.00% | 0.00% |  |
| D | 7490 | 6471 | 439 | 439 | 5.86% | 6.78% |  |
Top three noisy pixels from each quadrant. If the there are fewer than three noisy pixels in the level2.evt file, extra rows are filled as -1
| Pixel properties | Quadrant properties | ||||||
|---|---|---|---|---|---|---|---|
| Quadrant | DetID | PixID | Counts | Sigma | Mean | Median | Sigma |
| A | 8 | 5 | 1306748 | 8446.7 | 752 | 736 | 154.6 |
| A | 0 | 8 | 1053202 | 6806.88 | 752 | 736 | 154.6 |
| A | 1 | 162 | 20271 | 126.34 | 752 | 736 | 154.6 |
| B | 3 | 64 | 1607852 | 11324.32 | 739 | 724 | 141.9 |
| B | 4 | 239 | 439098 | 3088.92 | 739 | 724 | 141.9 |
| B | 4 | 81 | 32055 | 220.77 | 739 | 724 | 141.9 |
| C | 14 | 234 | 15092 | 81.62 | 758 | 765 | 175.5 |
| C | 9 | 204 | 5632 | 27.73 | 758 | 765 | 175.5 |
| C | 13 | 61 | 5629 | 27.71 | 758 | 765 | 175.5 |
| D | 10 | 253 | 1480798 | 8691.35 | 709 | 689 | 170.3 |
| D | 1 | 52 | 281854 | 1651.03 | 709 | 689 | 170.3 |
| D | 8 | 195 | 224624 | 1314.97 | 709 | 689 | 170.3 |
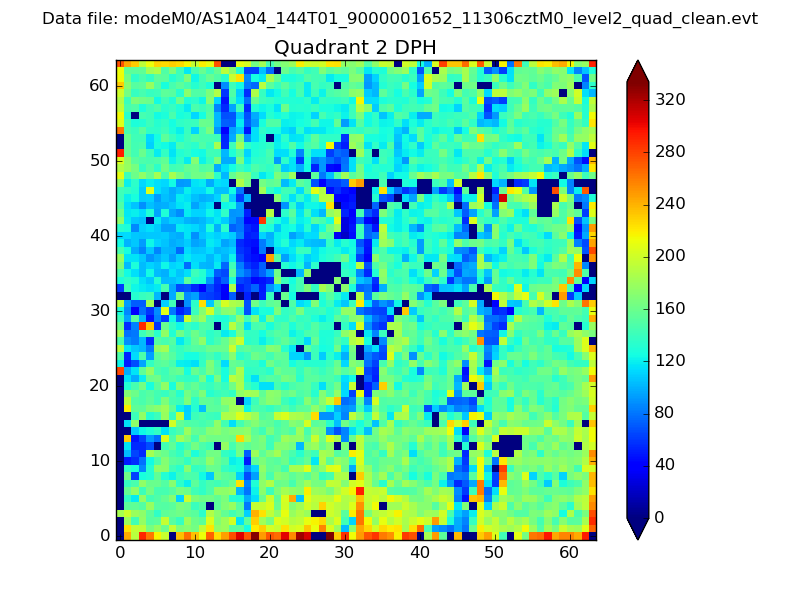
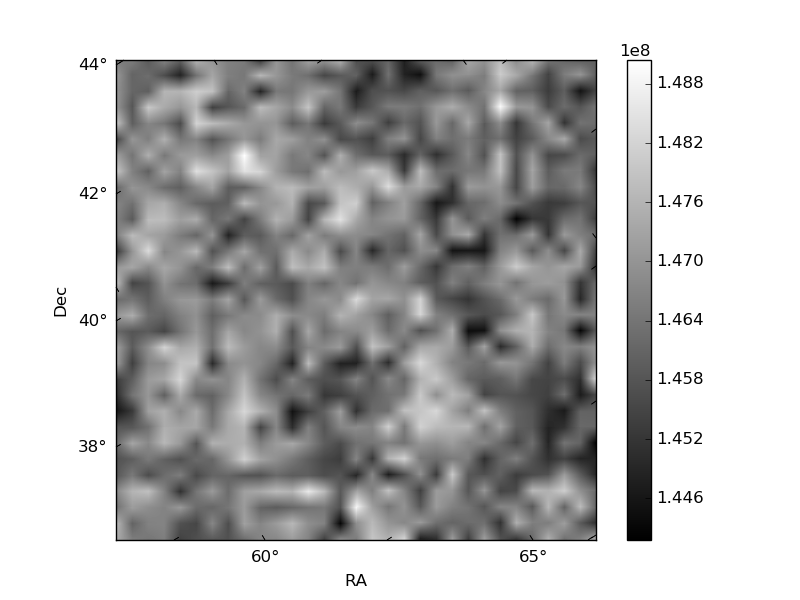
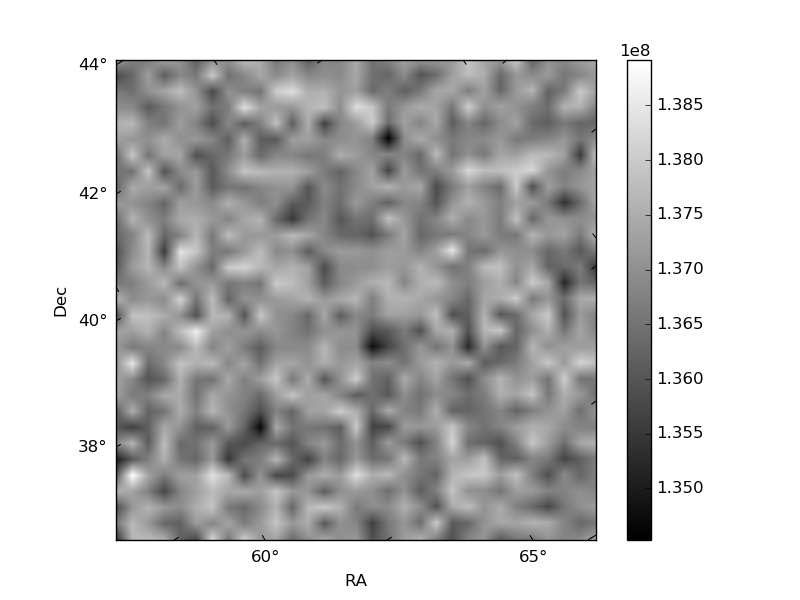
Histogram calculated using DETX and DETY for each event in the final _common_clean file
| Quadrant A | 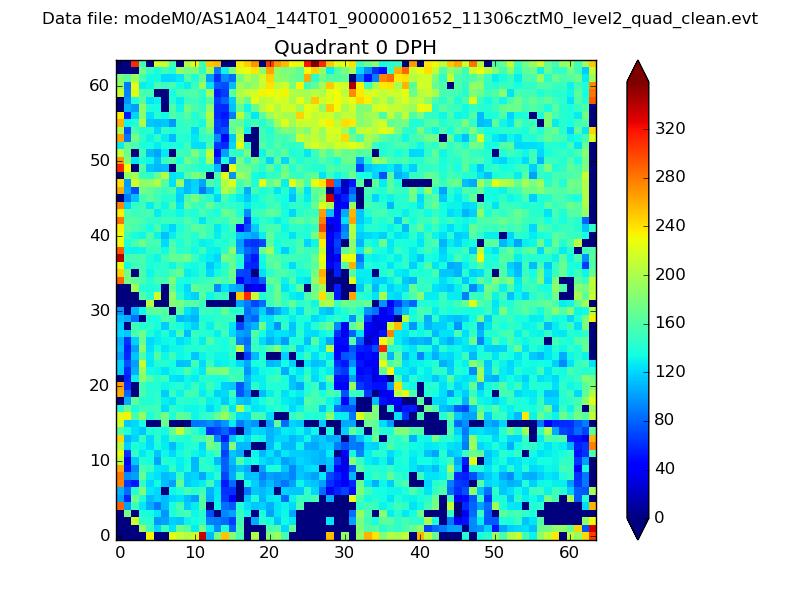 |
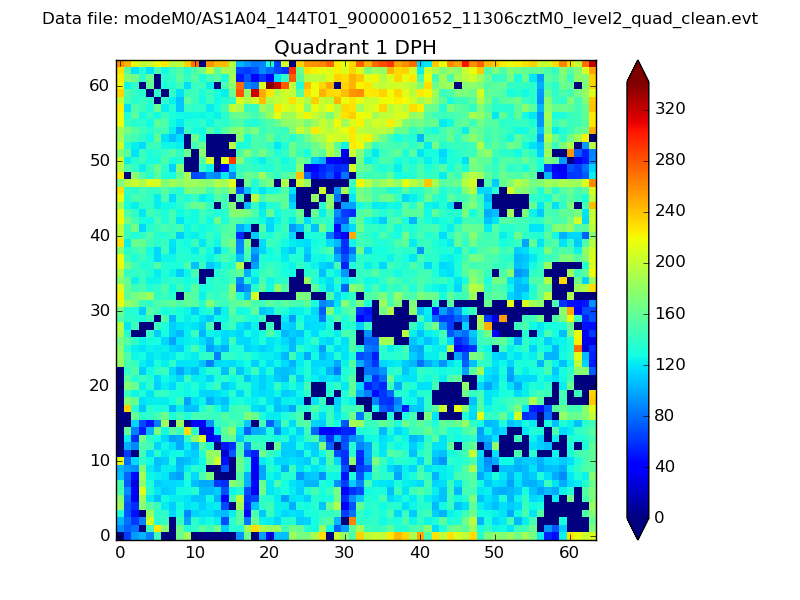 |
Quadrant B |
|---|---|---|---|
| Quadrant D | 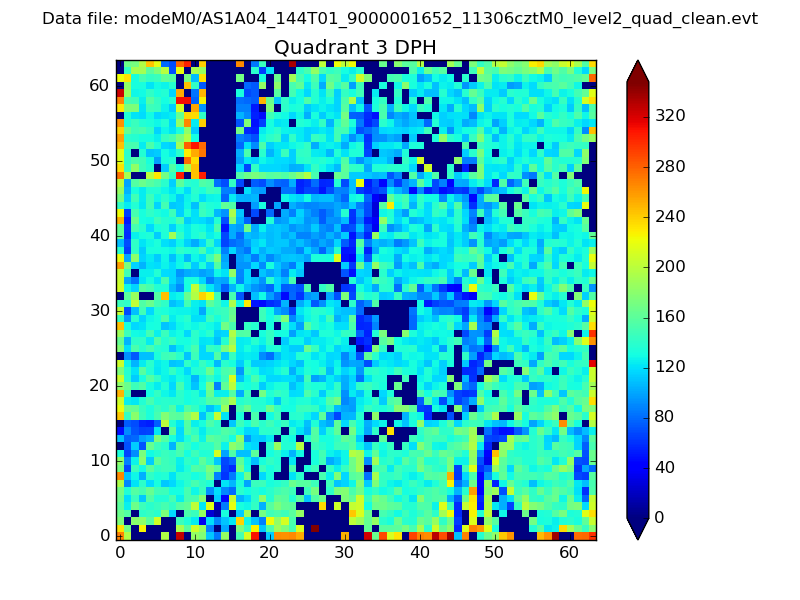 |
 |
Quadrant C |
| Plot type | Count rate plots | Images |
|---|---|---|
| Comparison with Poisson distribution Blue bars denote a histogram of data divided into 1 sec bins. Red curve is a Poisson curve with rate = median count rate of data. |
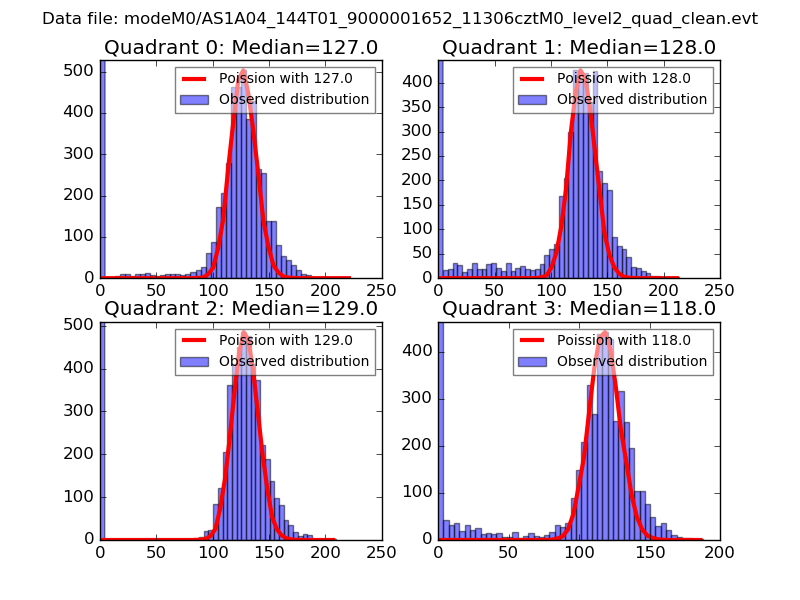 |
 |
| Quadrant-wise count rates Data is divided into 100 sec bins |
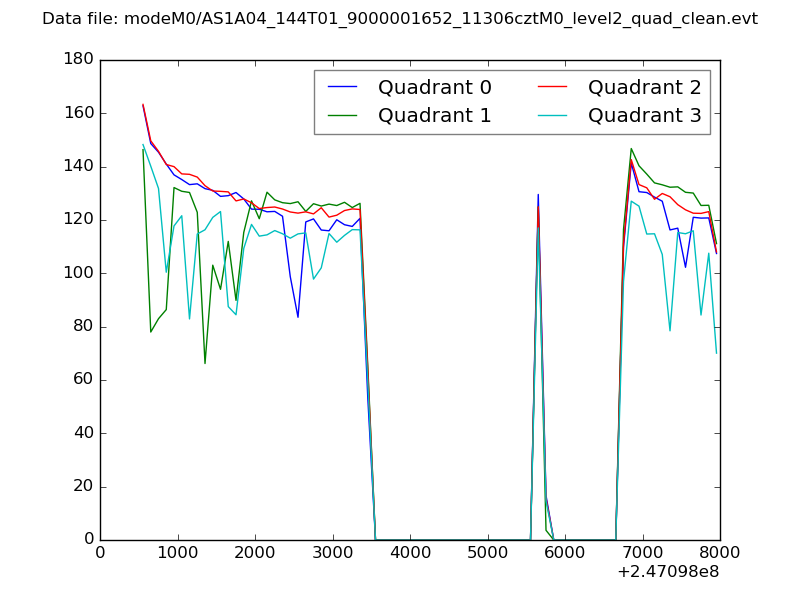 |
|
| Module-wise count rates for Quadrant A Data is divided into 100 sec bins |
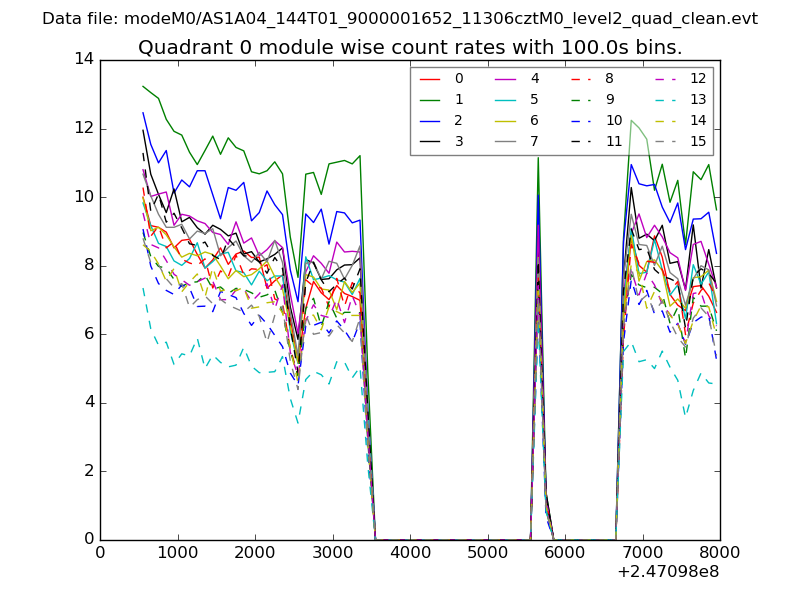 |
 |
| Module-wise count rates for Quadrant B Data is divided into 100 sec bins |
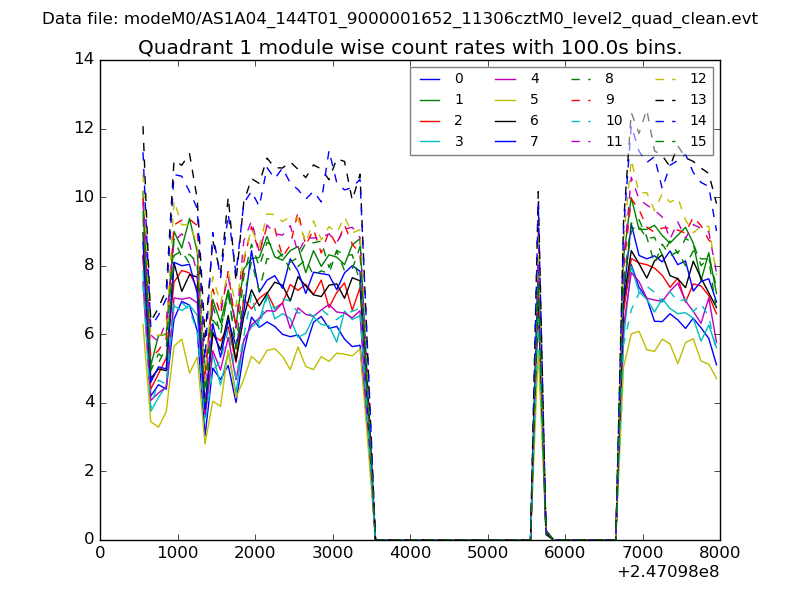 |
 |
| Module-wise count rates for Quadrant C Data is divided into 100 sec bins |
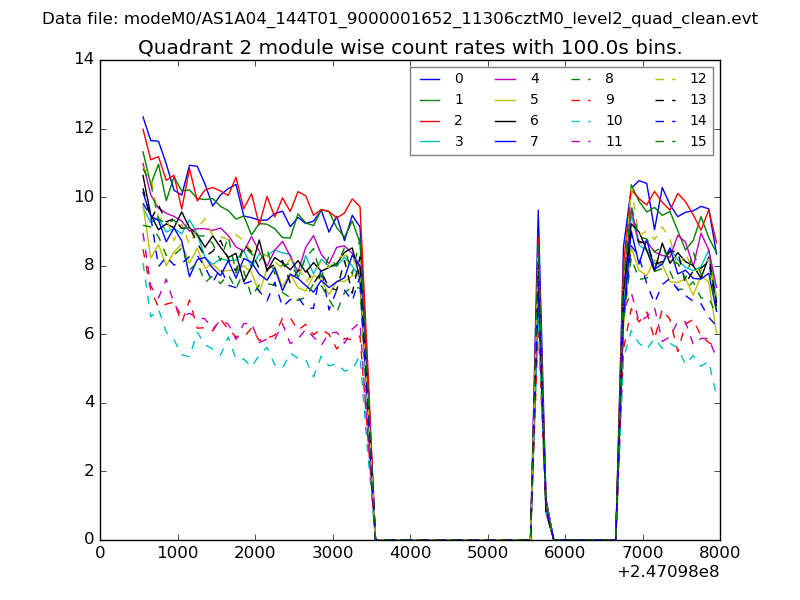 |
 |
| Module-wise count rates for Quadrant D Data is divided into 100 sec bins |
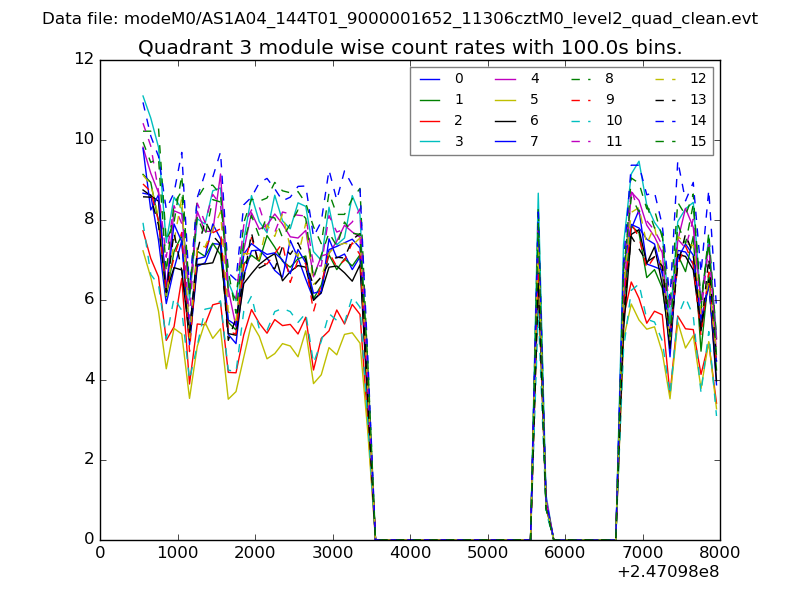 |
 |
| Parameter | Plot |
|---|---|
| CZT HV Monitor | 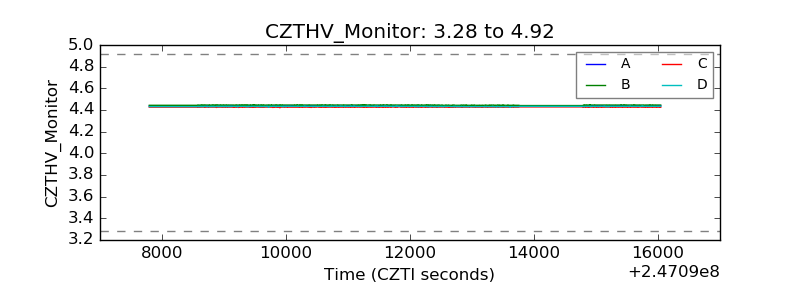 |
| D_VDD | 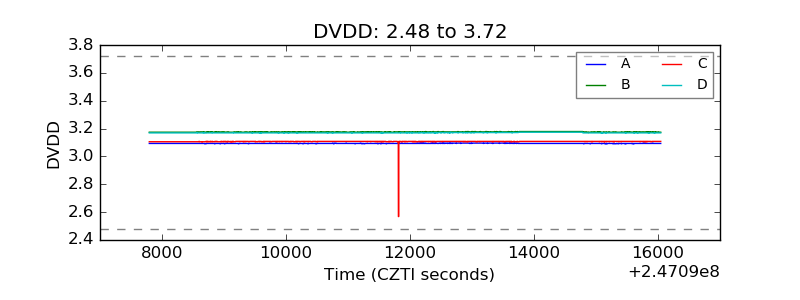 |
| Temperature 1 | 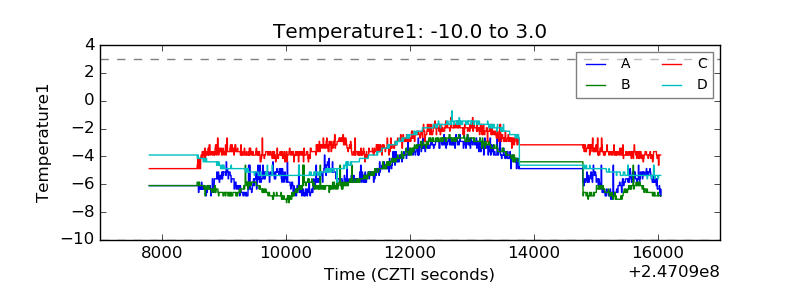 |
| Veto HV Monitor | 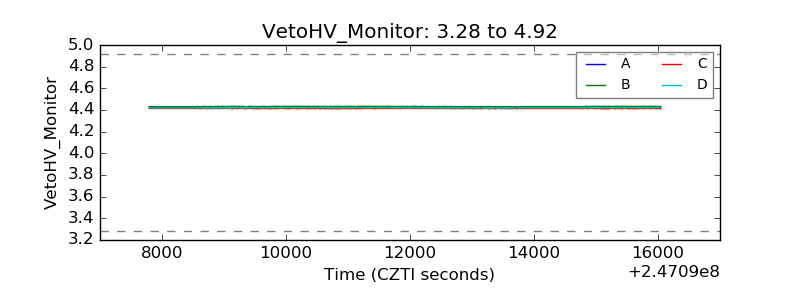 |
| Veto LLD | 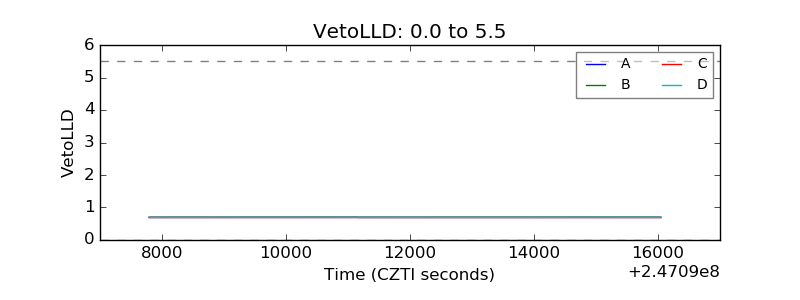 |
| Alpha Counter | 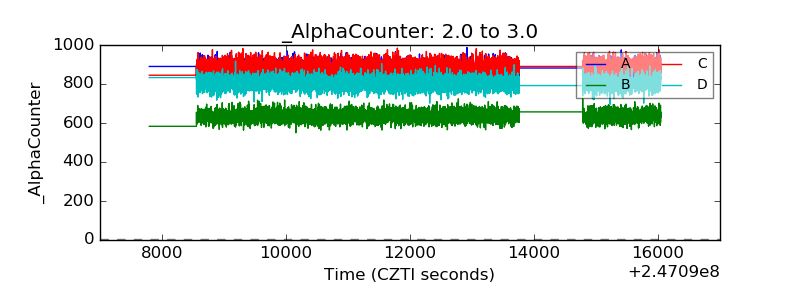 |
| _CPM_Rate | 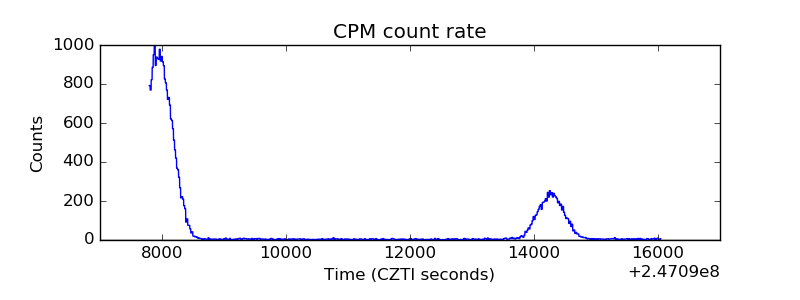 |
| CZT Counter | 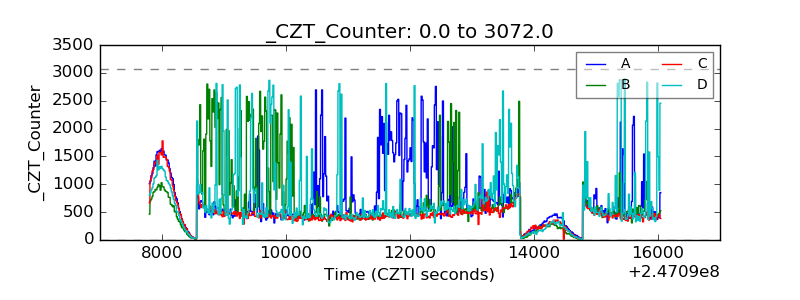 |
| +2.5 Volts monitor |  |
| +5 Volts monitor |  |
| _ROLL_ROT | 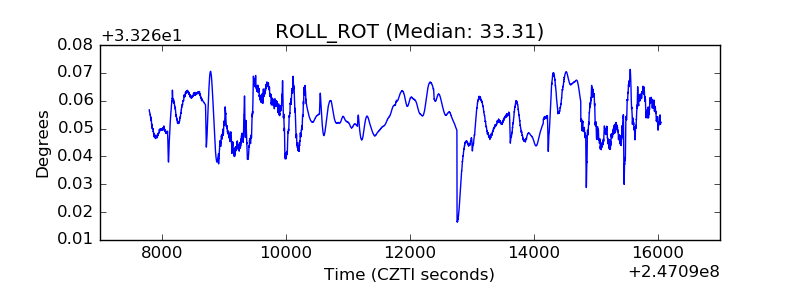 |
| _Roll_DEC | 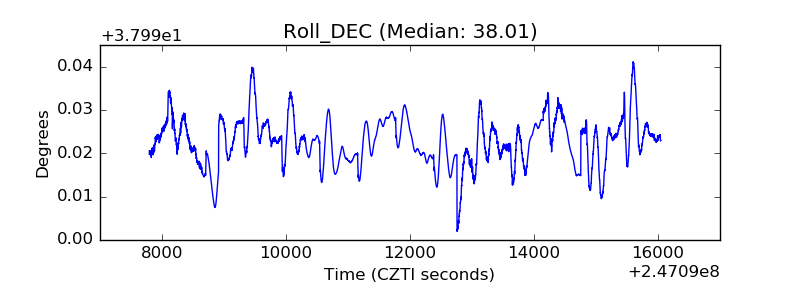 |
| _Roll_RA | 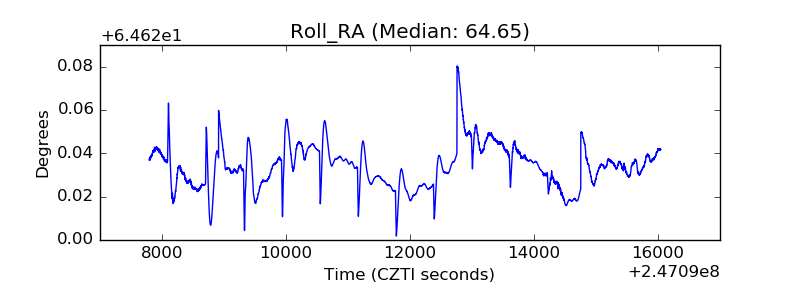 |
| Veto Counter | 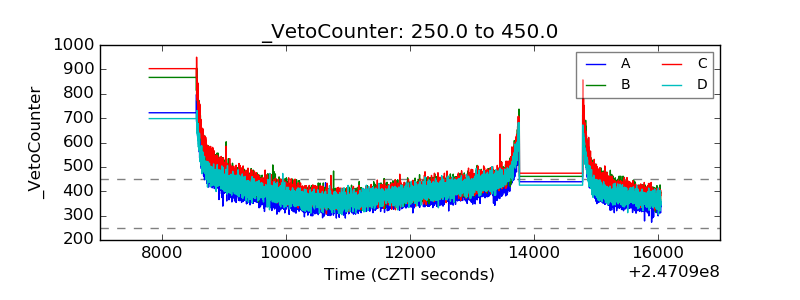 |