| Param | Original file | Final file |
|---|---|---|
| Filename | modeM0/AS1A04_144T01_9000001652_11307cztM0_level2.evt | modeM0/AS1A04_144T01_9000001652_11307cztM0_level2_quad_clean.evt |
| Size (bytes) | 677,603,520 | 97,968,960 |
| Size | 646.2 MB | 93.4 MB |
| Events in quadrant A | 4,836,679 | 624,029 |
| Events in quadrant B | 4,402,679 | 663,100 |
| Events in quadrant C | 3,280,132 | 647,355 |
| Events in quadrant D | 7,505,694 | 521,647 |
| Mode SS | |||
|---|---|---|---|
| Quadrant | BADHDUFLAG | Total packets | Discarded packets |
| A | 0 | 150 | 0 |
| B | 0 | 150 | 0 |
| C | 0 | 150 | 0 |
| D | 0 | 150 | 0 |
| Mode M0 | |||
|---|---|---|---|
| Quadrant | BADHDUFLAG | Total packets | Discarded packets |
| A | 0 | 19198 | 3 |
| B | 0 | 18121 | 2 |
| C | 0 | 15057 | 2 |
| D | 0 | 27319 | 2 |
| Mode M9 | |||
|---|---|---|---|
| Quadrant | BADHDUFLAG | Total packets | Discarded packets |
| A | 0 | 10 | 0 |
| B | 0 | 10 | 0 |
| C | 0 | 10 | 0 |
| D | 0 | 11 | 0 |
| Quadrant | Total seconds | Saturated seconds | Saturation percentage |
|---|---|---|---|
| A | 7321 | 375 | 5.122251% |
| B | 7321 | 368 | 5.026636% |
| C | 7321 | 28 | 0.382461% |
| D | 7321 | 1350 | 18.440104% |
Noise dominated data is calculated using 1-second bins in cleaned event files. If a bin has >2000 counts, and if more than 50% of those come from <1% of pixels, then it is considered to be noise-dominated and hence unusable.
| Quadrant | # 1 sec bins | Bins with >0 counts | Bins with >2000 counts | High rate bins dominated by noise | Noise dominated (total time) | Noise dominated (detector-on time) | Marked lightcurve |
|---|---|---|---|---|---|---|---|
| A | 7936 | 7322 | 212 | 212 | 2.67% | 2.90% |  |
| B | 7936 | 7322 | 141 | 141 | 1.78% | 1.93% | 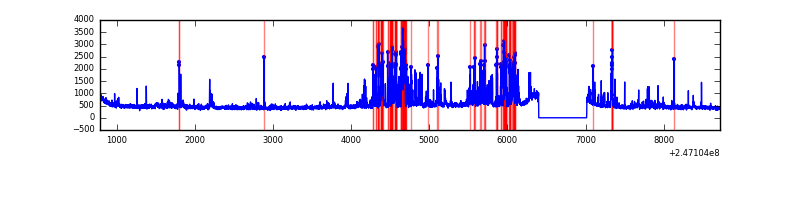 |
| C | 7936 | 7322 | 0 | 0 | 0.00% | 0.00% | 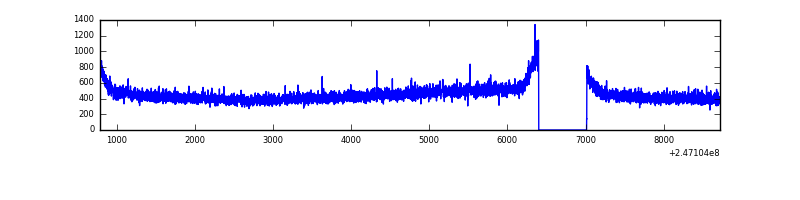 |
| D | 7936 | 7322 | 1203 | 1203 | 15.16% | 16.43% | 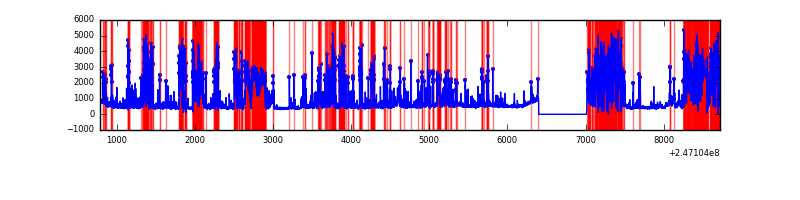 |
Top three noisy pixels from each quadrant. If the there are fewer than three noisy pixels in the level2.evt file, extra rows are filled as -1
| Pixel properties | Quadrant properties | ||||||
|---|---|---|---|---|---|---|---|
| Quadrant | DetID | PixID | Counts | Sigma | Mean | Median | Sigma |
| A | 8 | 5 | 1309459 | 7553.69 | 847 | 830 | 173.2 |
| A | 1 | 162 | 74532 | 425.42 | 847 | 830 | 173.2 |
| A | 1 | 178 | 47281 | 268.13 | 847 | 830 | 173.2 |
| B | 4 | 239 | 887557 | 5291.7 | 861 | 841 | 167.6 |
| B | 3 | 189 | 48766 | 286.0 | 861 | 841 | 167.6 |
| B | 4 | 81 | 37825 | 220.71 | 861 | 841 | 167.6 |
| C | 13 | 61 | 6192 | 27.28 | 840 | 844 | 196.1 |
| C | 14 | 234 | 3468 | 13.38 | 840 | 844 | 196.1 |
| C | 3 | 202 | 1970 | 5.74 | 840 | 844 | 196.1 |
| D | 10 | 253 | 3184221 | 17625.77 | 747 | 725 | 180.6 |
| D | 1 | 52 | 933166 | 5162.56 | 747 | 725 | 180.6 |
| D | 2 | 14 | 264781 | 1461.98 | 747 | 725 | 180.6 |
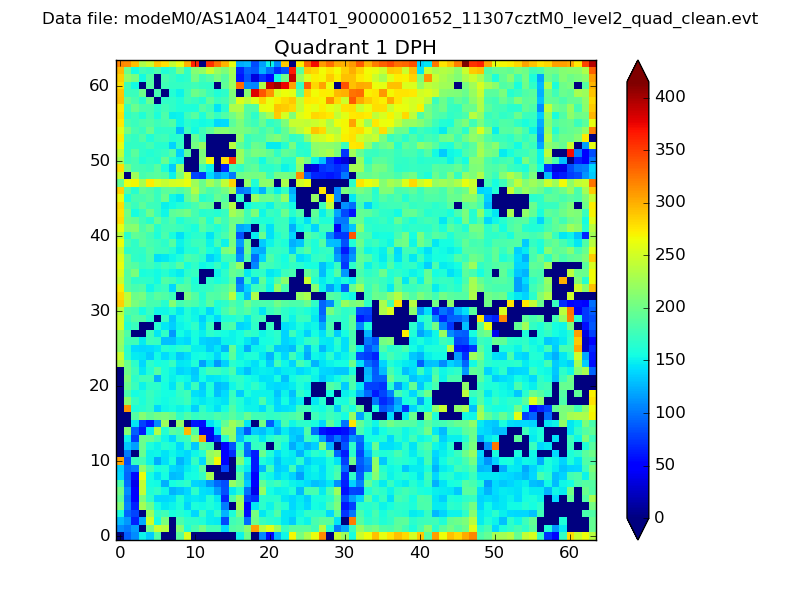
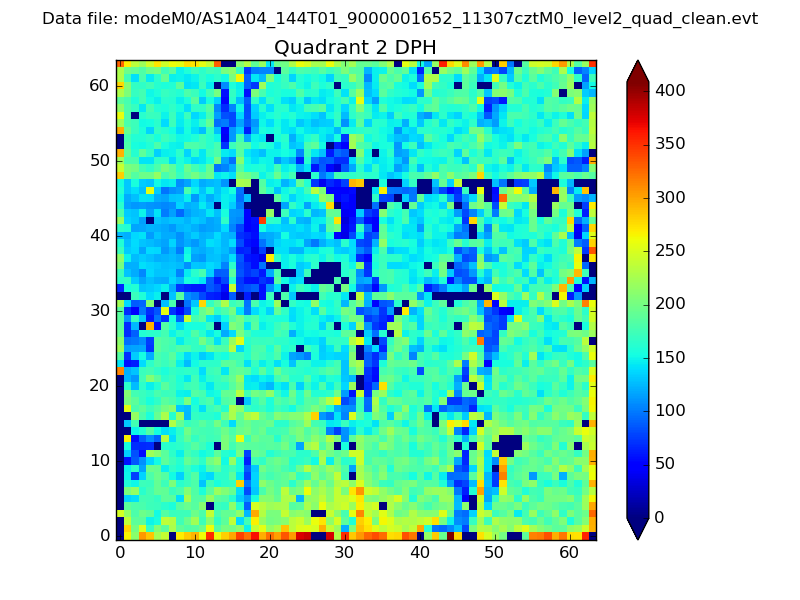
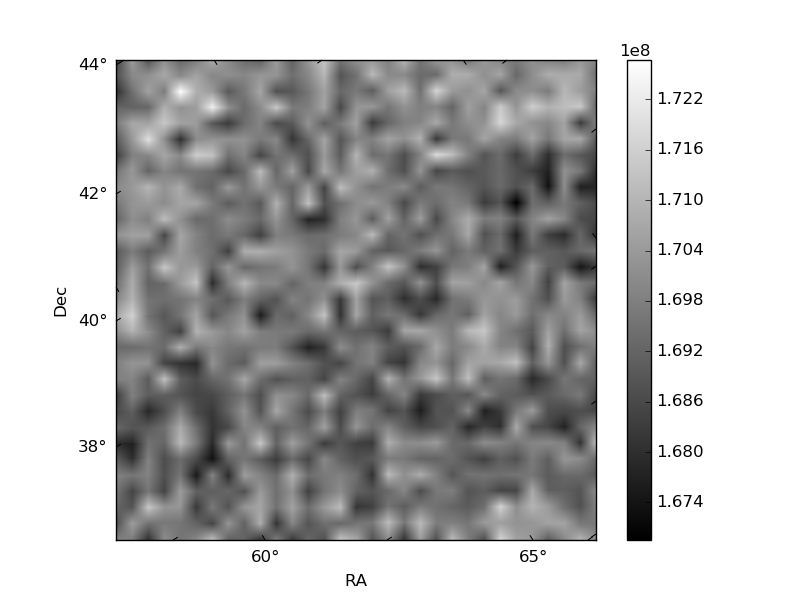
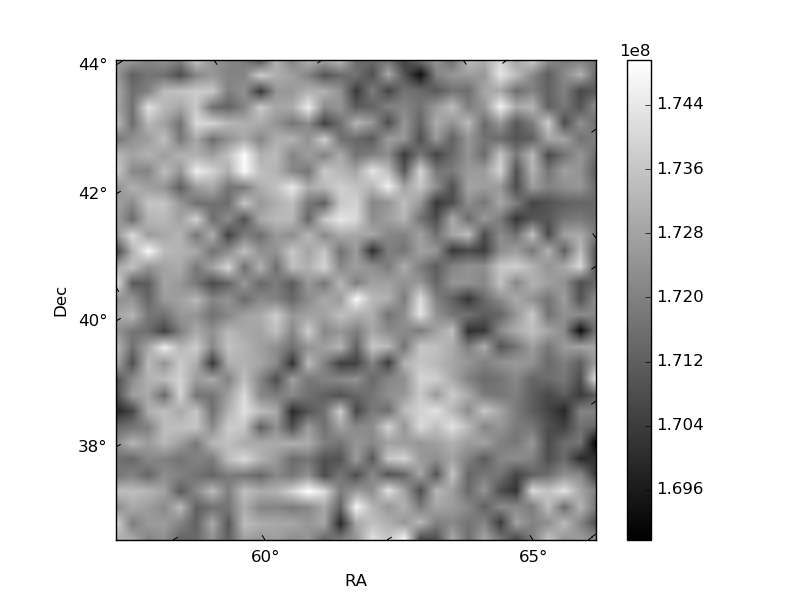
Histogram calculated using DETX and DETY for each event in the final _common_clean file
| Quadrant A | 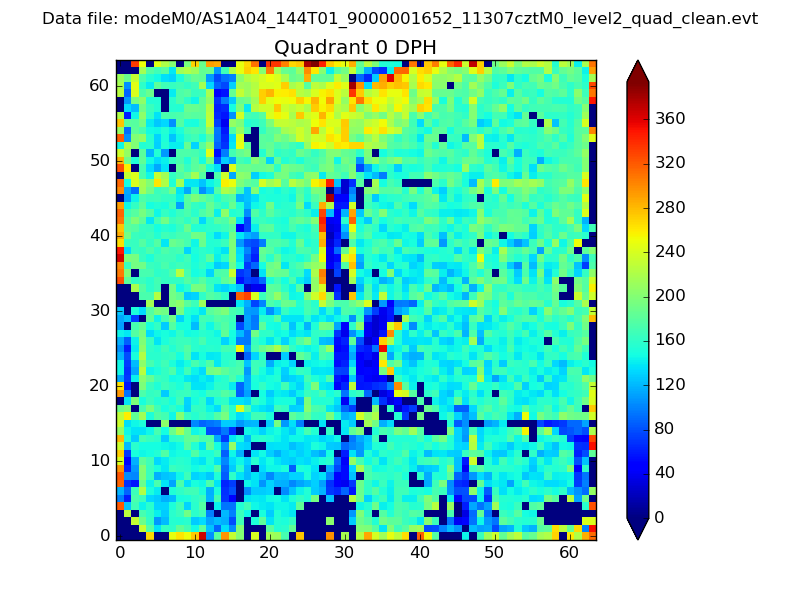 |
 |
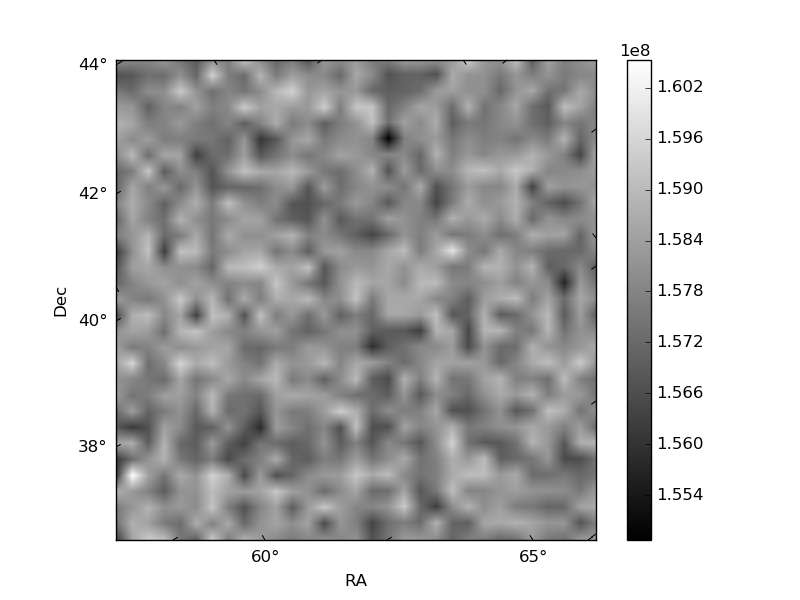
Quadrant B |
|---|---|---|---|
| Quadrant D |  |
 |
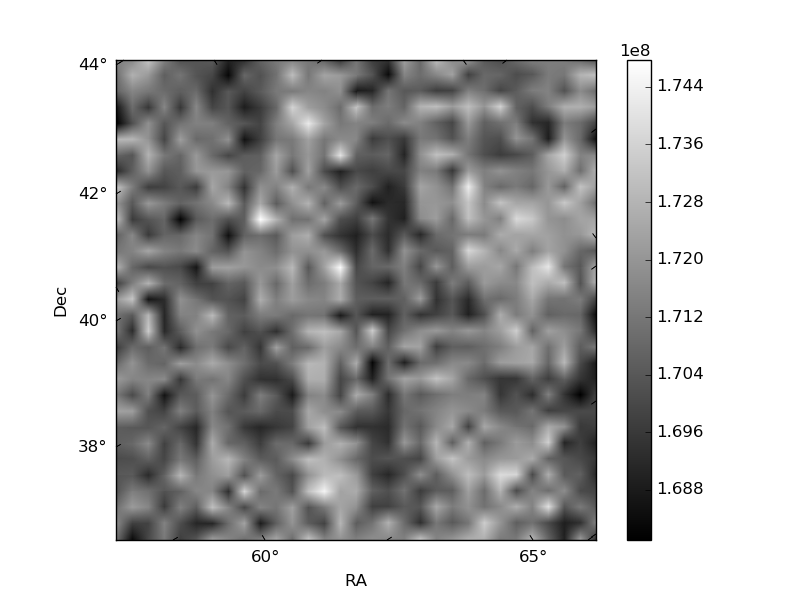
Quadrant C |
| Plot type | Count rate plots | Images |
|---|---|---|
| Comparison with Poisson distribution Blue bars denote a histogram of data divided into 1 sec bins. Red curve is a Poisson curve with rate = median count rate of data. |
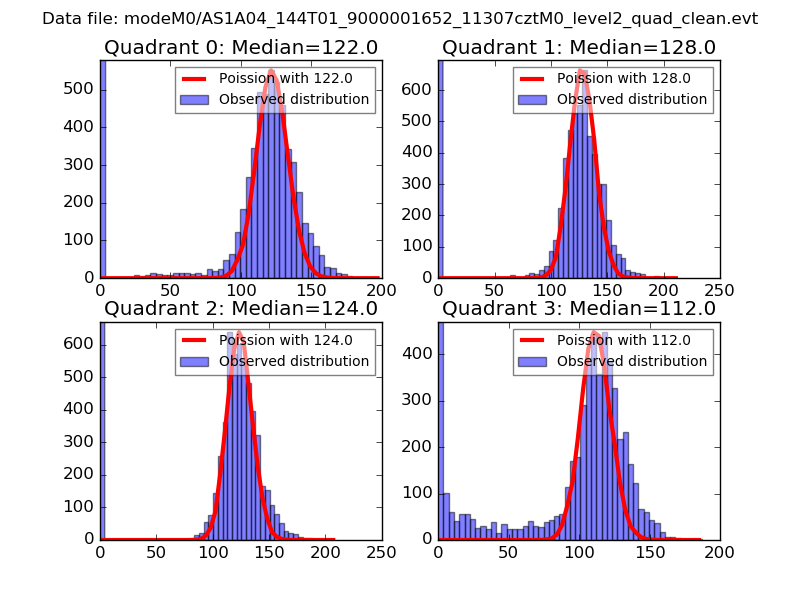 |
 |
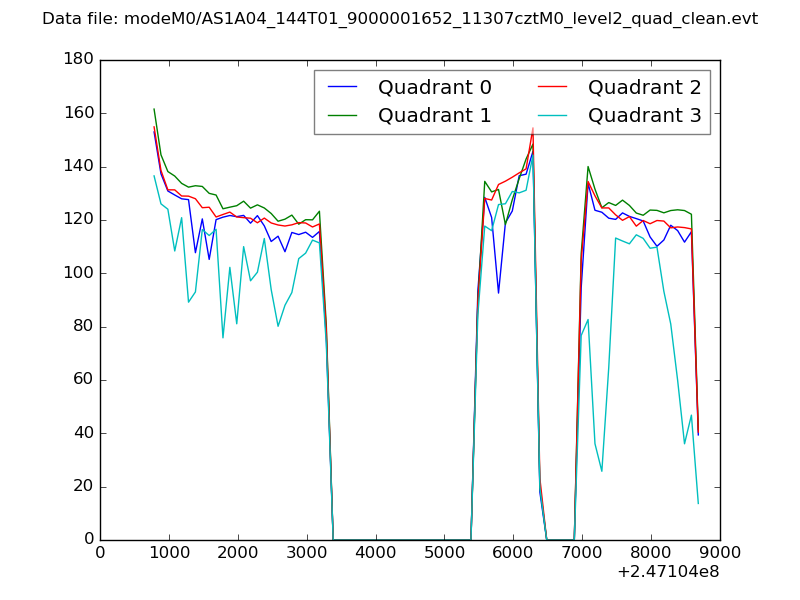
| Quadrant-wise count rates Data is divided into 100 sec bins |
 |
|
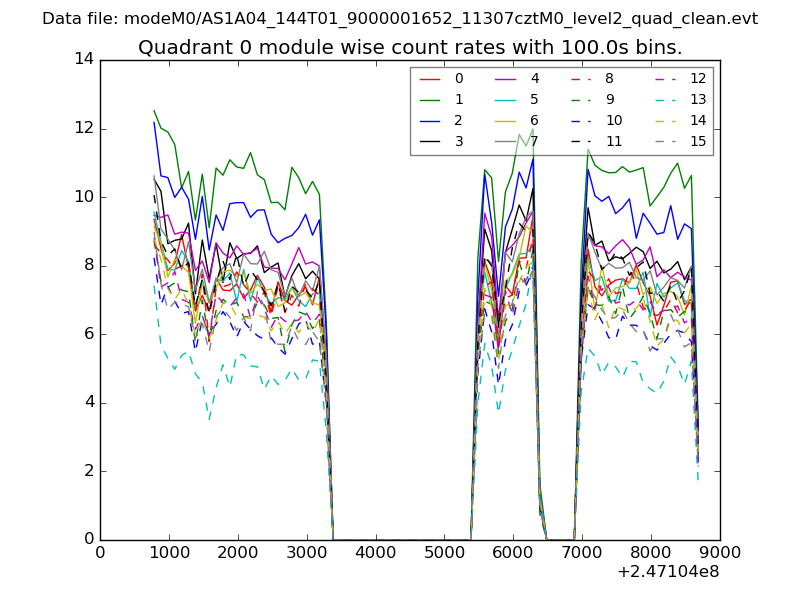
| Module-wise count rates for Quadrant A Data is divided into 100 sec bins |
 |
 |
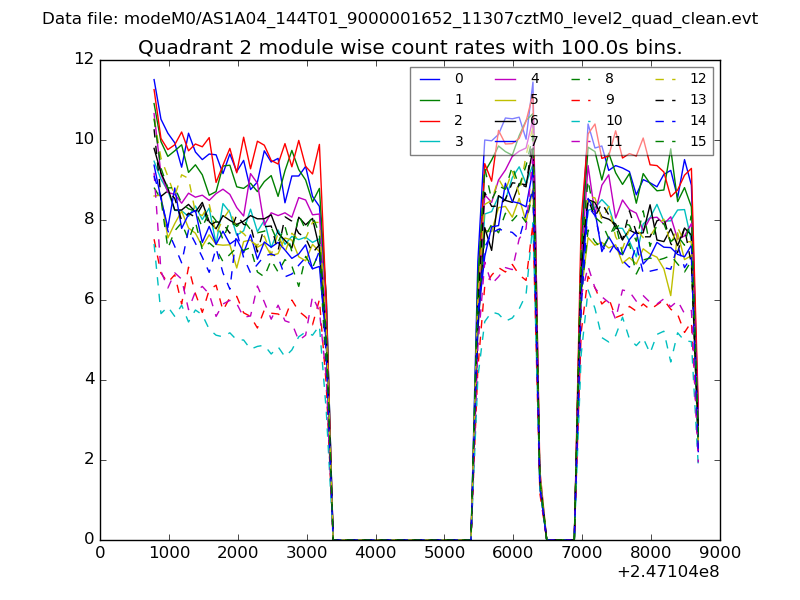
| Module-wise count rates for Quadrant B Data is divided into 100 sec bins |
 |
 |
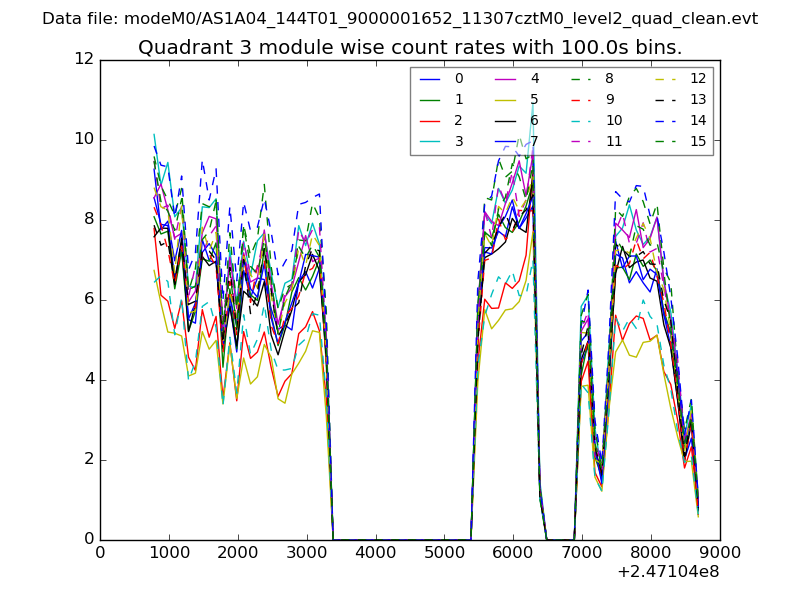
| Module-wise count rates for Quadrant C Data is divided into 100 sec bins |
 |
 |
| Module-wise count rates for Quadrant D Data is divided into 100 sec bins |
 |
 |
| Parameter | Plot |
|---|---|
| CZT HV Monitor | 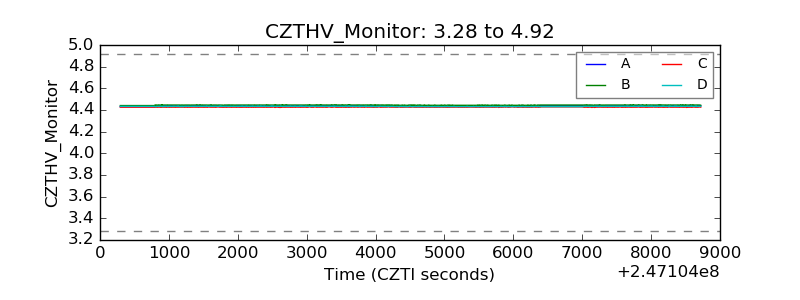 |
| D_VDD | 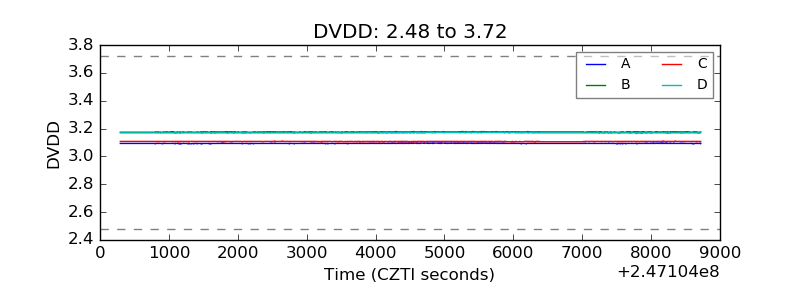 |
| Temperature 1 | 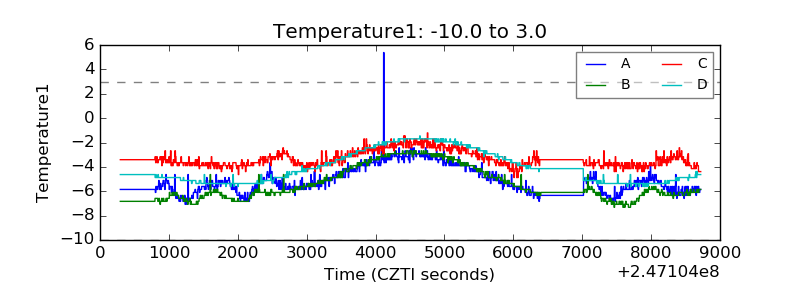 |
| Veto HV Monitor | 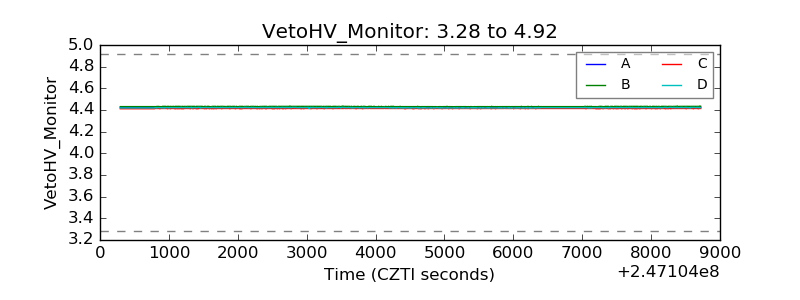 |
| Veto LLD | 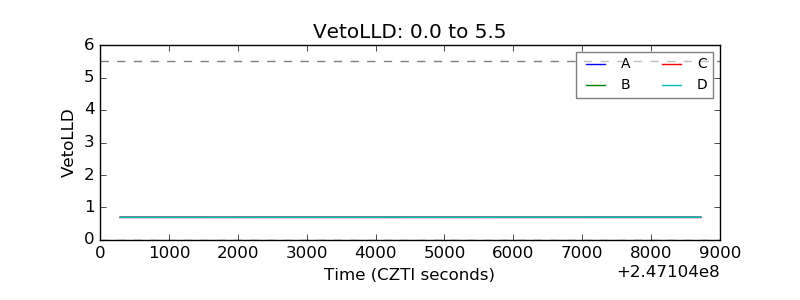 |
| Alpha Counter | 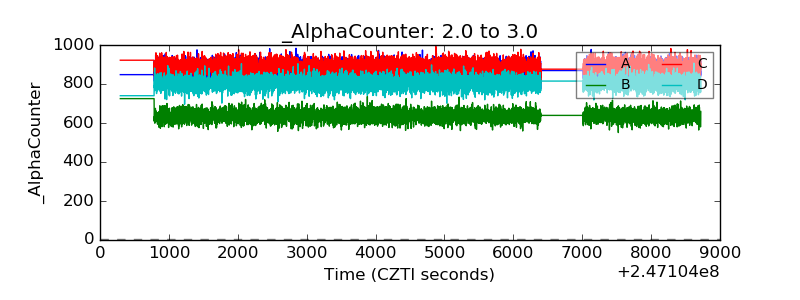 |
| _CPM_Rate | 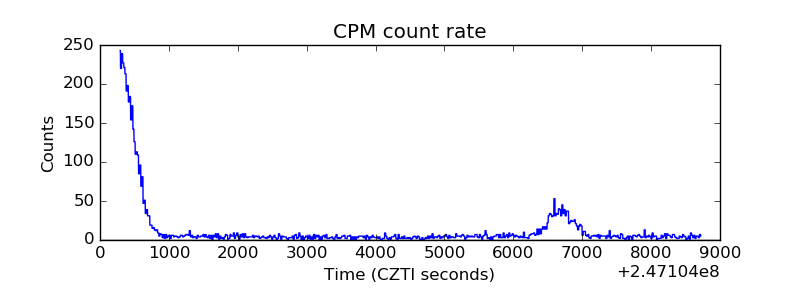 |
| CZT Counter |  |
| +2.5 Volts monitor |  |
| +5 Volts monitor | 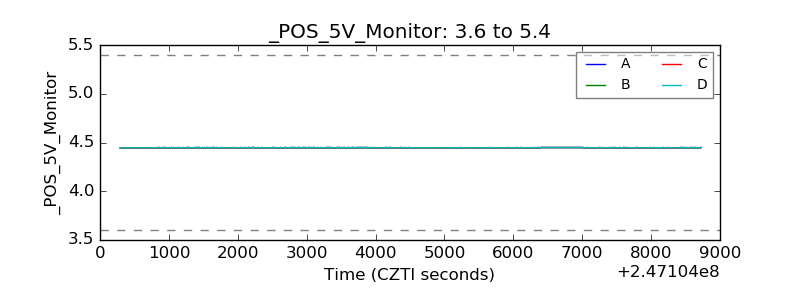 |
| _ROLL_ROT | 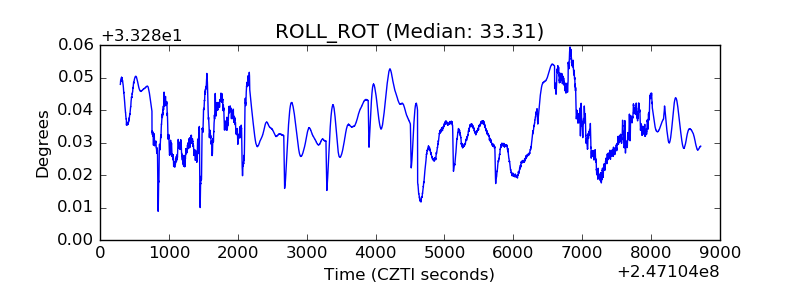 |
| _Roll_DEC | 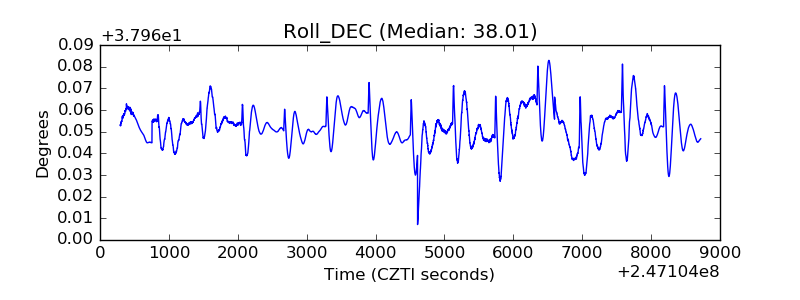 |
| _Roll_RA | 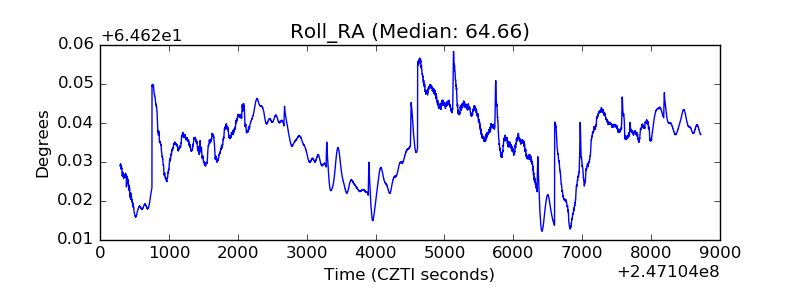 |
| Veto Counter | 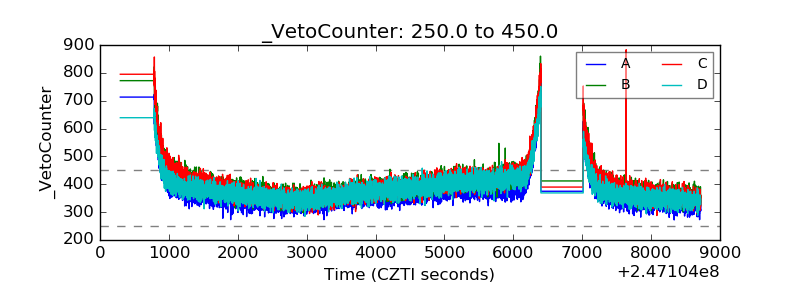 |