| Param | Original file | Final file |
|---|---|---|
| Filename | modeM0/AS1A04_144T01_9000001652_11309cztM0_level2.evt | modeM0/AS1A04_144T01_9000001652_11309cztM0_level2_quad_clean.evt |
| Size (bytes) | 1,177,061,760 | 152,078,400 |
| Size | 1.1 GB | 145.0 MB |
| Events in quadrant A | 8,557,940 | 963,135 |
| Events in quadrant B | 7,736,500 | 1,000,915 |
| Events in quadrant C | 5,760,834 | 987,174 |
| Events in quadrant D | 12,750,228 | 791,352 |
| Mode SS | |||
|---|---|---|---|
| Quadrant | BADHDUFLAG | Total packets | Discarded packets |
| A | 0 | 252 | 0 |
| B | 0 | 252 | 0 |
| C | 0 | 252 | 0 |
| D | 0 | 252 | 0 |
| Mode M0 | |||
|---|---|---|---|
| Quadrant | BADHDUFLAG | Total packets | Discarded packets |
| A | 0 | 33609 | 3 |
| B | 0 | 31318 | 2 |
| C | 0 | 25957 | 2 |
| D | 0 | 46397 | 2 |
| Mode M9 | |||
|---|---|---|---|
| Quadrant | BADHDUFLAG | Total packets | Discarded packets |
| A | 0 | 1 | 0 |
| B | 0 | 1 | 0 |
| C | 0 | 1 | 0 |
| D | 0 | 1 | 0 |
| Quadrant | Total seconds | Saturated seconds | Saturation percentage |
|---|---|---|---|
| A | 12463 | 935 | 7.502207% |
| B | 12463 | 919 | 7.373827% |
| C | 12463 | 243 | 1.949771% |
| D | 12463 | 2682 | 21.519698% |
Noise dominated data is calculated using 1-second bins in cleaned event files. If a bin has >2000 counts, and if more than 50% of those come from <1% of pixels, then it is considered to be noise-dominated and hence unusable.
| Quadrant | # 1 sec bins | Bins with >0 counts | Bins with >2000 counts | High rate bins dominated by noise | Noise dominated (total time) | Noise dominated (detector-on time) | Marked lightcurve |
|---|---|---|---|---|---|---|---|
| A | 12588 | 12466 | 429 | 429 | 3.41% | 3.44% |  |
| B | 12588 | 12466 | 320 | 320 | 2.54% | 2.57% |  |
| C | 12588 | 12466 | 15 | 15 | 0.12% | 0.12% | 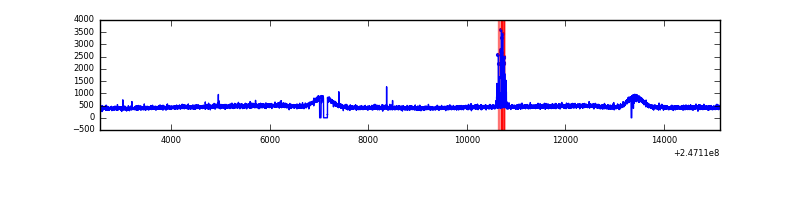 |
| D | 12588 | 12465 | 2056 | 2056 | 16.33% | 16.49% |  |
Top three noisy pixels from each quadrant. If the there are fewer than three noisy pixels in the level2.evt file, extra rows are filled as -1
| Pixel properties | Quadrant properties | ||||||
|---|---|---|---|---|---|---|---|
| Quadrant | DetID | PixID | Counts | Sigma | Mean | Median | Sigma |
| A | 8 | 5 | 2349445 | 7793.21 | 1469 | 1436 | 301.3 |
| A | 0 | 8 | 286174 | 945.07 | 1469 | 1436 | 301.3 |
| A | 1 | 162 | 65726 | 213.38 | 1469 | 1436 | 301.3 |
| B | 4 | 239 | 1455540 | 5107.87 | 1477 | 1440 | 284.7 |
| B | 3 | 64 | 401123 | 1403.98 | 1477 | 1440 | 284.7 |
| B | 3 | 189 | 60547 | 207.63 | 1477 | 1440 | 284.7 |
| C | 14 | 234 | 100184 | 292.67 | 1450 | 1453 | 337.3 |
| C | 13 | 61 | 10704 | 27.42 | 1450 | 1453 | 337.3 |
| C | 8 | 128 | 5063 | 10.7 | 1450 | 1453 | 337.3 |
| D | 10 | 253 | 4361132 | 14088.16 | 1275 | 1234 | 309.5 |
| D | 1 | 52 | 2959438 | 9558.86 | 1275 | 1234 | 309.5 |
| D | 13 | 104 | 314806 | 1013.25 | 1275 | 1234 | 309.5 |
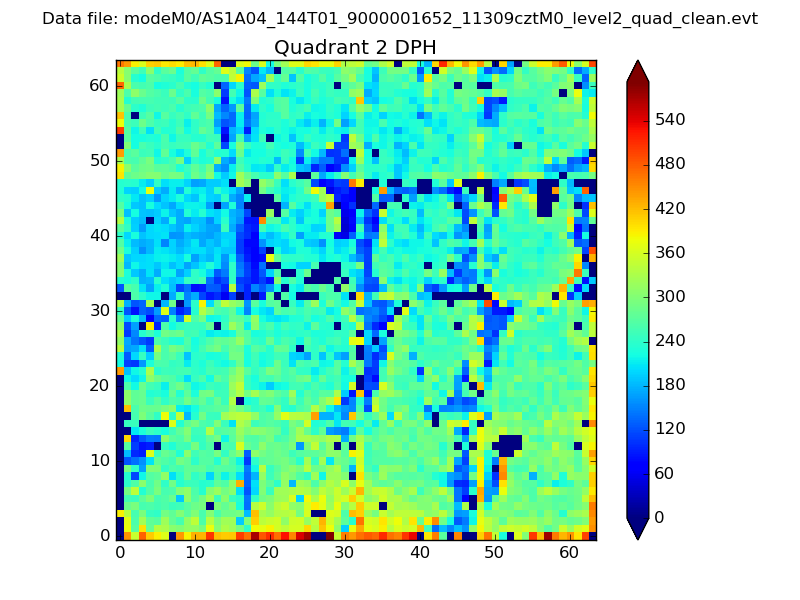
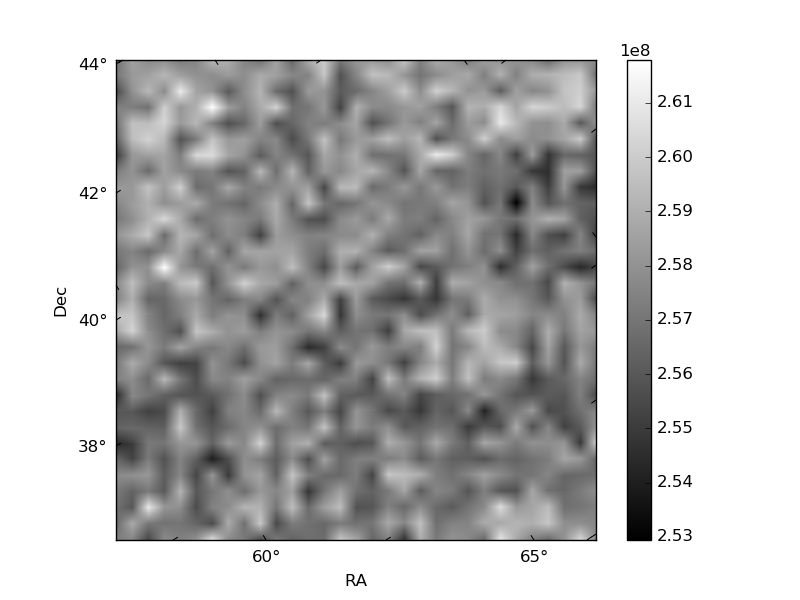
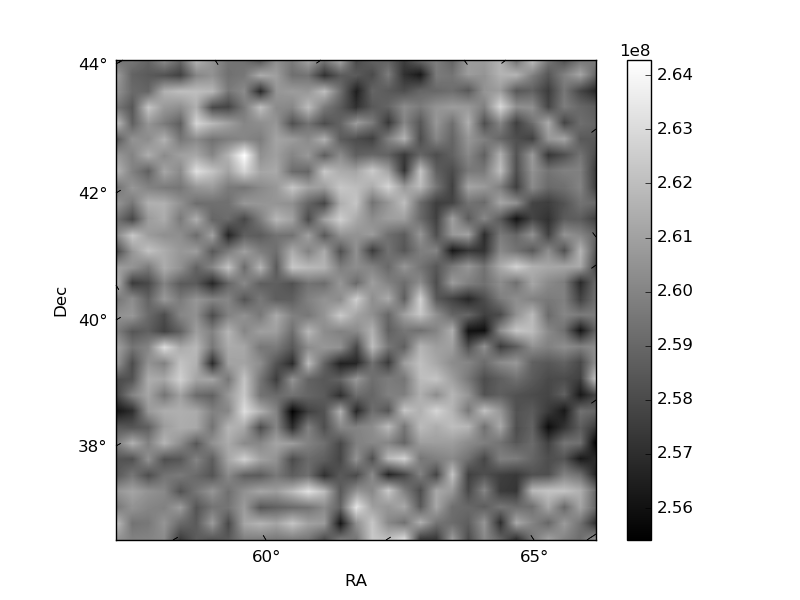
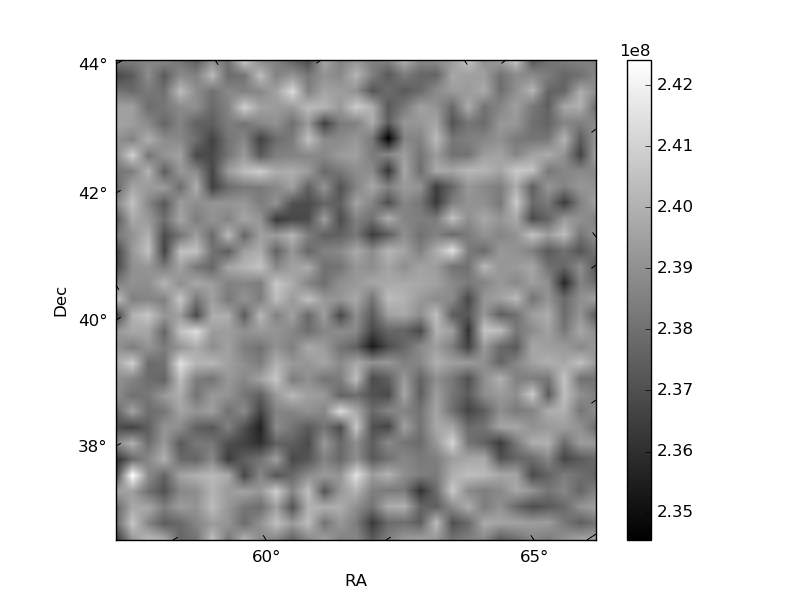
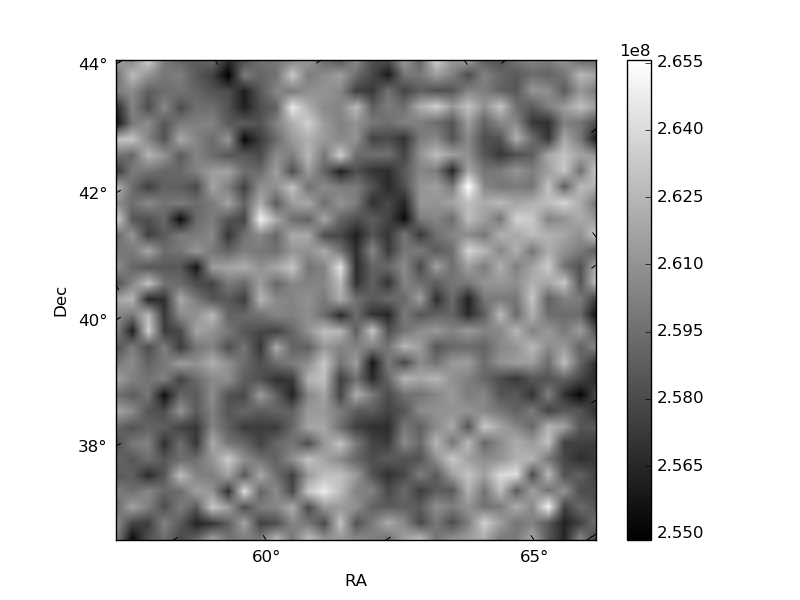
Histogram calculated using DETX and DETY for each event in the final _common_clean file
| Quadrant A | 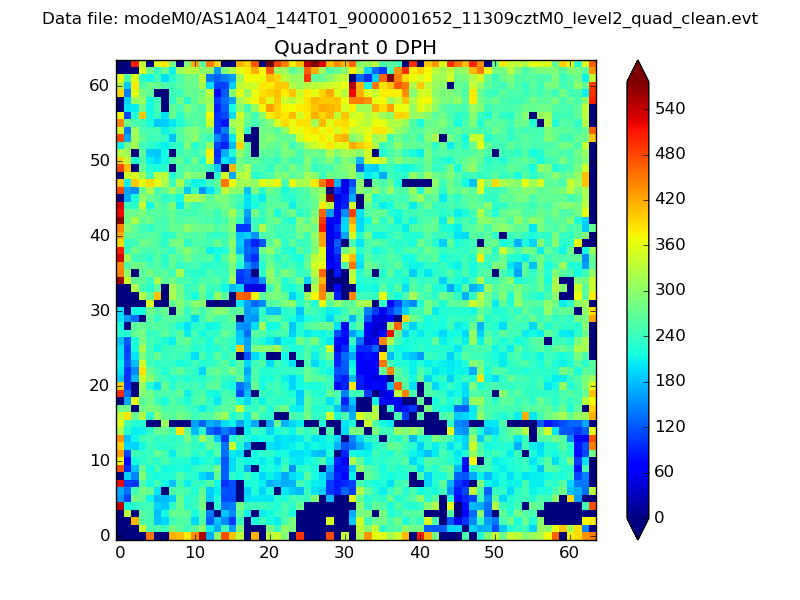 |
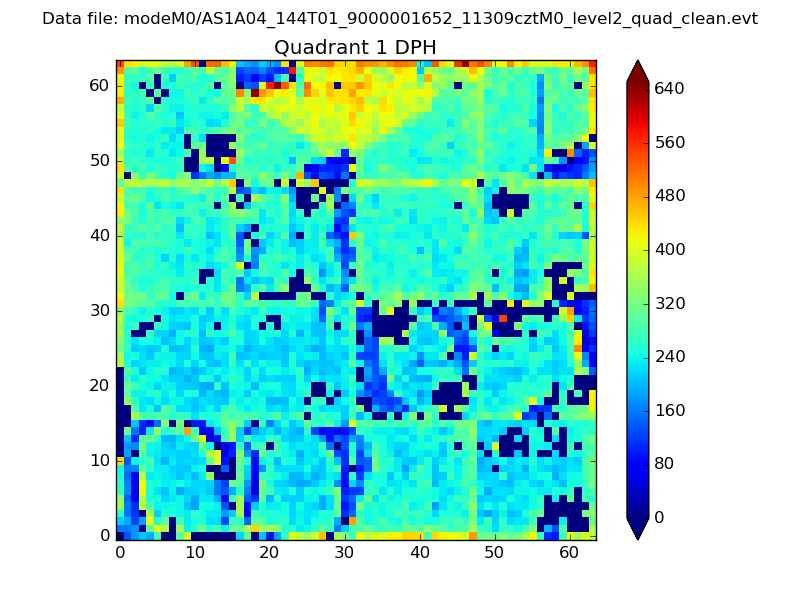 |
Quadrant B |
|---|---|---|---|
| Quadrant D | 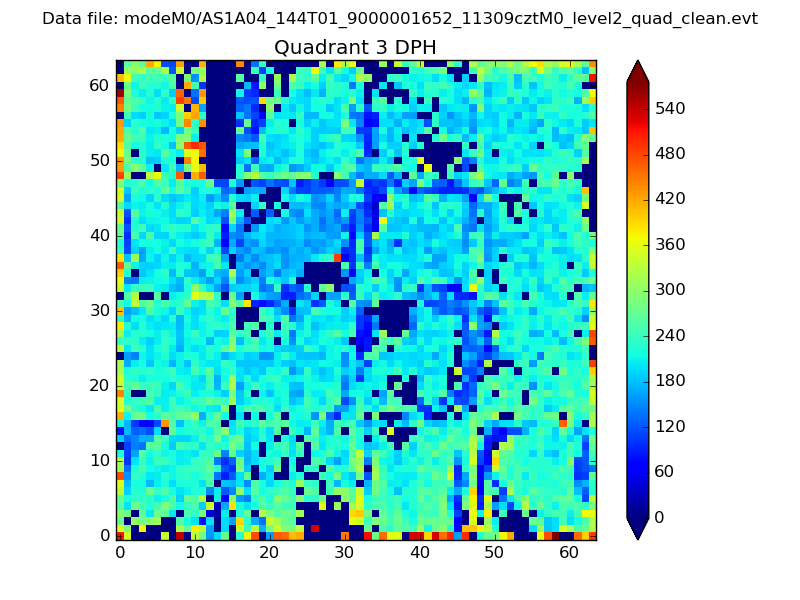 |
 |
Quadrant C |
| Plot type | Count rate plots | Images |
|---|---|---|
| Comparison with Poisson distribution Blue bars denote a histogram of data divided into 1 sec bins. Red curve is a Poisson curve with rate = median count rate of data. |
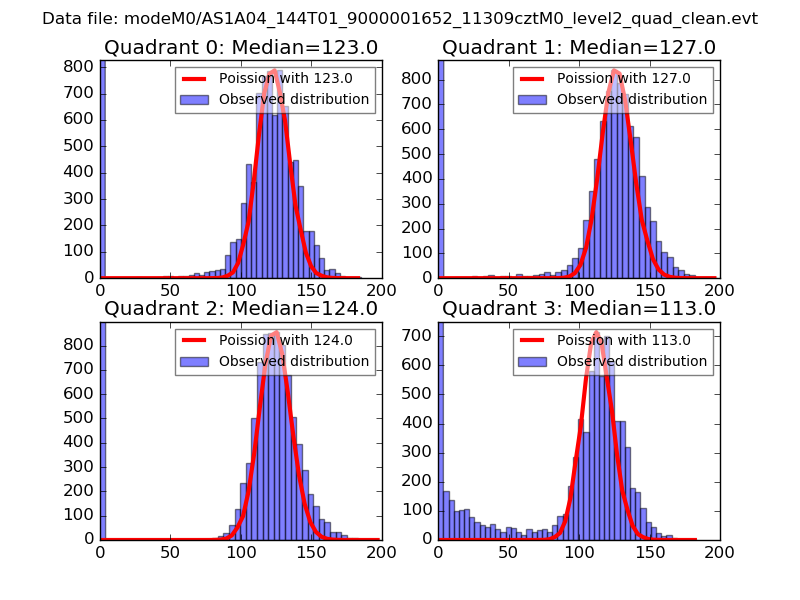 |
 |
| Quadrant-wise count rates Data is divided into 100 sec bins |
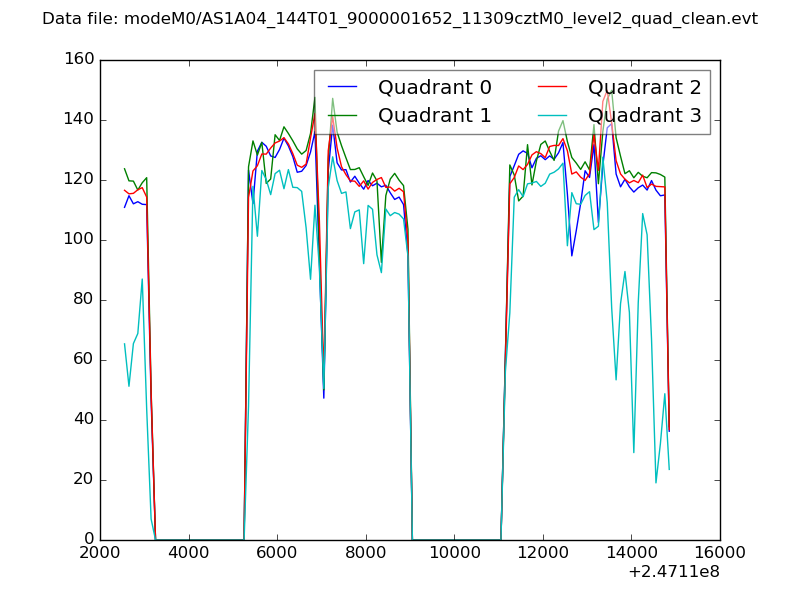 |
|
| Module-wise count rates for Quadrant A Data is divided into 100 sec bins |
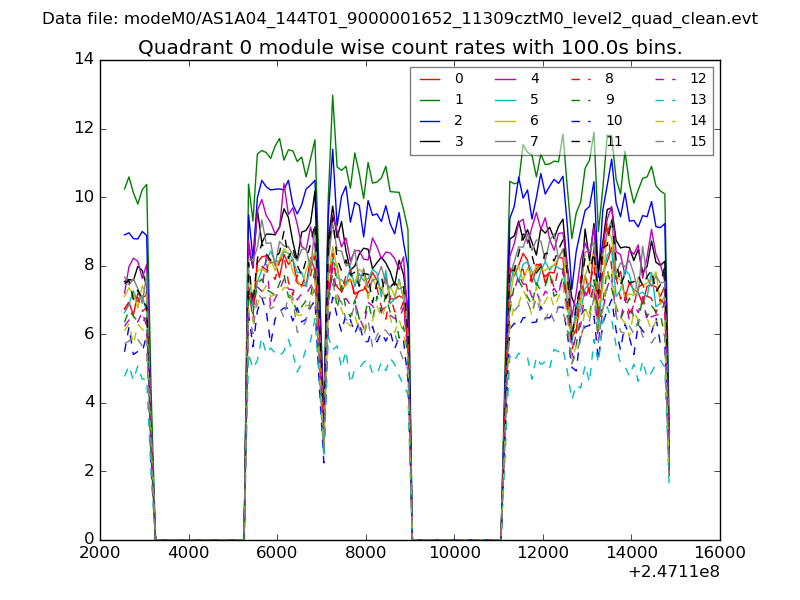 |
 |
| Module-wise count rates for Quadrant B Data is divided into 100 sec bins |
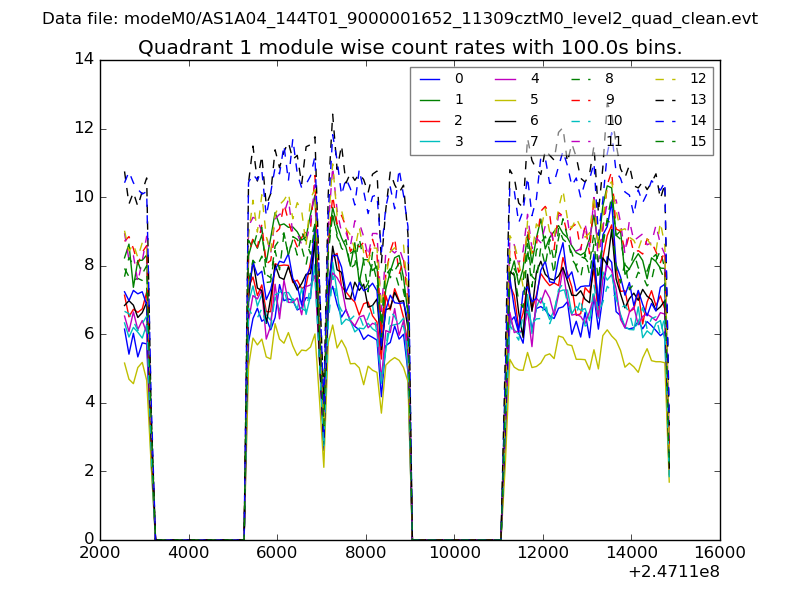 |
 |
| Module-wise count rates for Quadrant C Data is divided into 100 sec bins |
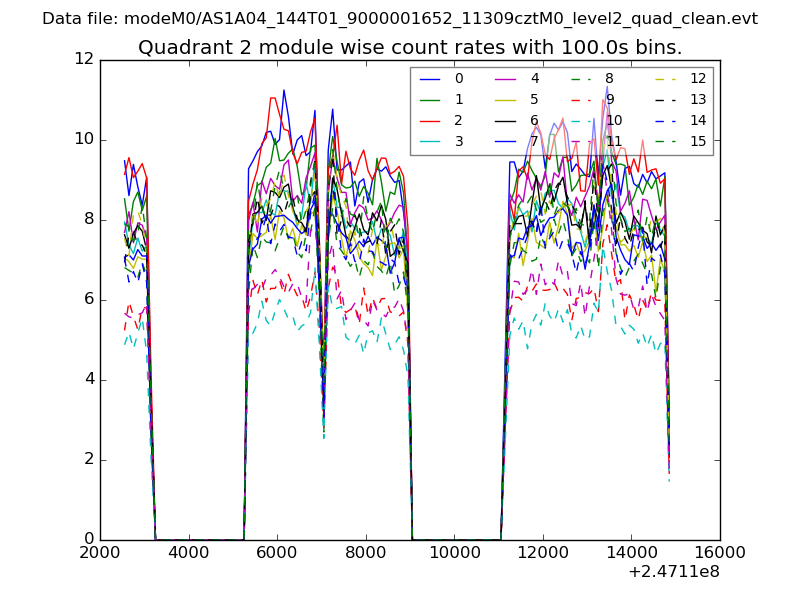 |
 |
| Module-wise count rates for Quadrant D Data is divided into 100 sec bins |
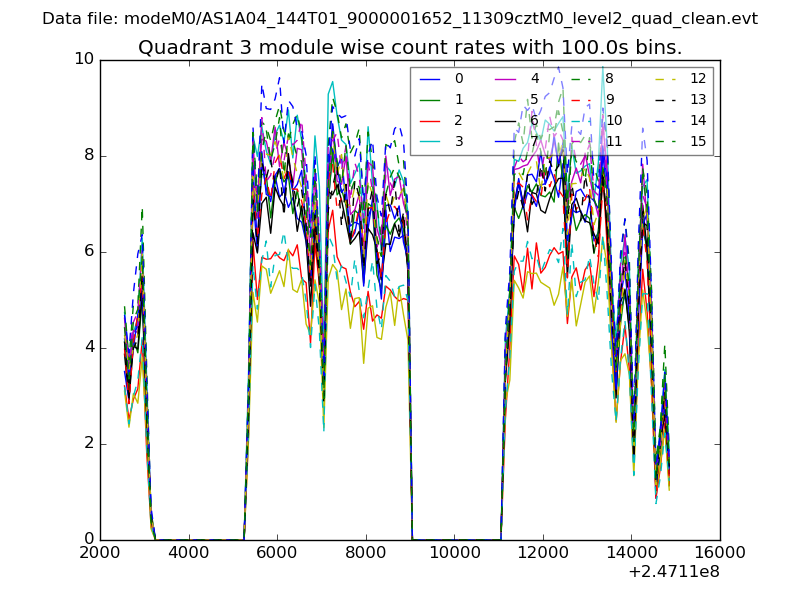 |
 |
| Parameter | Plot |
|---|---|
| CZT HV Monitor | 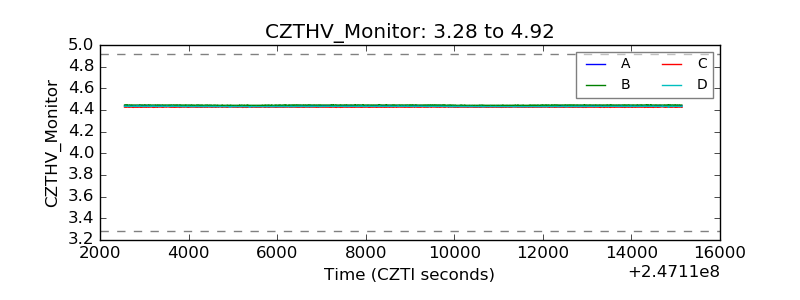 |
| D_VDD | 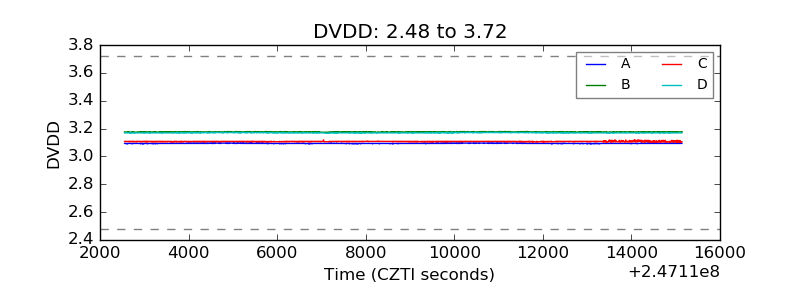 |
| Temperature 1 | 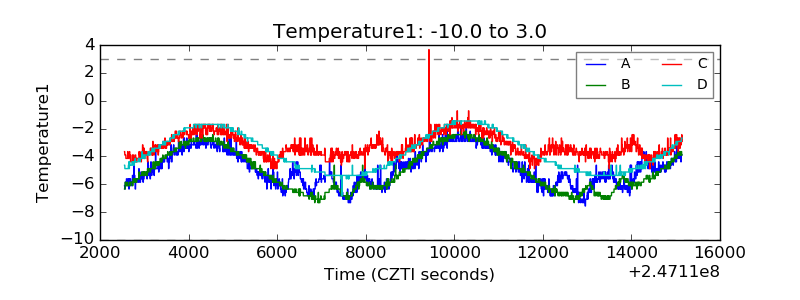 |
| Veto HV Monitor | 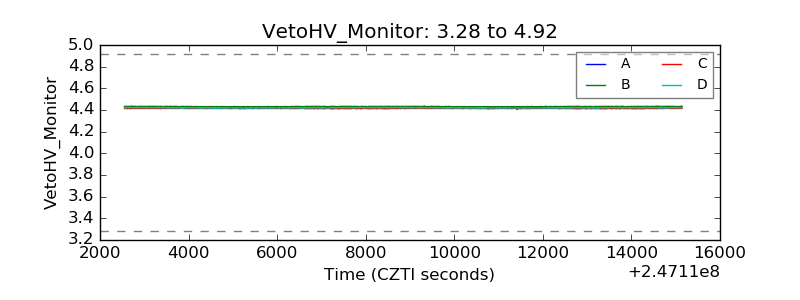 |
| Veto LLD | 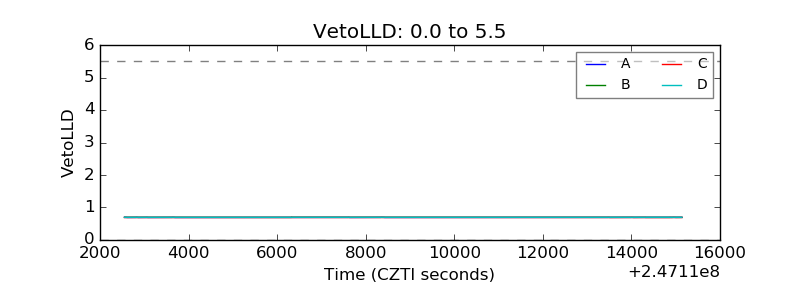 |
| Alpha Counter | 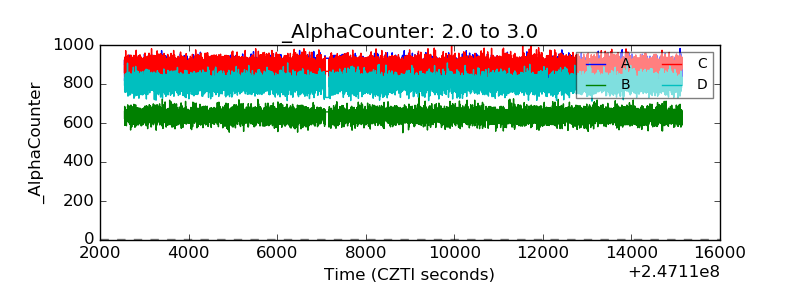 |
| _CPM_Rate | 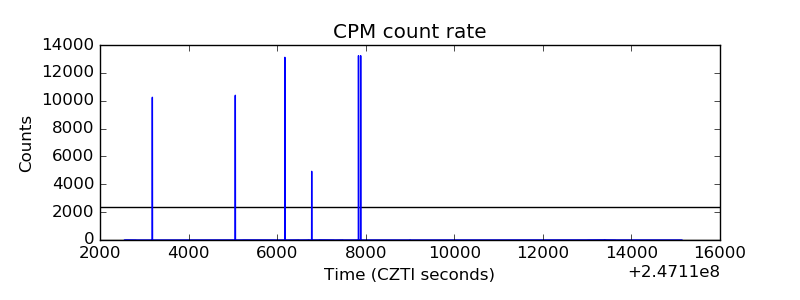 |
| CZT Counter | 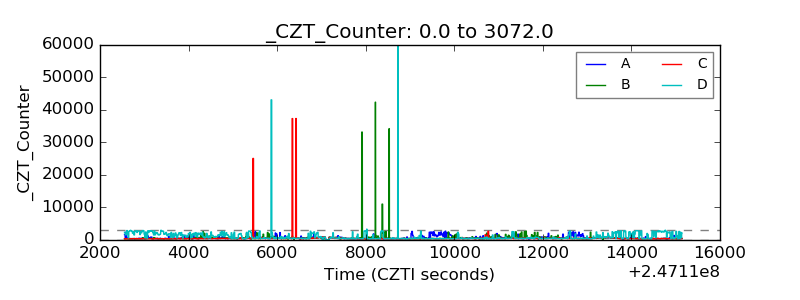 |
| +2.5 Volts monitor |  |
| +5 Volts monitor |  |
| _ROLL_ROT | 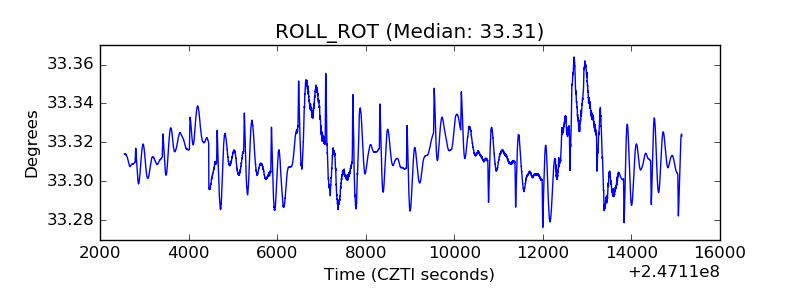 |
| _Roll_DEC | 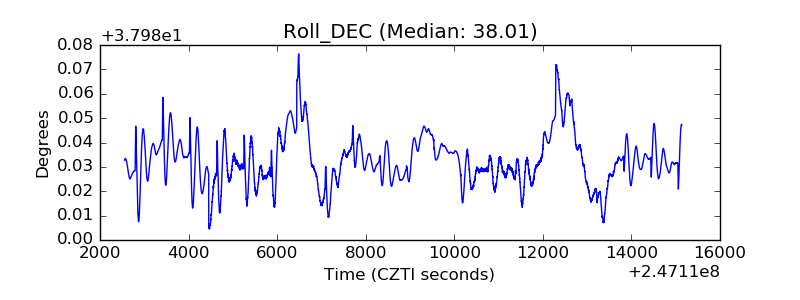 |
| _Roll_RA | 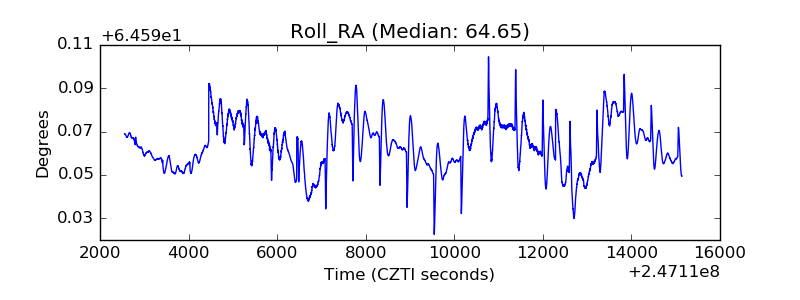 |
| Veto Counter | 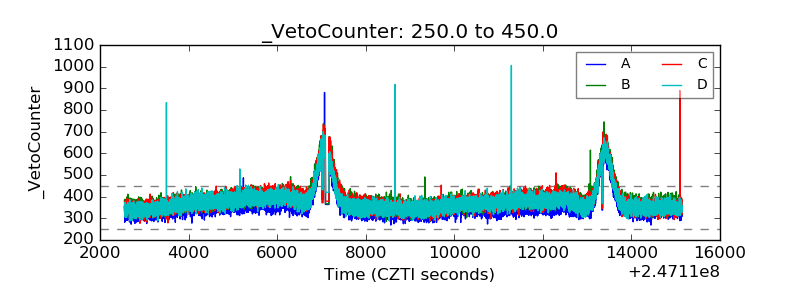 |