| Param | Original file | Final file |
|---|---|---|
| Filename | modeM0/AS1A04_144T01_9000001652_11312cztM0_level2.evt | modeM0/AS1A04_144T01_9000001652_11312cztM0_level2_quad_clean.evt |
| Size (bytes) | 339,963,840 | 46,157,760 |
| Size | 324.2 MB | 44.0 MB |
| Events in quadrant A | 2,558,805 | 275,710 |
| Events in quadrant B | 2,867,473 | 278,593 |
| Events in quadrant C | 1,923,792 | 275,605 |
| Events in quadrant D | 2,642,948 | 254,901 |
| Mode SS | |||
|---|---|---|---|
| Quadrant | BADHDUFLAG | Total packets | Discarded packets |
| A | 0 | 88 | 0 |
| B | 0 | 88 | 0 |
| C | 0 | 88 | 0 |
| D | 0 | 88 | 0 |
| Mode M0 | |||
|---|---|---|---|
| Quadrant | BADHDUFLAG | Total packets | Discarded packets |
| A | 0 | 10346 | 0 |
| B | 0 | 11409 | 0 |
| C | 0 | 8907 | 0 |
| D | 0 | 10869 | 0 |
| Quadrant | Total seconds | Saturated seconds | Saturation percentage |
|---|---|---|---|
| A | 4445 | 105 | 2.362205% |
| B | 4445 | 248 | 5.579303% |
| C | 4445 | 2 | 0.044994% |
| D | 4445 | 179 | 4.026997% |
Noise dominated data is calculated using 1-second bins in cleaned event files. If a bin has >2000 counts, and if more than 50% of those come from <1% of pixels, then it is considered to be noise-dominated and hence unusable.
| Quadrant | # 1 sec bins | Bins with >0 counts | Bins with >2000 counts | High rate bins dominated by noise | Noise dominated (total time) | Noise dominated (detector-on time) | Marked lightcurve |
|---|---|---|---|---|---|---|---|
| A | 4445 | 4445 | 85 | 85 | 1.91% | 1.91% | 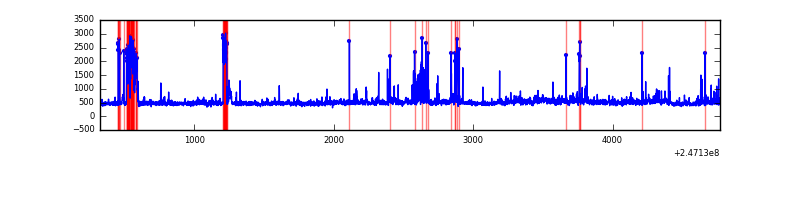 |
| B | 4445 | 4445 | 167 | 167 | 3.76% | 3.76% | 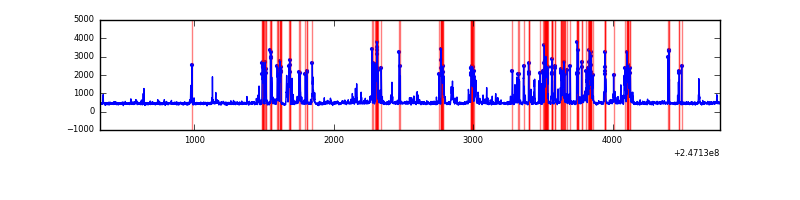 |
| C | 4445 | 4445 | 0 | 0 | 0.00% | 0.00% | 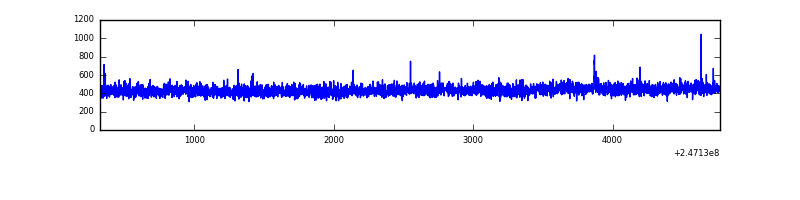 |
| D | 4445 | 4445 | 125 | 125 | 2.81% | 2.81% | 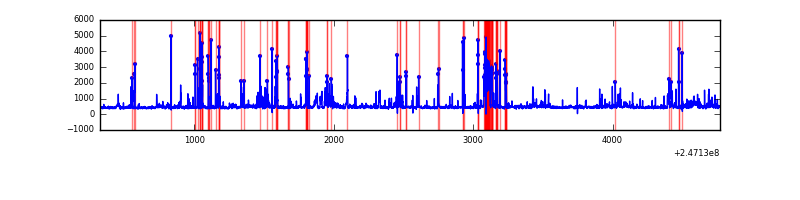 |
Top three noisy pixels from each quadrant. If the there are fewer than three noisy pixels in the level2.evt file, extra rows are filled as -1
| Pixel properties | Quadrant properties | ||||||
|---|---|---|---|---|---|---|---|
| Quadrant | DetID | PixID | Counts | Sigma | Mean | Median | Sigma |
| A | 8 | 5 | 383604 | 3673.56 | 502 | 491 | 104.3 |
| A | 0 | 8 | 131333 | 1254.61 | 502 | 491 | 104.3 |
| A | 1 | 162 | 27726 | 261.15 | 502 | 491 | 104.3 |
| B | 4 | 239 | 587793 | 6051.68 | 499 | 488 | 97.0 |
| B | 3 | 64 | 252671 | 2598.53 | 499 | 488 | 97.0 |
| B | 4 | 80 | 25382 | 256.51 | 499 | 488 | 97.0 |
| C | 9 | 204 | 6186 | 49.37 | 491 | 493 | 115.3 |
| C | 13 | 61 | 3499 | 26.07 | 491 | 493 | 115.3 |
| C | 14 | 234 | 2525 | 17.62 | 491 | 493 | 115.3 |
| D | 1 | 52 | 423053 | 3659.14 | 478 | 464 | 115.5 |
| D | 10 | 253 | 213840 | 1847.59 | 478 | 464 | 115.5 |
| D | 13 | 104 | 74666 | 642.5 | 478 | 464 | 115.5 |
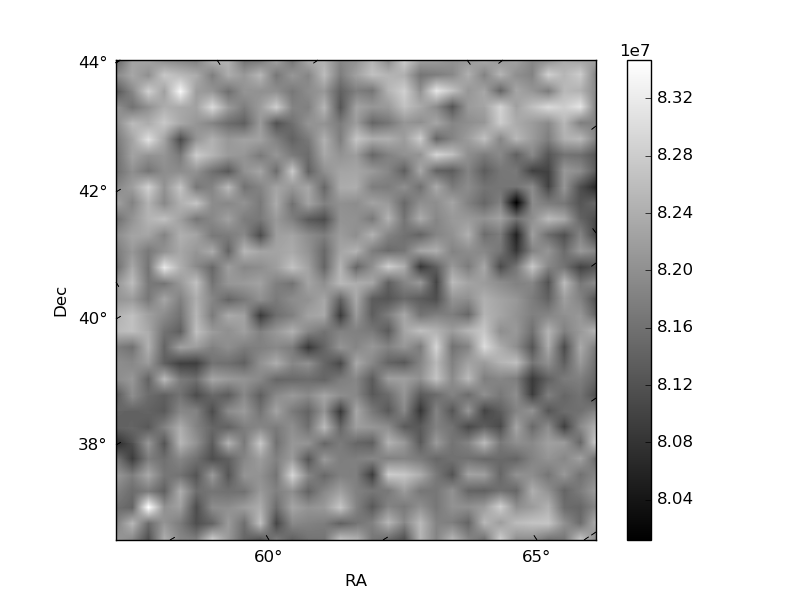
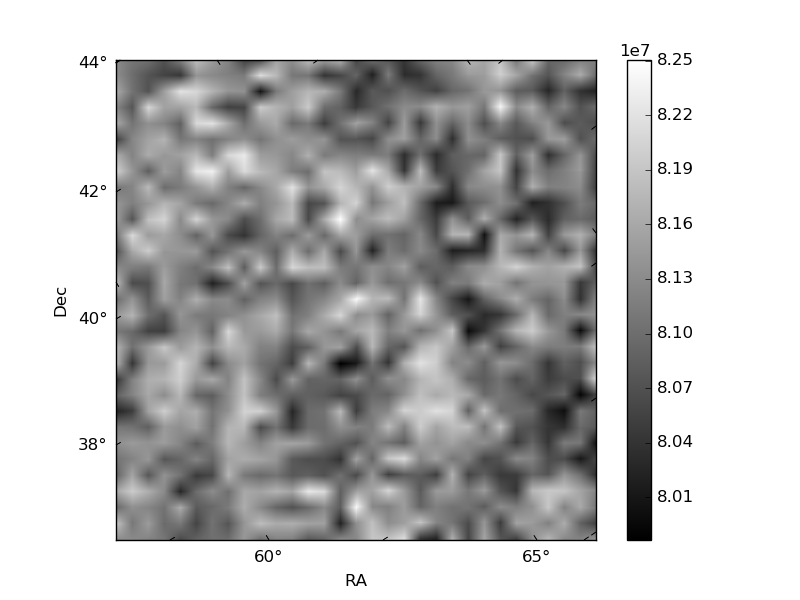
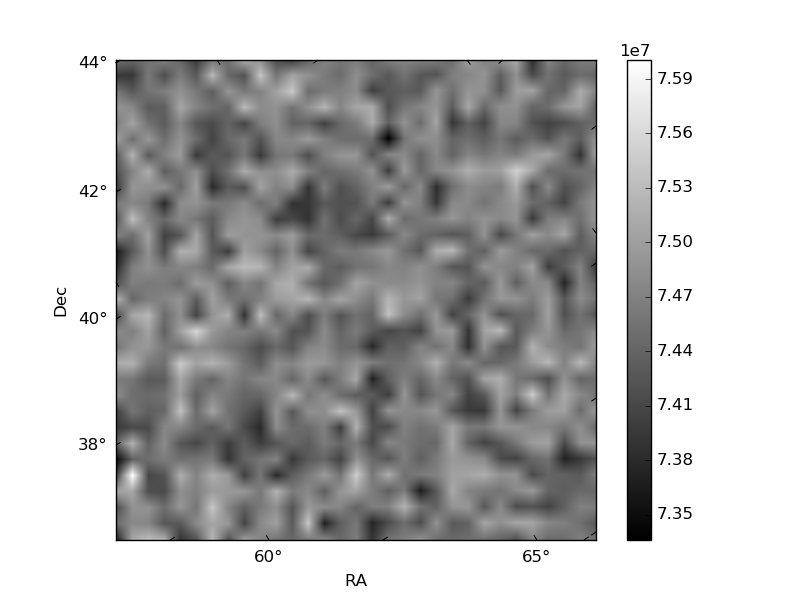
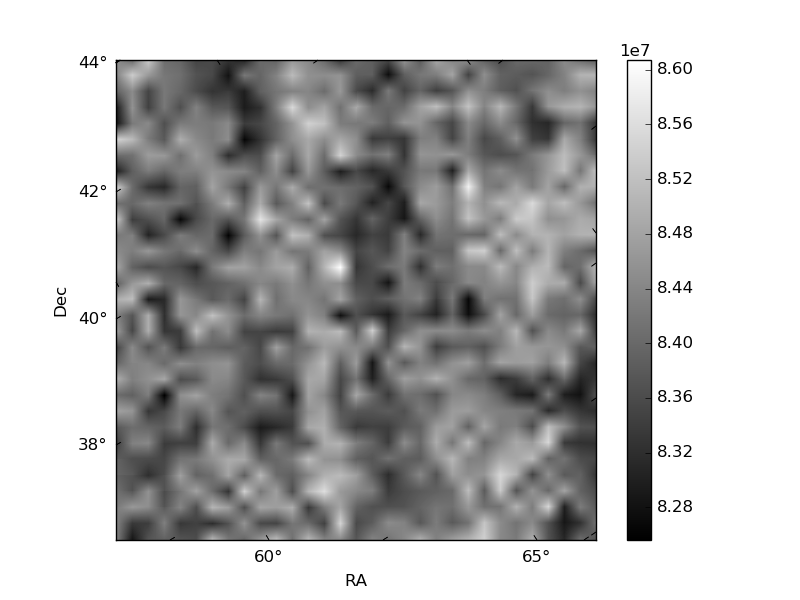
Histogram calculated using DETX and DETY for each event in the final _common_clean file
| Quadrant A | 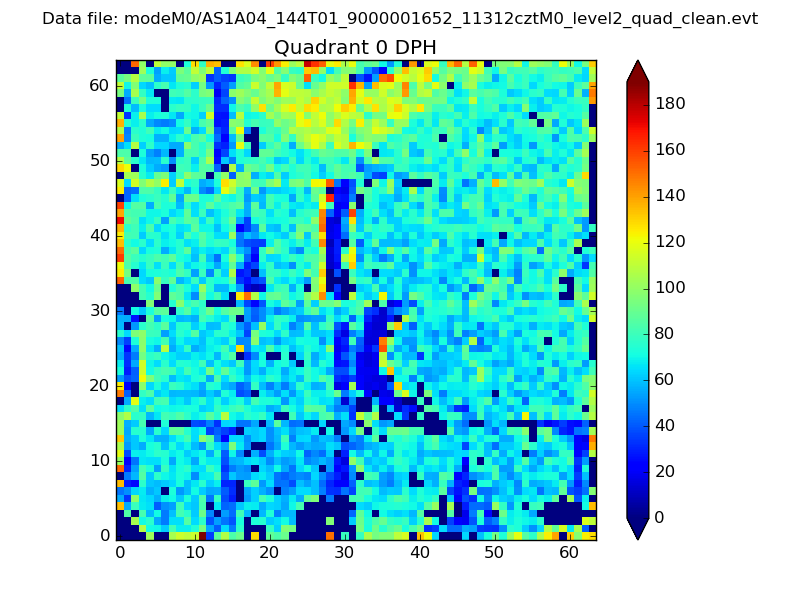 |
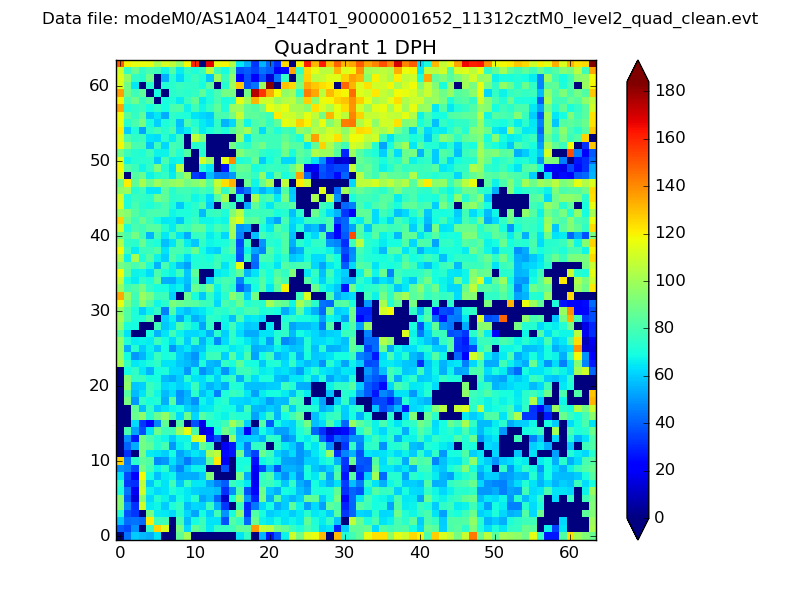 |
Quadrant B |
|---|---|---|---|
| Quadrant D | 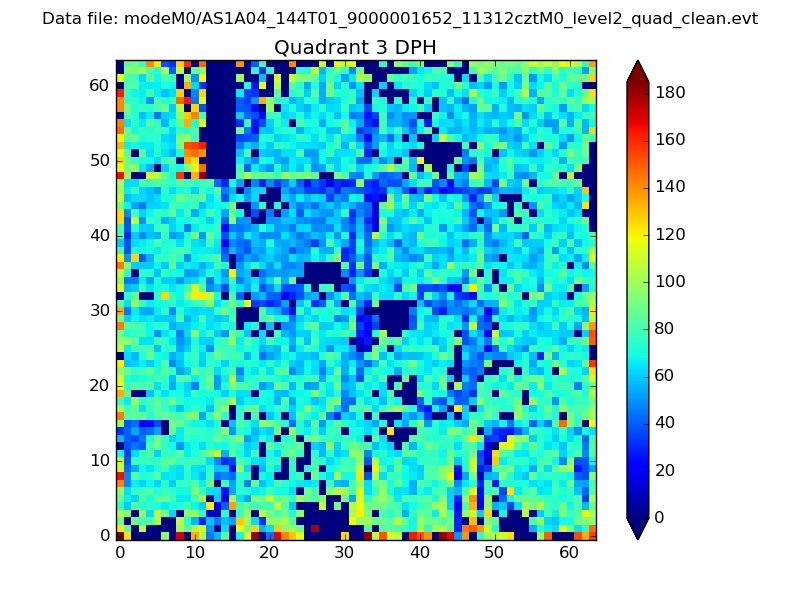 |
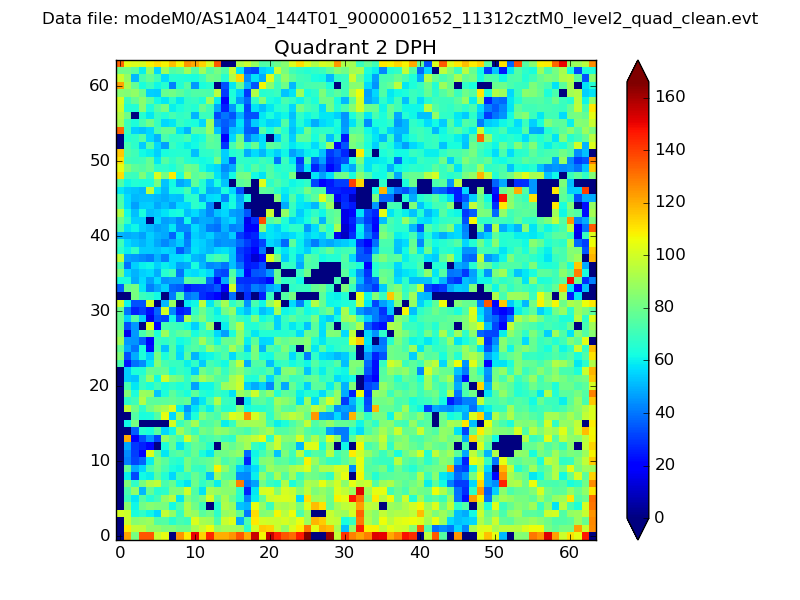 |
Quadrant C |
| Plot type | Count rate plots | Images |
|---|---|---|
| Comparison with Poisson distribution Blue bars denote a histogram of data divided into 1 sec bins. Red curve is a Poisson curve with rate = median count rate of data. |
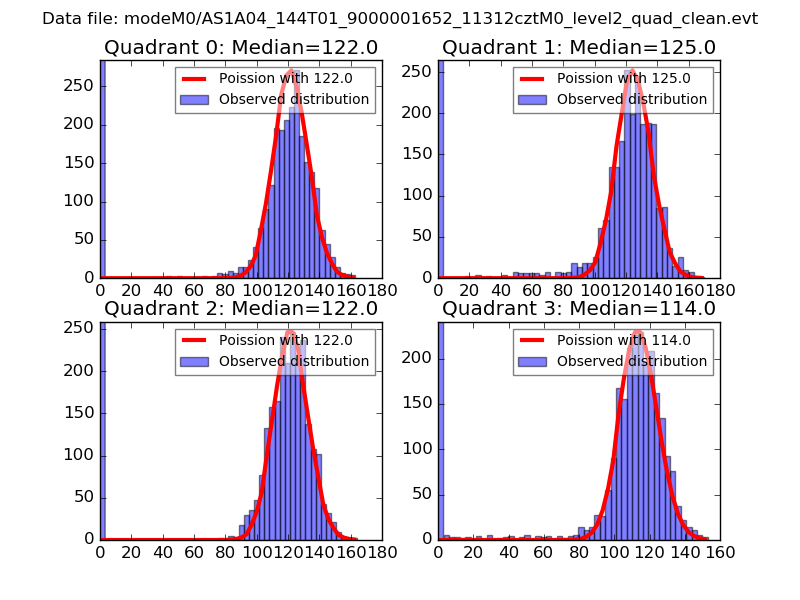 |
 |
| Quadrant-wise count rates Data is divided into 100 sec bins |
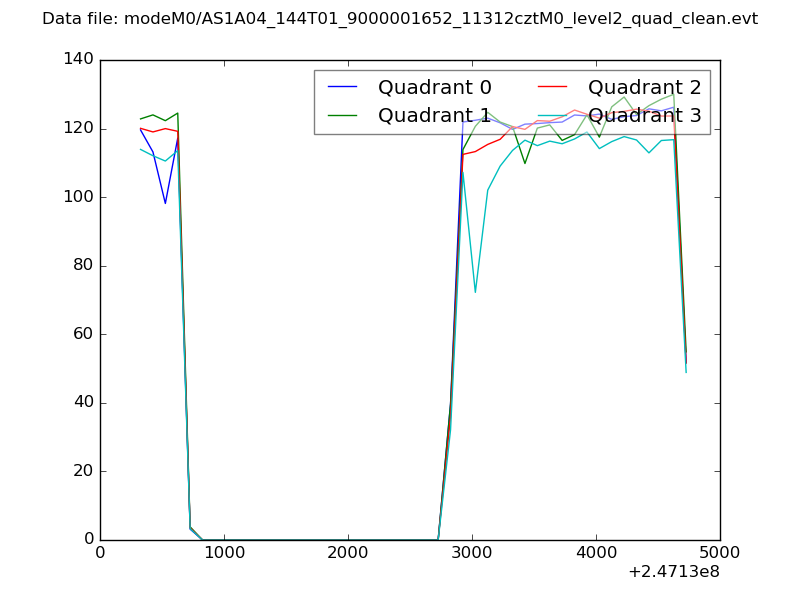 |
|
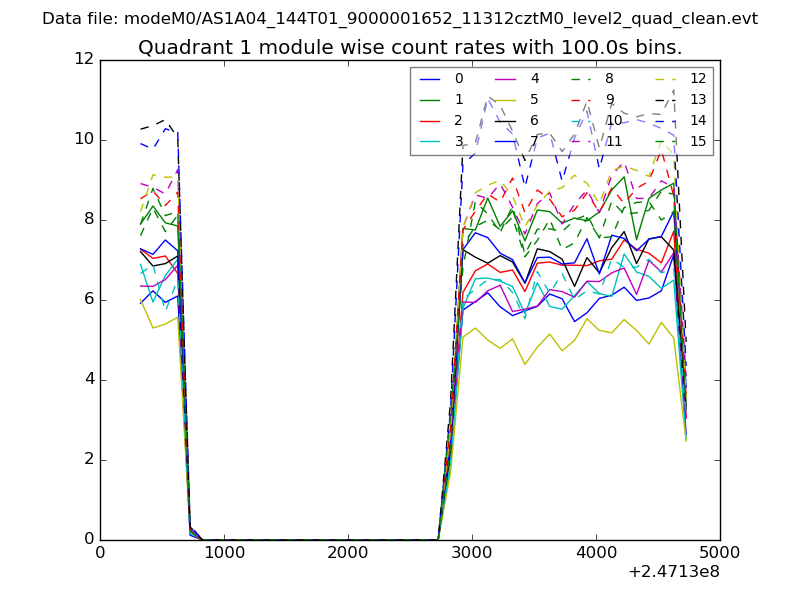
| Module-wise count rates for Quadrant A Data is divided into 100 sec bins |
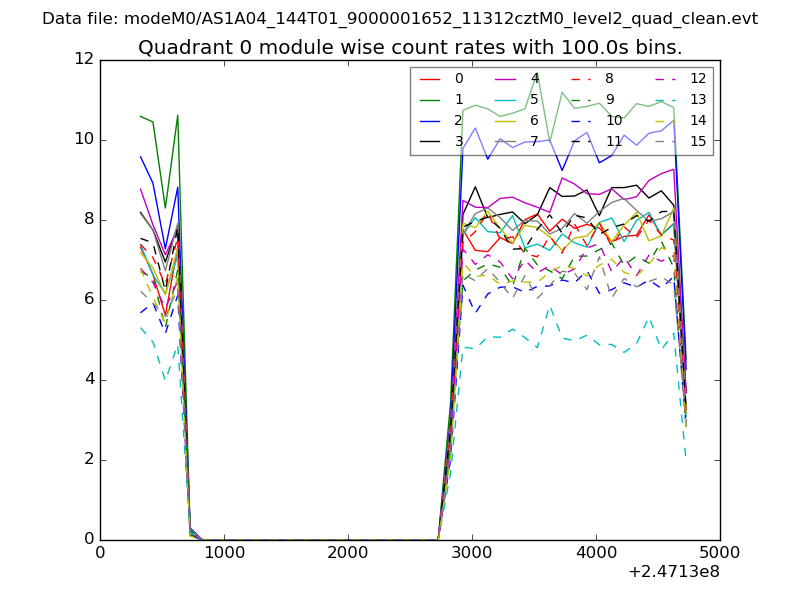 |
 |
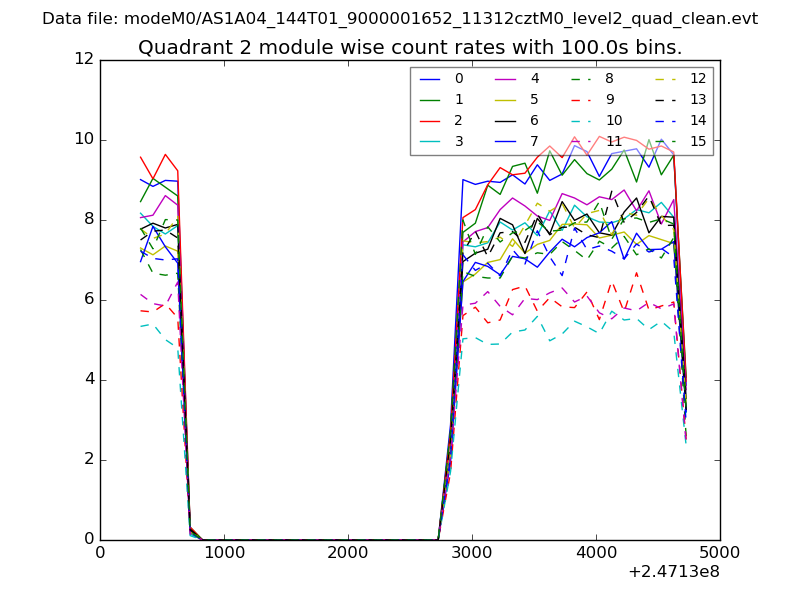
| Module-wise count rates for Quadrant B Data is divided into 100 sec bins |
 |
 |
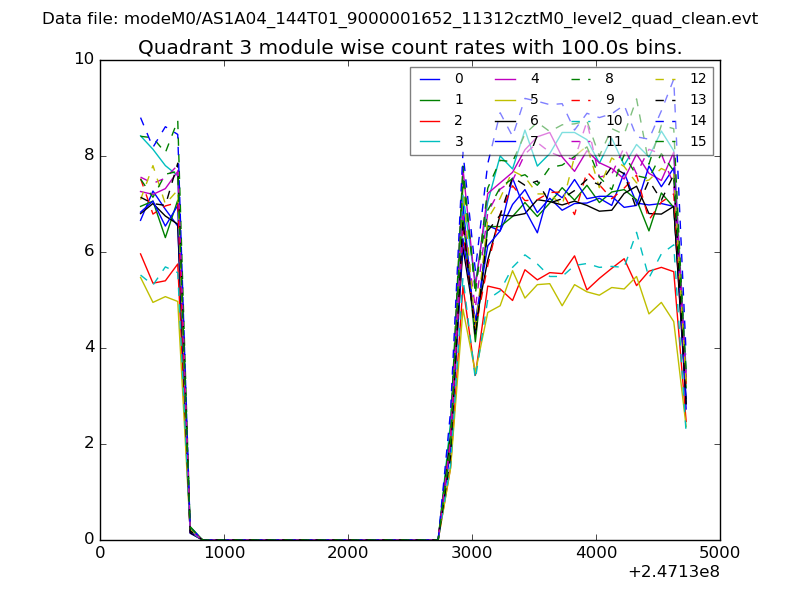
| Module-wise count rates for Quadrant C Data is divided into 100 sec bins |
 |
 |
| Module-wise count rates for Quadrant D Data is divided into 100 sec bins |
 |
 |
| Parameter | Plot |
|---|---|
| CZT HV Monitor | 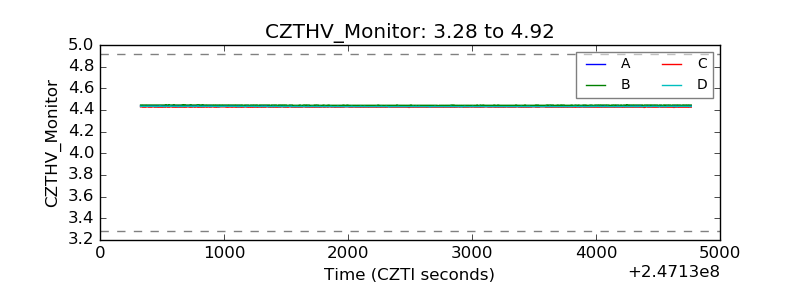 |
| D_VDD | 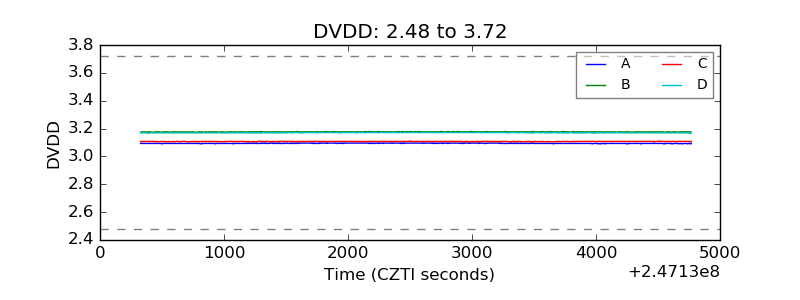 |
| Temperature 1 | 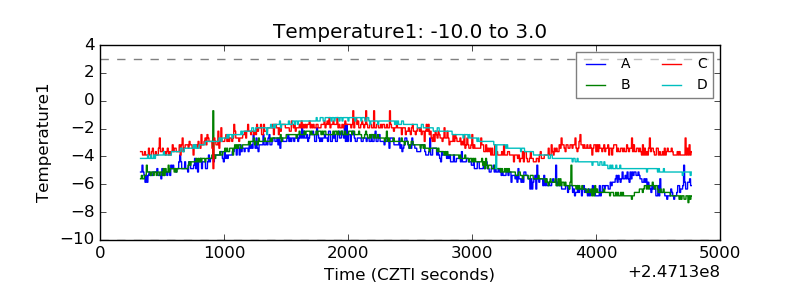 |
| Veto HV Monitor | 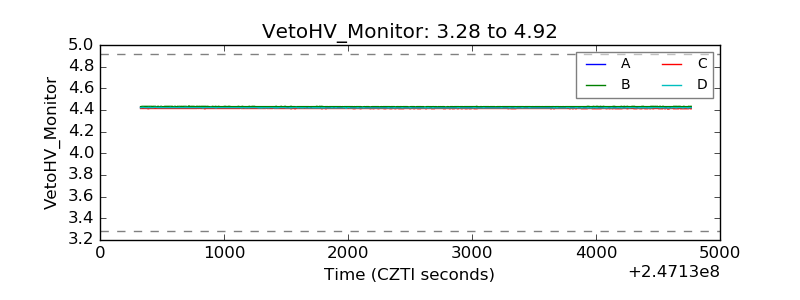 |
| Veto LLD | 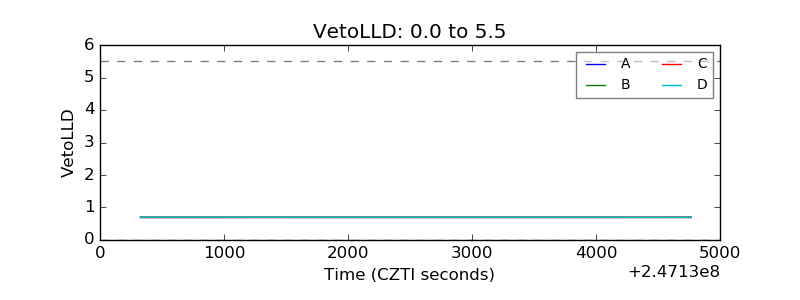 |
| Alpha Counter | 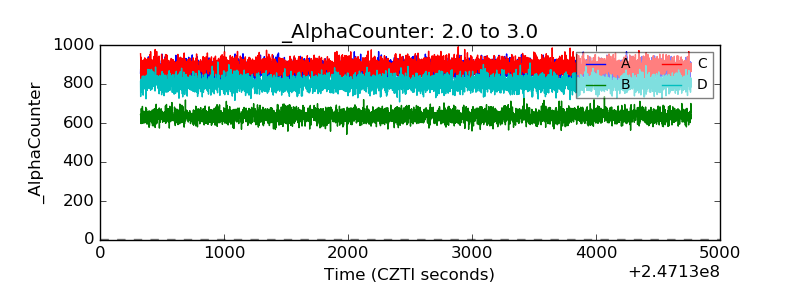 |
| _CPM_Rate | 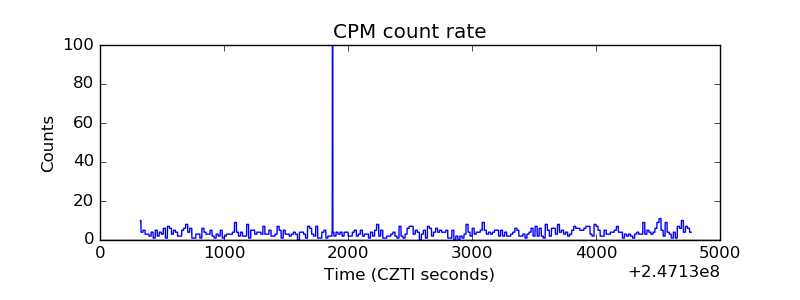 |
| CZT Counter | 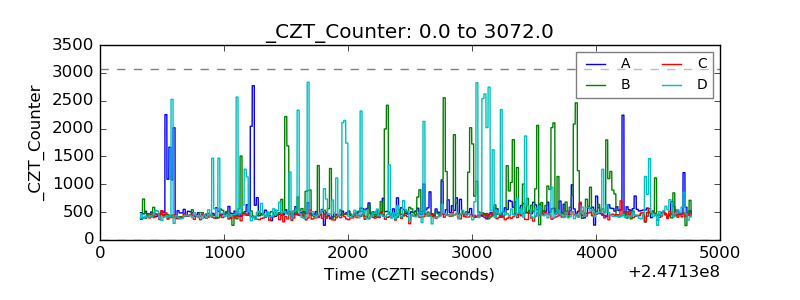 |
| +2.5 Volts monitor |  |
| +5 Volts monitor |  |
| _ROLL_ROT | 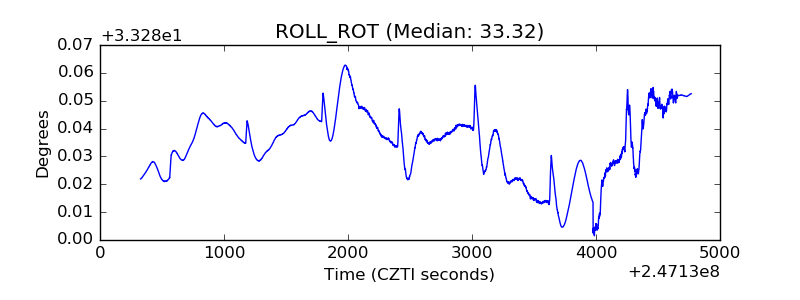 |
| _Roll_DEC | 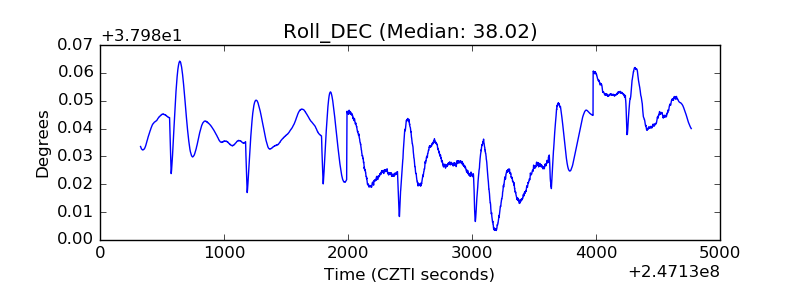 |
| _Roll_RA | 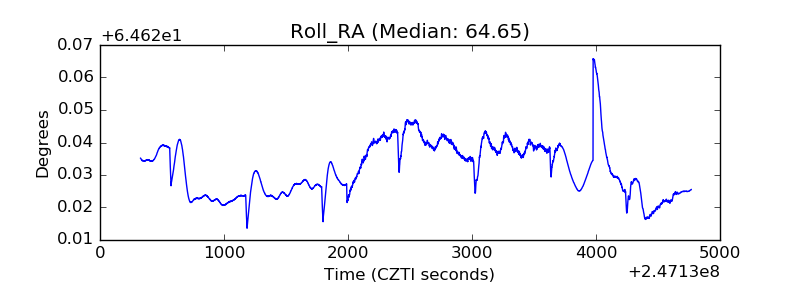 |
| Veto Counter | 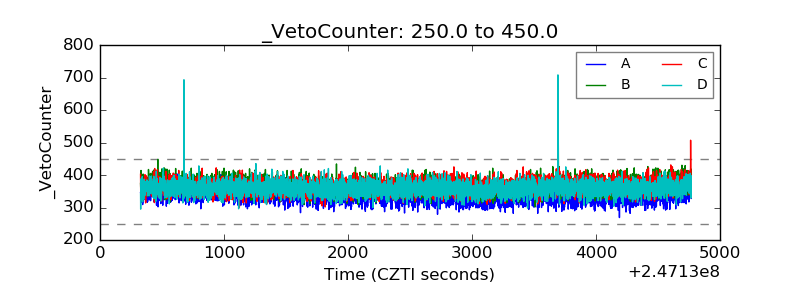 |