| Param | Original file | Final file |
|---|---|---|
| Filename | modeM0/AS1A04_137T01_9000001654cztM0_level2.fits | modeM0/AS1A04_137T01_9000001654cztM0_level2_quad_clean.evt |
| Size (bytes) | 263,226,240 | 236,897,280 |
| Size | 251.0 MB | 225.9 MB |
| Events in quadrant A | 1,597,260 | 1,368,080 |
| Events in quadrant B | 1,504,236 | 1,263,406 |
| Events in quadrant C | 1,600,114 | 1,395,581 |
| Events in quadrant D | 1,325,838 | 1,204,238 |
| Mode M9 | |||
|---|---|---|---|
| Quadrant | BADHDUFLAG | Total packets | Discarded packets |
| A | 0 | 53 | 0 |
| B | 0 | 53 | 0 |
| C | 0 | 53 | 0 |
| D | 0 | 53 | 0 |
| Mode M0 | |||
|---|---|---|---|
| Quadrant | BADHDUFLAG | Total packets | Discarded packets |
| A | 0 | 73290 | 0 |
| B | 0 | 81996 | 0 |
| C | 0 | 61409 | 0 |
| D | 0 | 86245 | 0 |
| Mode SS | |||
|---|---|---|---|
| Quadrant | BADHDUFLAG | Total packets | Discarded packets |
| A | 0 | 576 | 0 |
| B | 0 | 576 | 0 |
| C | 0 | 576 | 0 |
| D | 0 | 576 | 0 |
| Quadrant | Total seconds | Saturated seconds | Saturation percentage |
|---|---|---|---|
| A | 28241 | 1186 | 4.199568% |
| B | 28241 | 2500 | 8.852378% |
| C | 28241 | 485 | 1.717361% |
| D | 28241 | 2574 | 9.114408% |
Noise dominated data is calculated using 1-second bins in cleaned event files. If a bin has >2000 counts, and if more than 50% of those come from <1% of pixels, then it is considered to be noise-dominated and hence unusable.
| Quadrant | # 1 sec bins | Bins with >0 counts | Bins with >2000 counts | High rate bins dominated by noise | Noise dominated (total time) | Noise dominated (detector-on time) | Marked lightcurve |
|---|---|---|---|---|---|---|---|
| A | 33340 | 28240 | 0 | 0 | 0.00% | 0.00% | 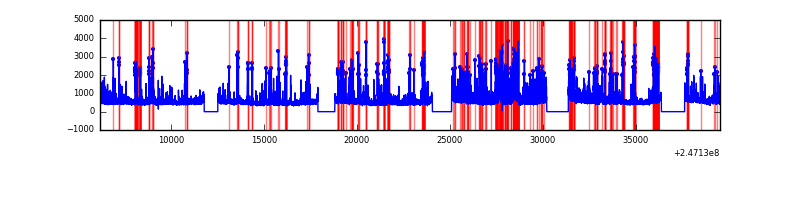 |
| B | 33340 | 28210 | 0 | 0 | 0.00% | 0.00% |  |
| C | 33340 | 28239 | 0 | 0 | 0.00% | 0.00% | 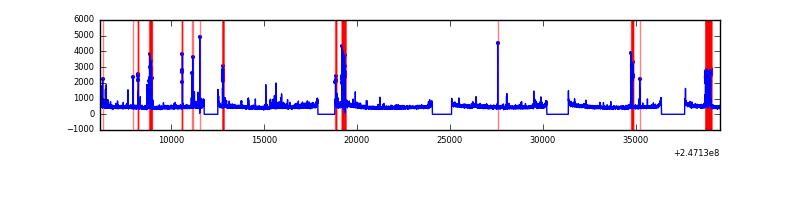 |
| D | 33340 | 28115 | 0 | 0 | 0.00% | 0.00% | 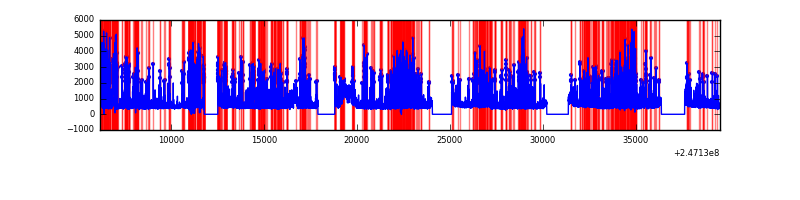 |
Top three noisy pixels from each quadrant. If the there are fewer than three noisy pixels in the level2.evt file, extra rows are filled as -1
| Pixel properties | Quadrant properties | ||||||
|---|---|---|---|---|---|---|---|
| Quadrant | DetID | PixID | Counts | Sigma | Mean | Median | Sigma |
| A | 0 | 29 | 1566 | 11.14 | 415 | 389 | 105.7 |
| A | 7 | 110 | 1284 | 8.47 | 415 | 389 | 105.7 |
| A | 9 | 19 | 1205 | 7.72 | 415 | 389 | 105.7 |
| B | 2 | 9 | 1354 | 12.01 | 397 | 378 | 81.2 |
| B | 2 | 8 | 996 | 7.61 | 397 | 378 | 81.2 |
| B | 3 | 17 | 989 | 7.52 | 397 | 378 | 81.2 |
| C | 1 | 81 | 1200 | 7.24 | 422 | 393 | 111.4 |
| C | 1 | 80 | 1178 | 7.05 | 422 | 393 | 111.4 |
| C | 3 | 126 | 1087 | 6.23 | 422 | 393 | 111.4 |
| D | 3 | 14 | 1003 | 6.43 | 378 | 344 | 102.4 |
| D | 6 | 231 | 959 | 6.0 | 378 | 344 | 102.4 |
| D | 10 | 189 | 954 | 5.96 | 378 | 344 | 102.4 |
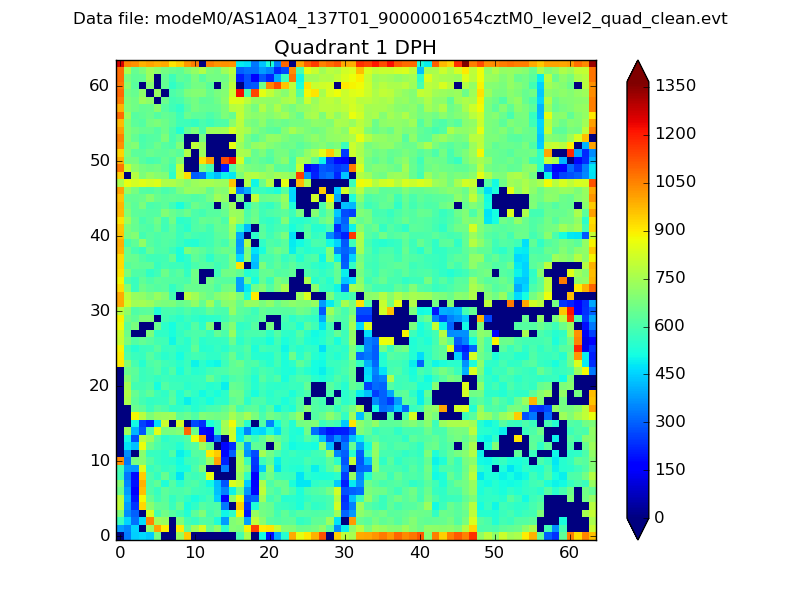
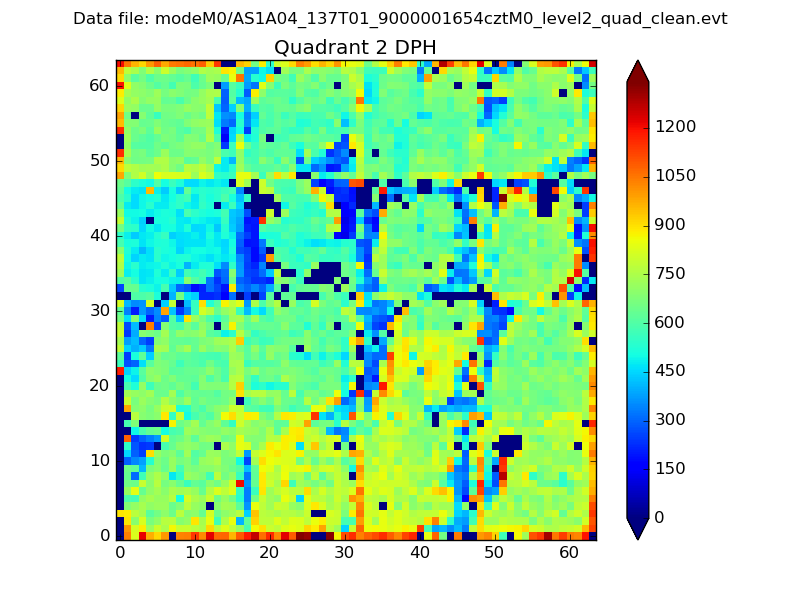
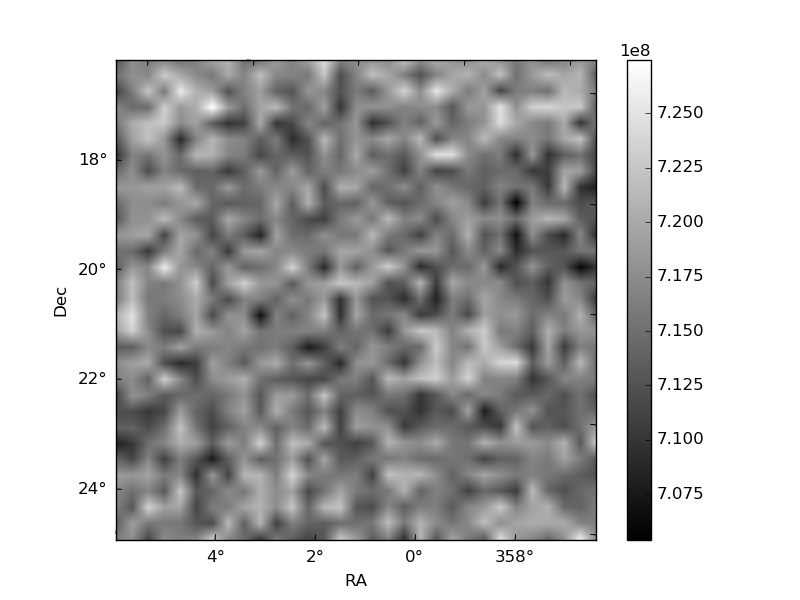
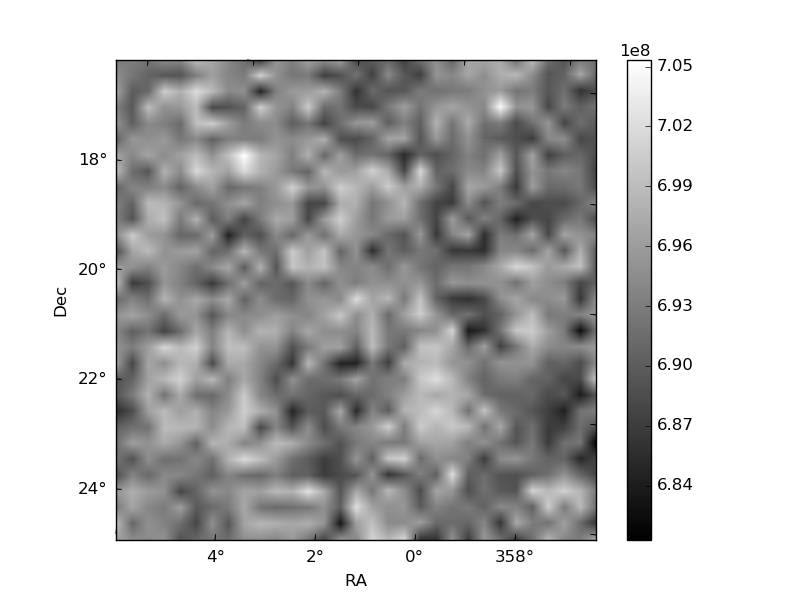
Histogram calculated using DETX and DETY for each event in the final _common_clean file
| Quadrant A | 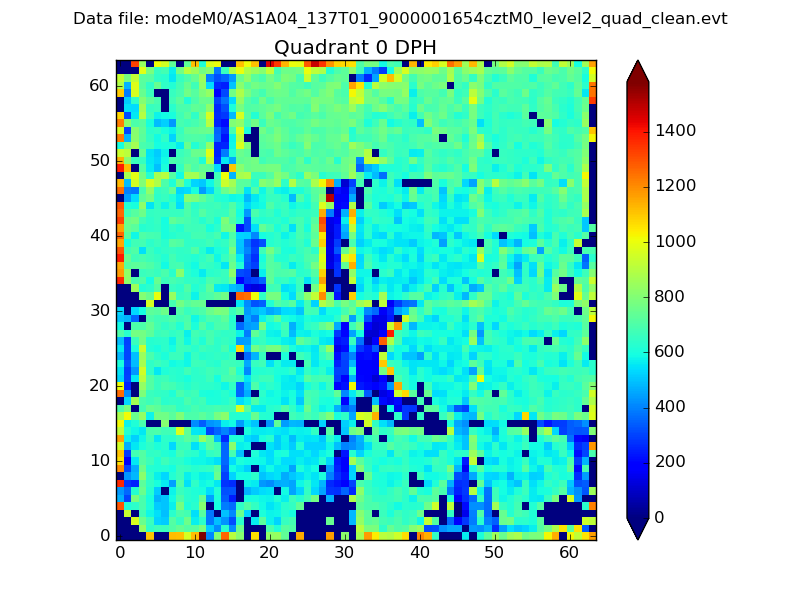 |
 |
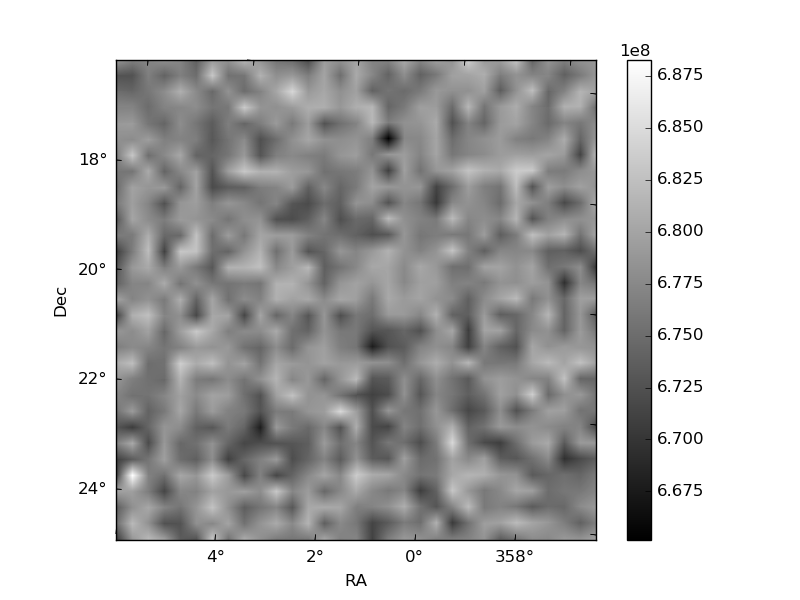
Quadrant B |
|---|---|---|---|
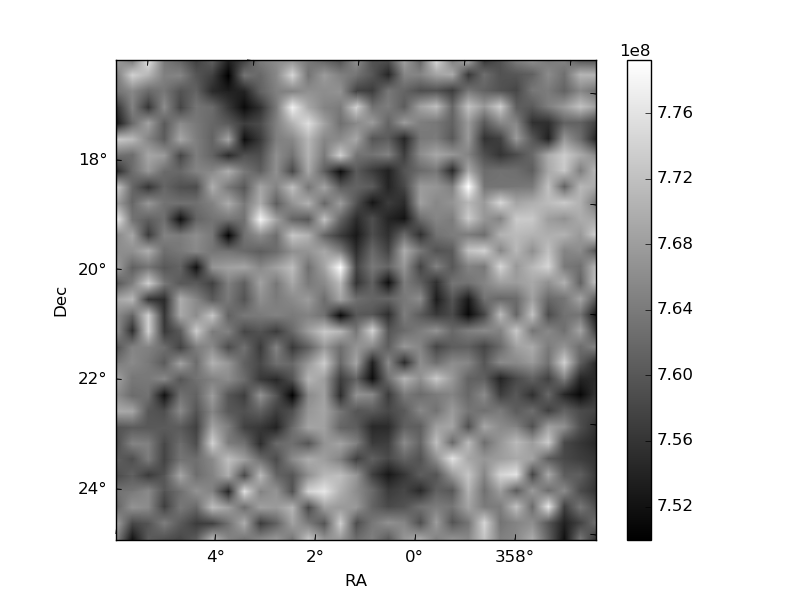
| Quadrant D | 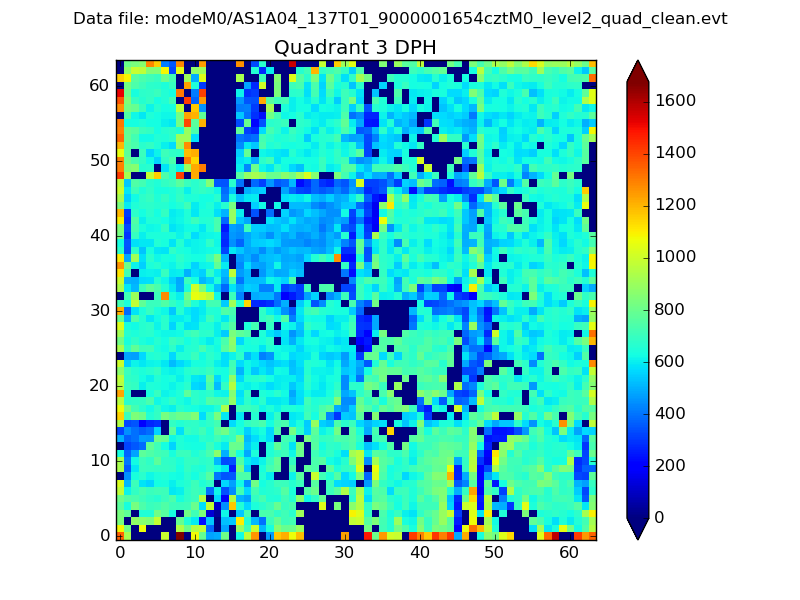 |
 |
Quadrant C |
| Plot type | Count rate plots | Images |
|---|---|---|
| Comparison with Poisson distribution Blue bars denote a histogram of data divided into 1 sec bins. Red curve is a Poisson curve with rate = median count rate of data. |
 |
 |
| Quadrant-wise count rates Data is divided into 100 sec bins |
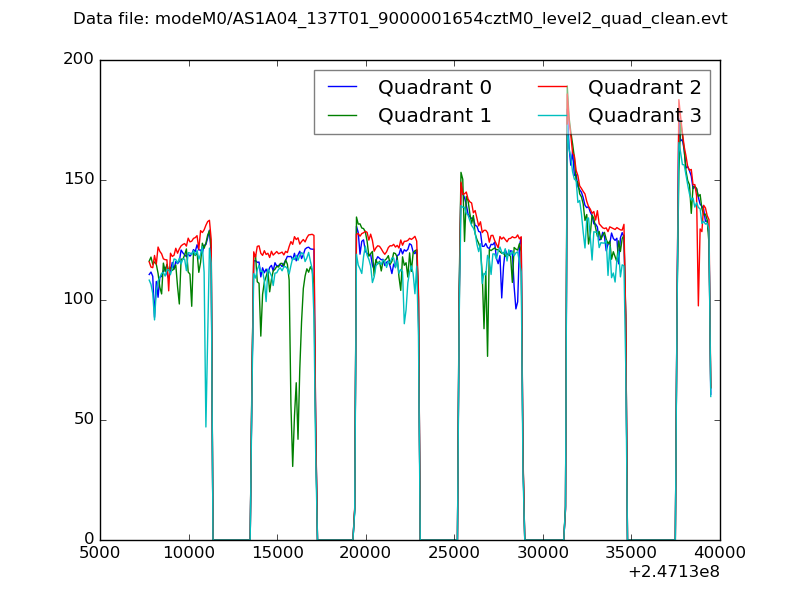 |
|
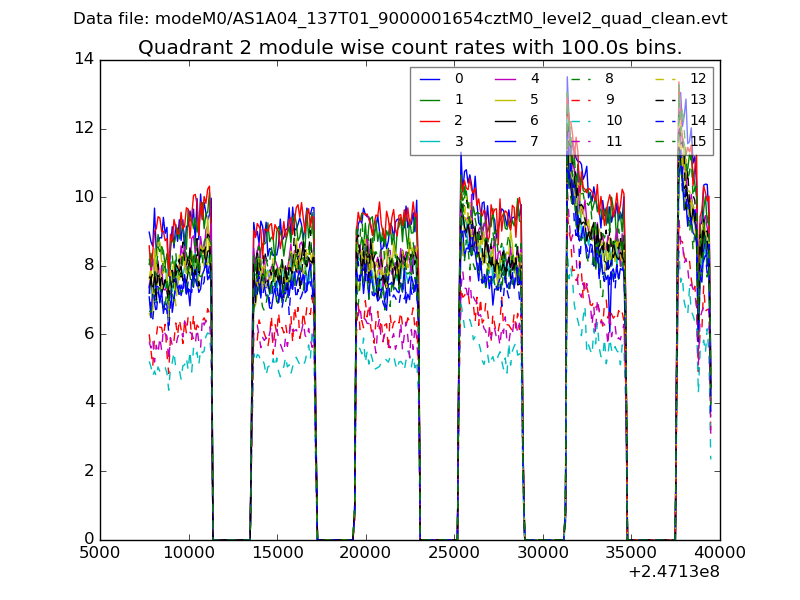
| Module-wise count rates for Quadrant A Data is divided into 100 sec bins |
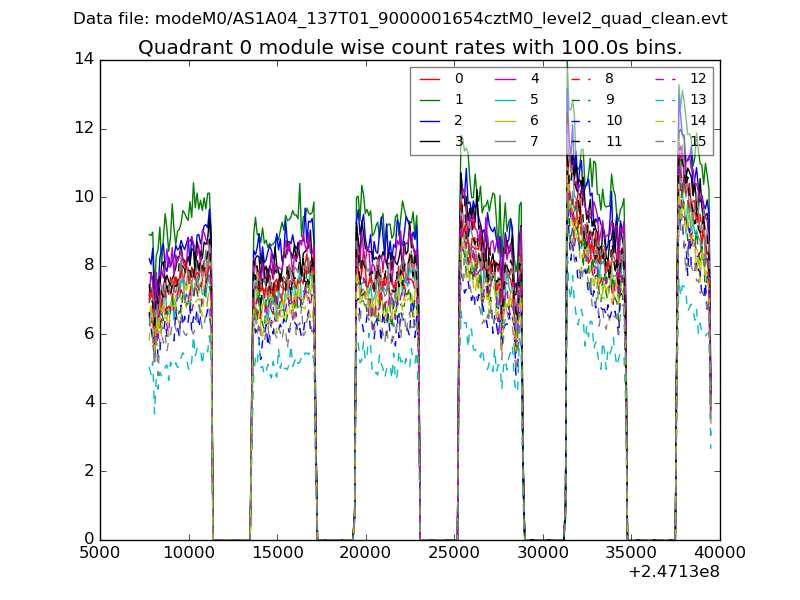 |
 |
| Module-wise count rates for Quadrant B Data is divided into 100 sec bins |
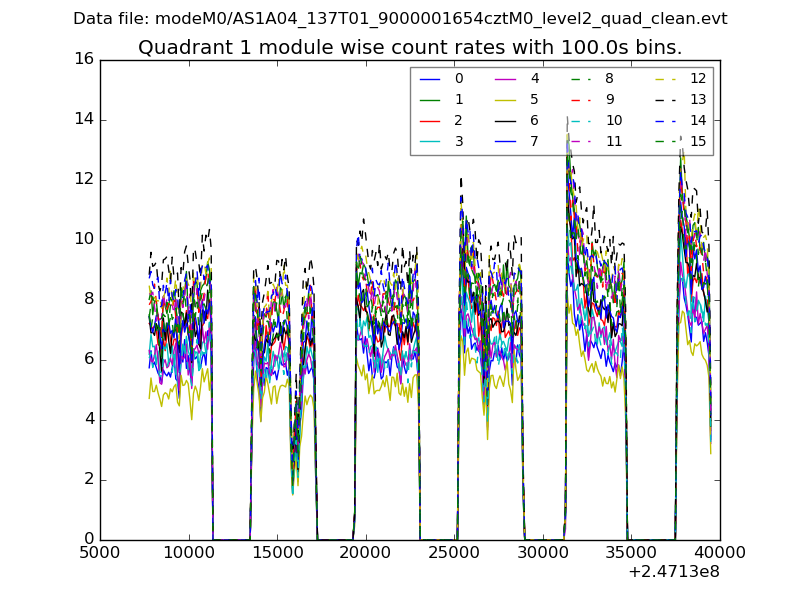 |
 |
| Module-wise count rates for Quadrant C Data is divided into 100 sec bins |
 |
 |
| Module-wise count rates for Quadrant D Data is divided into 100 sec bins |
 |
 |
| Parameter | Plot |
|---|---|
| CZT HV Monitor | 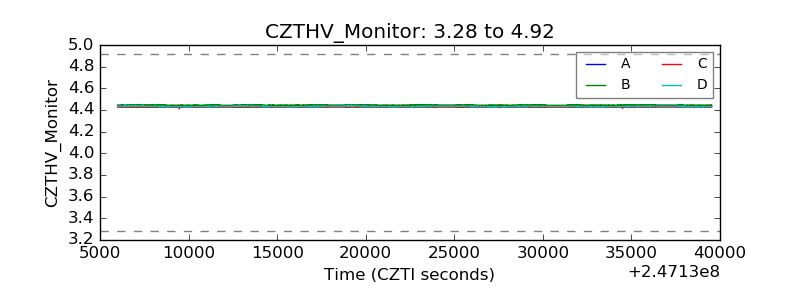 |
| D_VDD | 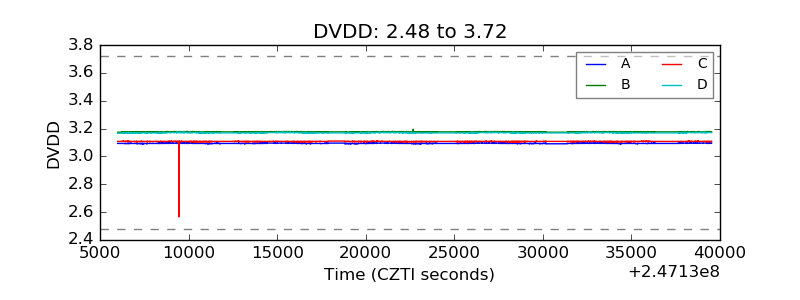 |
| Temperature 1 |  |
| Veto HV Monitor | 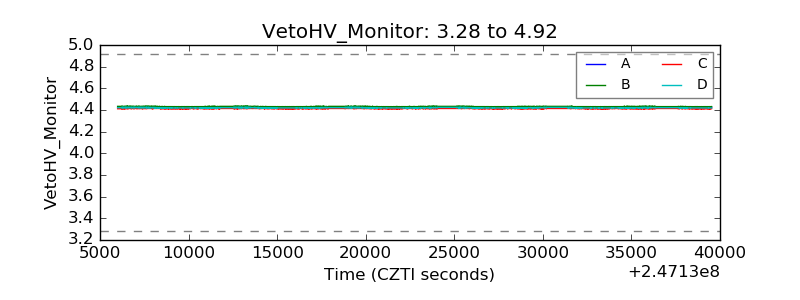 |
| Veto LLD | 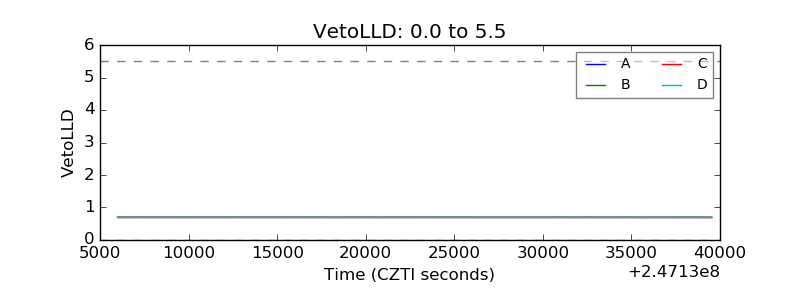 |
| Alpha Counter |  |
| _CPM_Rate | 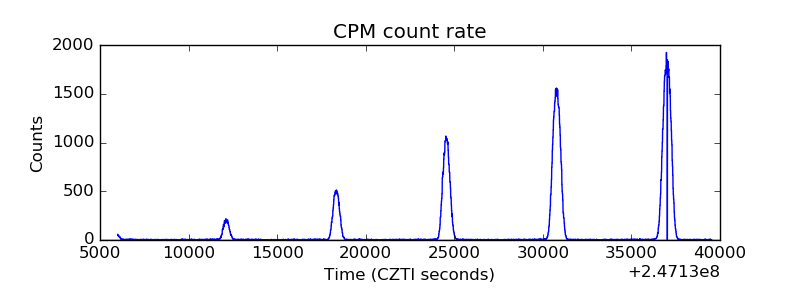 |
| CZT Counter | 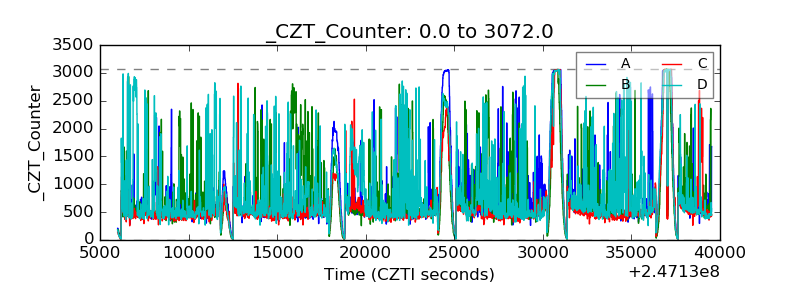 |
| +2.5 Volts monitor | 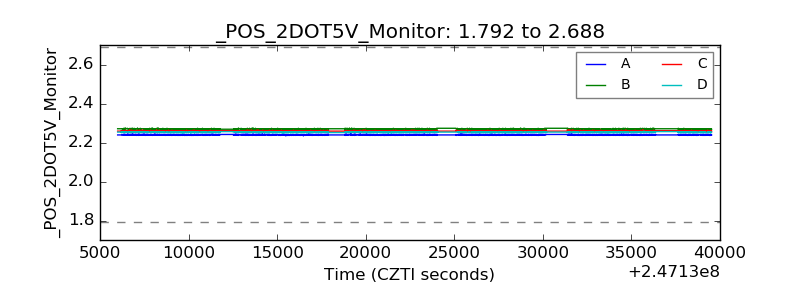 |
| +5 Volts monitor | 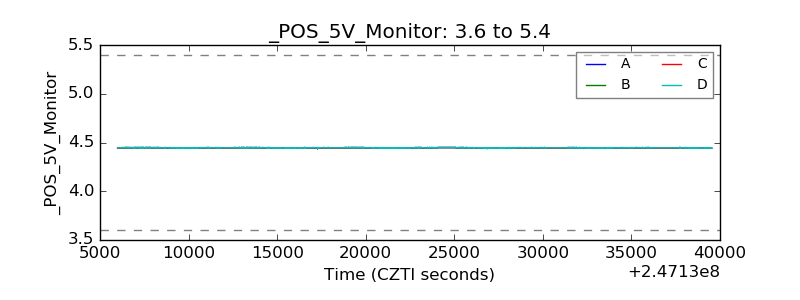 |
| _ROLL_ROT | 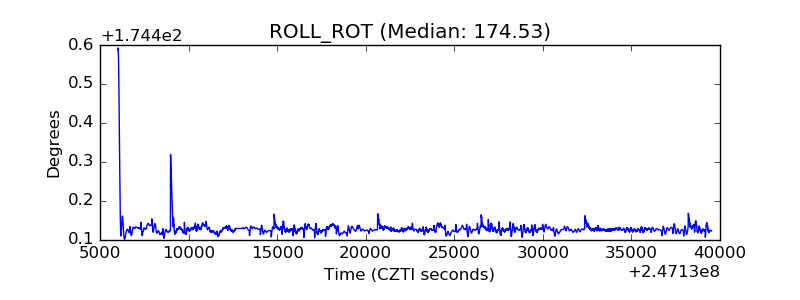 |
| _Roll_DEC | 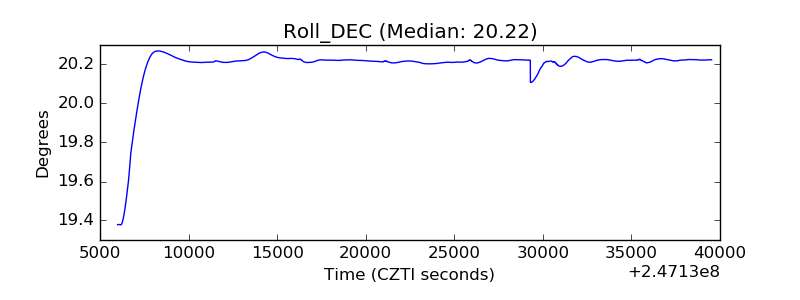 |
| _Roll_RA | 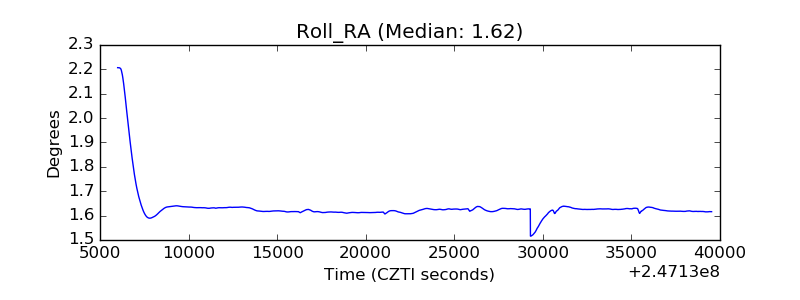 |
| Veto Counter |  |