| Param | Original file | Final file |
|---|---|---|
| Filename | modeM0/AS1A04_137T01_9000001654_11313cztM0_level2.evt | modeM0/AS1A04_137T01_9000001654_11313cztM0_level2_quad_clean.evt |
| Size (bytes) | 598,282,560 | 82,080,000 |
| Size | 570.6 MB | 78.3 MB |
| Events in quadrant A | 3,622,269 | 522,095 |
| Events in quadrant B | 5,589,121 | 469,558 |
| Events in quadrant C | 3,321,587 | 546,674 |
| Events in quadrant D | 5,155,818 | 503,714 |
| Mode M9 | |||
|---|---|---|---|
| Quadrant | BADHDUFLAG | Total packets | Discarded packets |
| A | 0 | 9 | 0 |
| B | 0 | 9 | 0 |
| C | 0 | 9 | 0 |
| D | 0 | 9 | 0 |
| Mode M0 | |||
|---|---|---|---|
| Quadrant | BADHDUFLAG | Total packets | Discarded packets |
| A | 0 | 14815 | 2 |
| B | 0 | 20582 | 1 |
| C | 0 | 14080 | 1 |
| D | 0 | 19539 | 1 |
| Mode SS | |||
|---|---|---|---|
| Quadrant | BADHDUFLAG | Total packets | Discarded packets |
| A | 0 | 130 | 0 |
| B | 0 | 130 | 0 |
| C | 0 | 130 | 0 |
| D | 0 | 130 | 0 |
| Quadrant | Total seconds | Saturated seconds | Saturation percentage |
|---|---|---|---|
| A | 6344 | 158 | 2.490542% |
| B | 6344 | 1019 | 16.062421% |
| C | 6344 | 78 | 1.229508% |
| D | 6344 | 580 | 9.142497% |
Noise dominated data is calculated using 1-second bins in cleaned event files. If a bin has >2000 counts, and if more than 50% of those come from <1% of pixels, then it is considered to be noise-dominated and hence unusable.
| Quadrant | # 1 sec bins | Bins with >0 counts | Bins with >2000 counts | High rate bins dominated by noise | Noise dominated (total time) | Noise dominated (detector-on time) | Marked lightcurve |
|---|---|---|---|---|---|---|---|
| A | 7254 | 6345 | 64 | 64 | 0.88% | 1.01% | 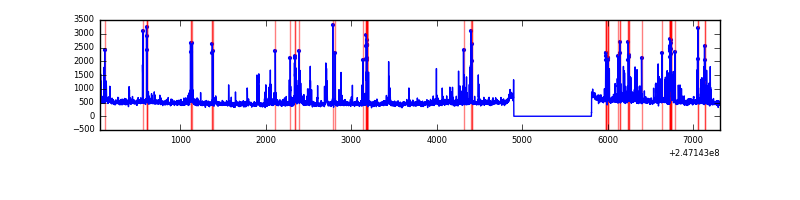 |
| B | 7254 | 6344 | 582 | 582 | 8.02% | 9.17% | 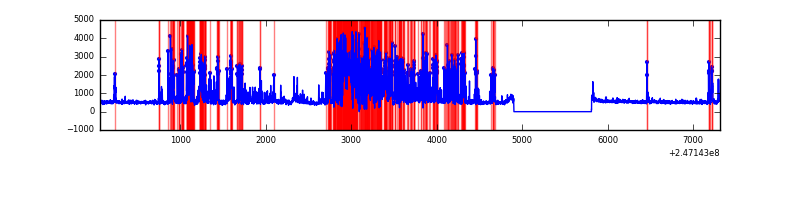 |
| C | 7254 | 6345 | 32 | 32 | 0.44% | 0.50% | 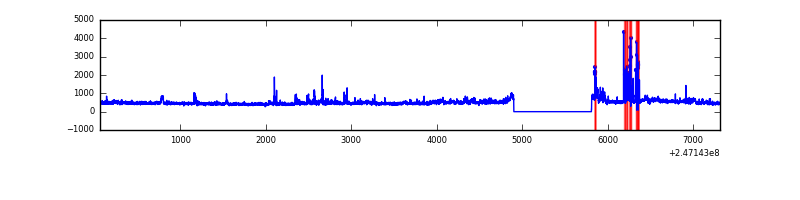 |
| D | 7254 | 6345 | 259 | 259 | 3.57% | 4.08% | 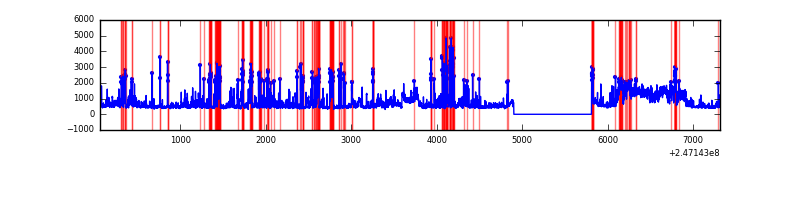 |
Top three noisy pixels from each quadrant. If the there are fewer than three noisy pixels in the level2.evt file, extra rows are filled as -1
| Pixel properties | Quadrant properties | ||||||
|---|---|---|---|---|---|---|---|
| Quadrant | DetID | PixID | Counts | Sigma | Mean | Median | Sigma |
| A | 8 | 5 | 542380 | 3476.99 | 754 | 737 | 155.8 |
| A | 14 | 238 | 57216 | 362.56 | 754 | 737 | 155.8 |
| A | 1 | 162 | 36955 | 232.5 | 754 | 737 | 155.8 |
| B | 3 | 64 | 1997171 | 14501.4 | 705 | 686 | 137.7 |
| B | 4 | 239 | 660576 | 4793.09 | 705 | 686 | 137.7 |
| B | 15 | 204 | 64692 | 464.91 | 705 | 686 | 137.7 |
| C | 9 | 204 | 443538 | 2594.5 | 737 | 742 | 170.7 |
| C | 13 | 61 | 5444 | 27.55 | 737 | 742 | 170.7 |
| C | 5 | 128 | 3687 | 17.26 | 737 | 742 | 170.7 |
| D | 1 | 52 | 1713816 | 9775.94 | 721 | 699 | 175.2 |
| D | 10 | 253 | 252031 | 1434.23 | 721 | 699 | 175.2 |
| D | 2 | 120 | 145896 | 828.57 | 721 | 699 | 175.2 |
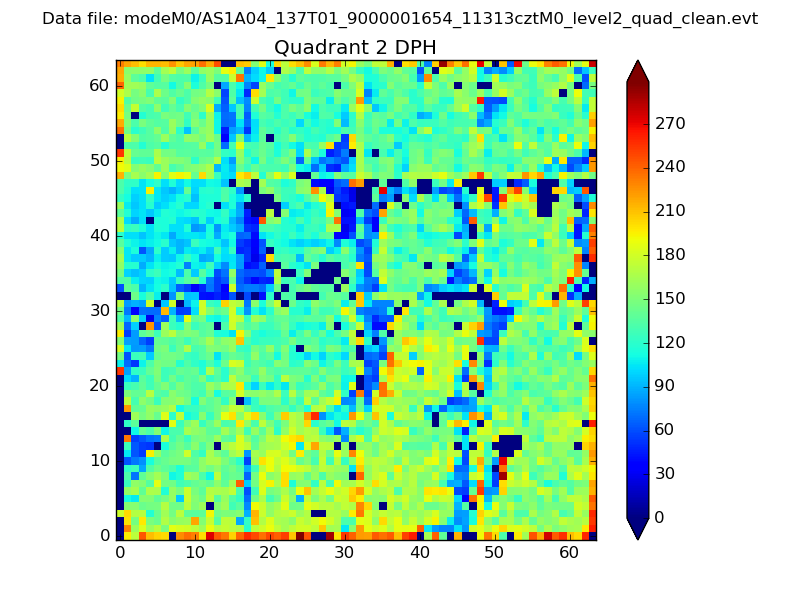
Histogram calculated using DETX and DETY for each event in the final _common_clean file
| Quadrant A | 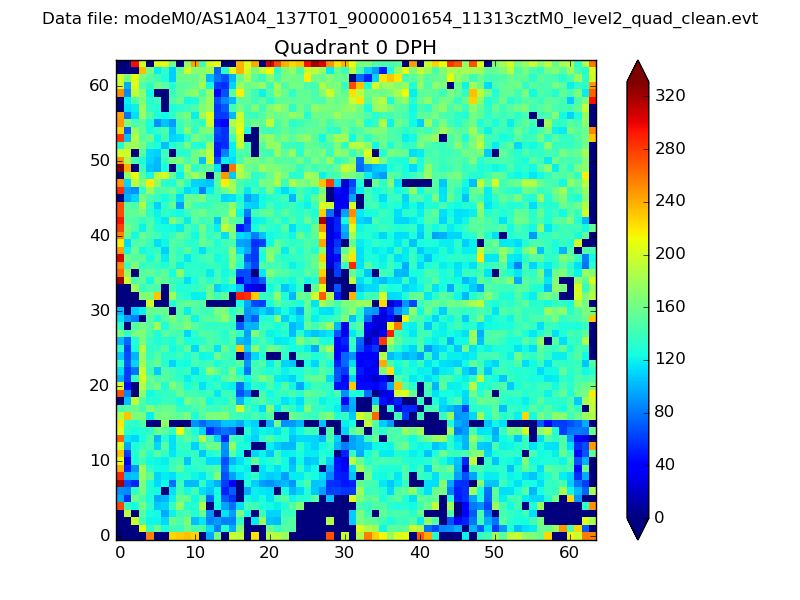 |
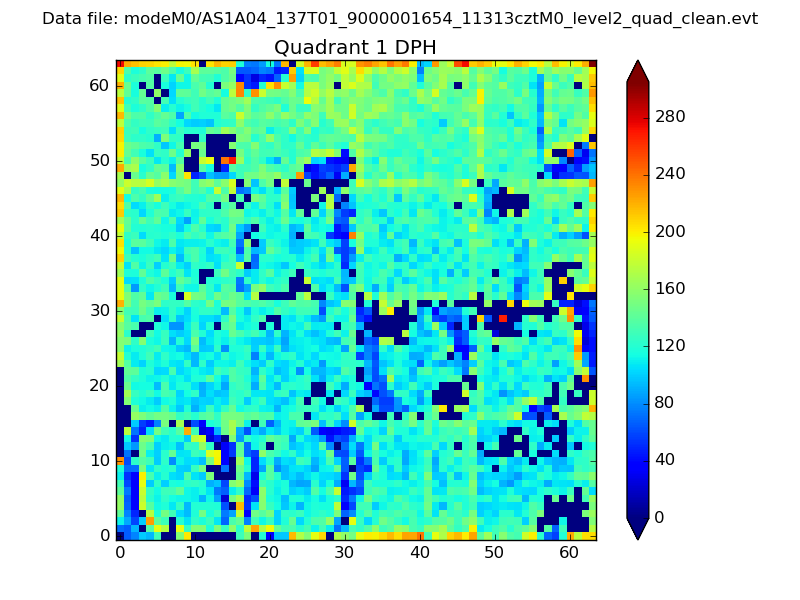 |
Quadrant B |
|---|---|---|---|
| Quadrant D | 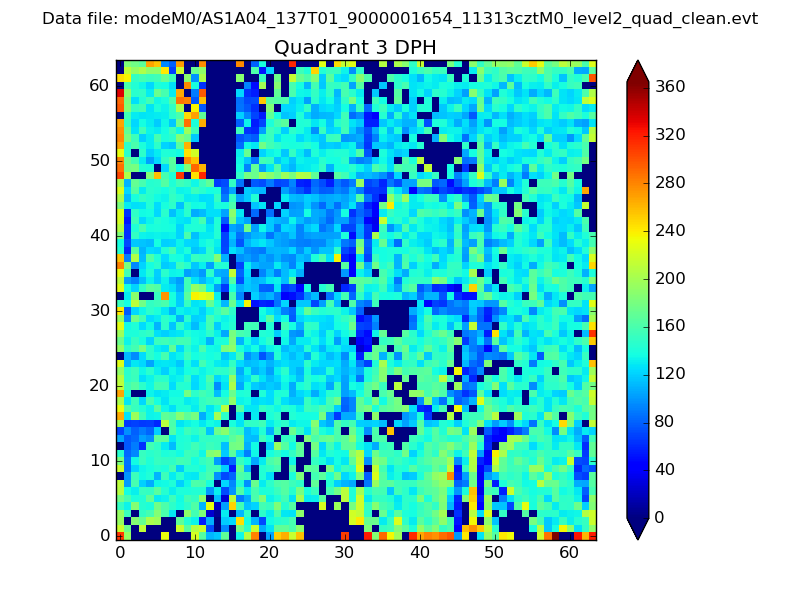 |
 |
Quadrant C |
| Plot type | Count rate plots | Images |
|---|---|---|
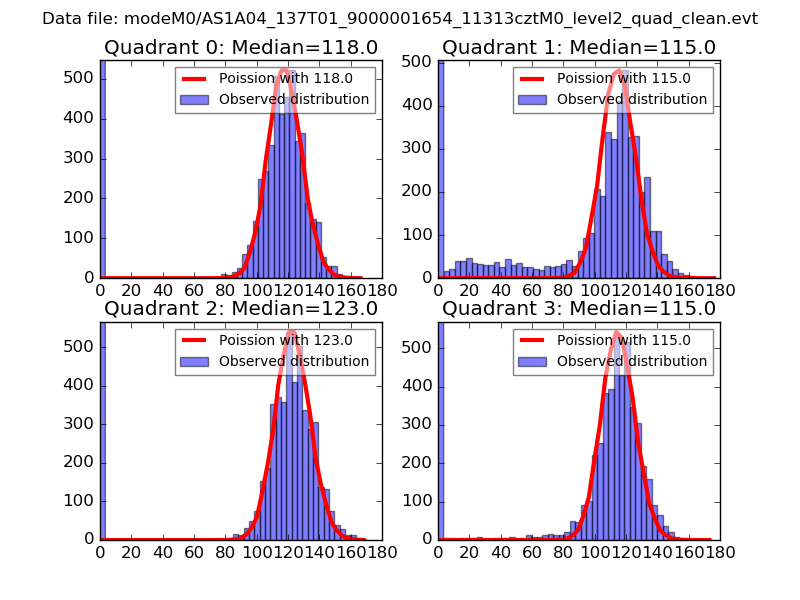
| Comparison with Poisson distribution Blue bars denote a histogram of data divided into 1 sec bins. Red curve is a Poisson curve with rate = median count rate of data. |
 |
 |
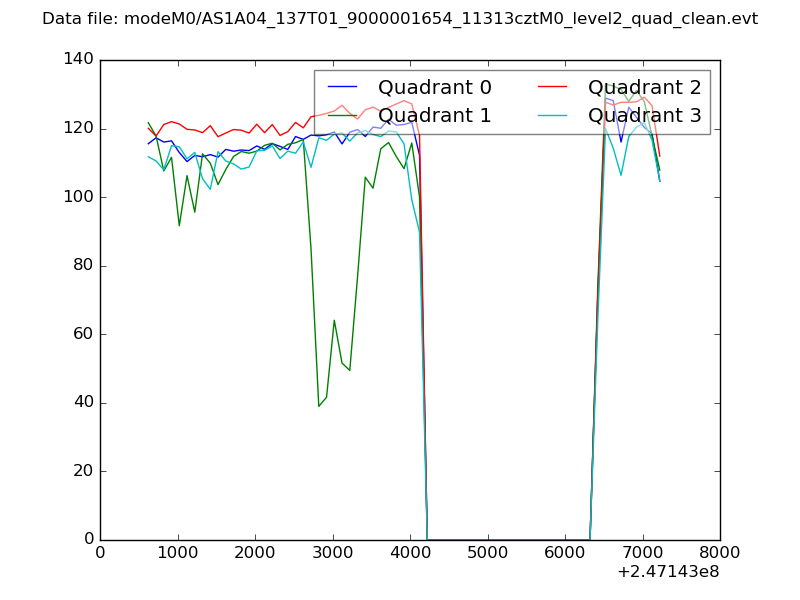
| Quadrant-wise count rates Data is divided into 100 sec bins |
 |
|
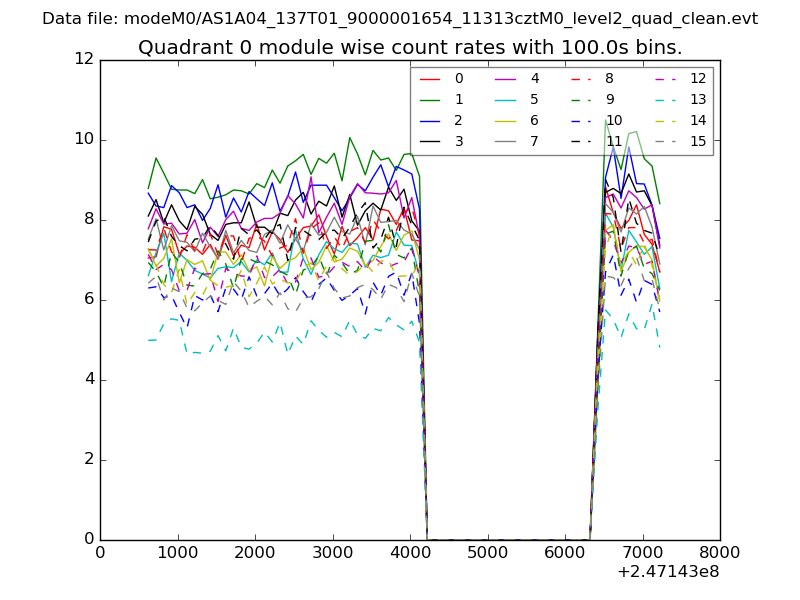
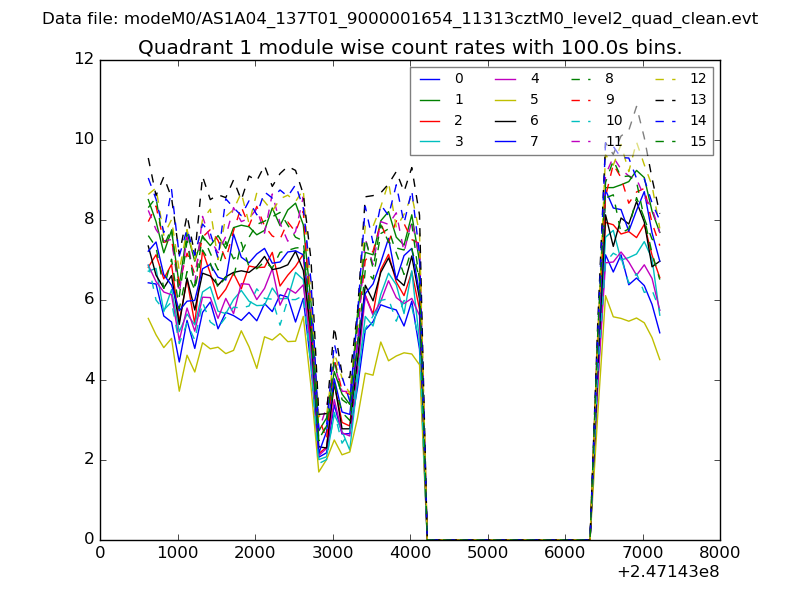
| Module-wise count rates for Quadrant A Data is divided into 100 sec bins |
 |
 |
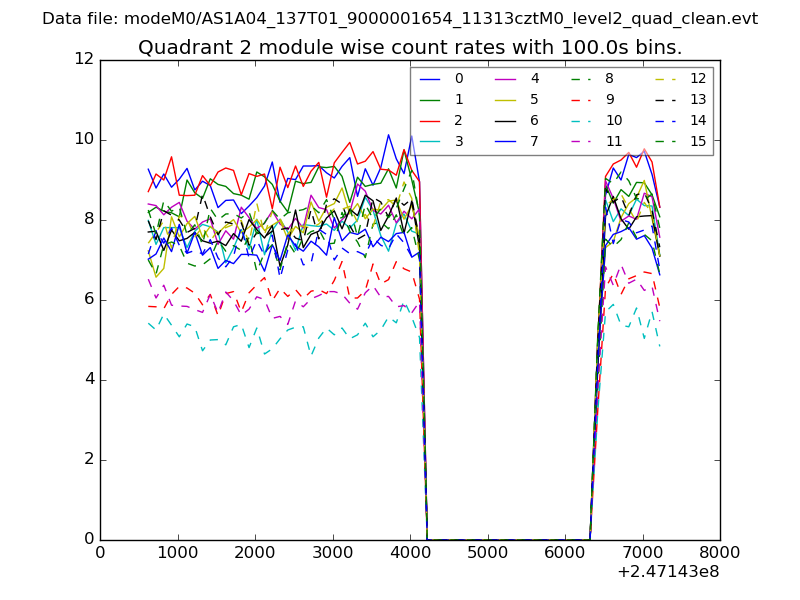
| Module-wise count rates for Quadrant B Data is divided into 100 sec bins |
 |
 |
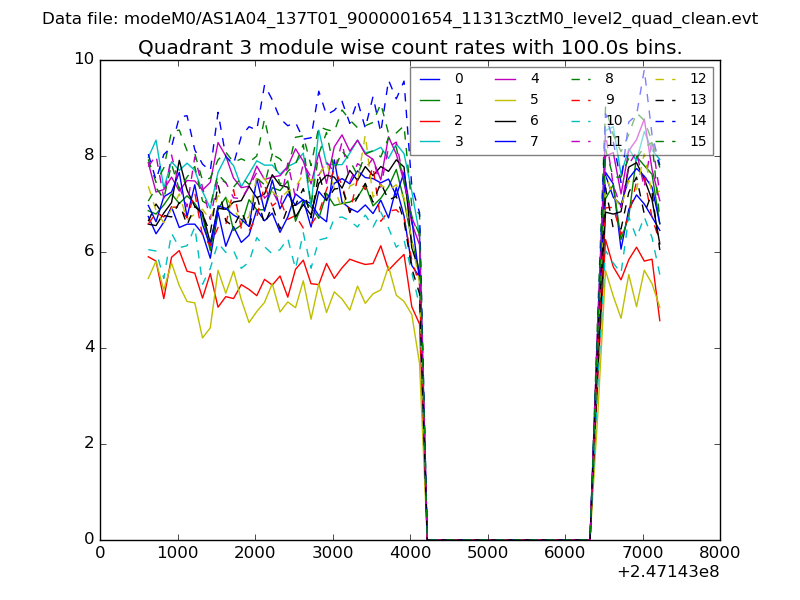
| Module-wise count rates for Quadrant C Data is divided into 100 sec bins |
 |
 |
| Module-wise count rates for Quadrant D Data is divided into 100 sec bins |
 |
 |
| Parameter | Plot |
|---|---|
| CZT HV Monitor | 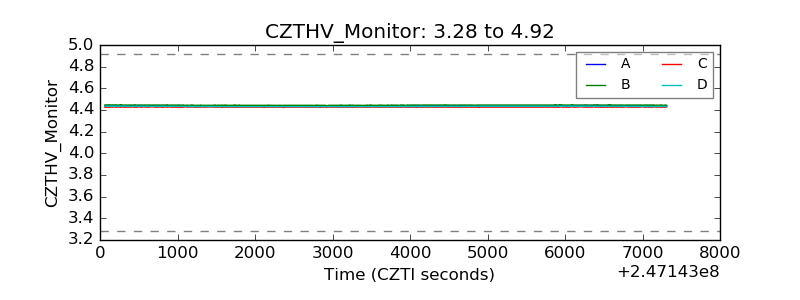 |
| D_VDD | 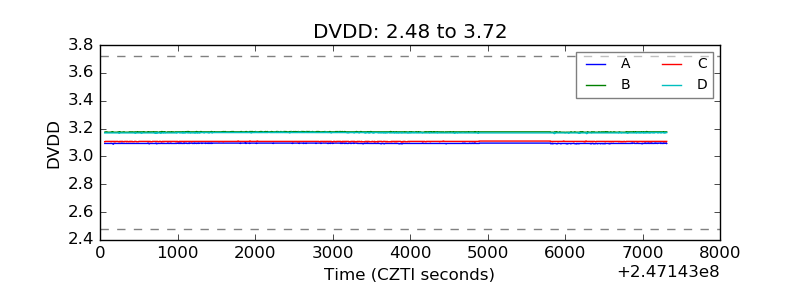 |
| Temperature 1 | 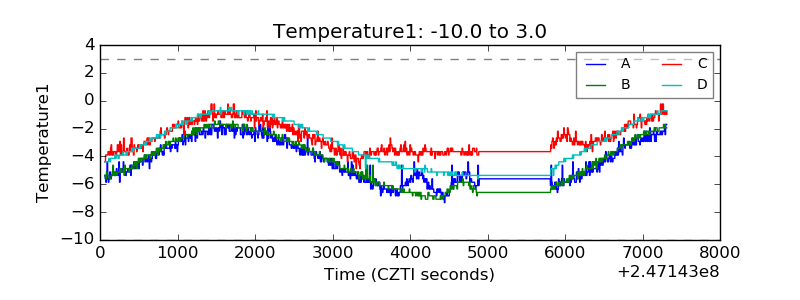 |
| Veto HV Monitor | 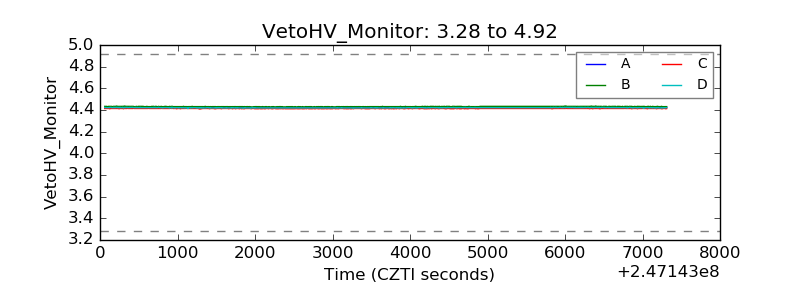 |
| Veto LLD | 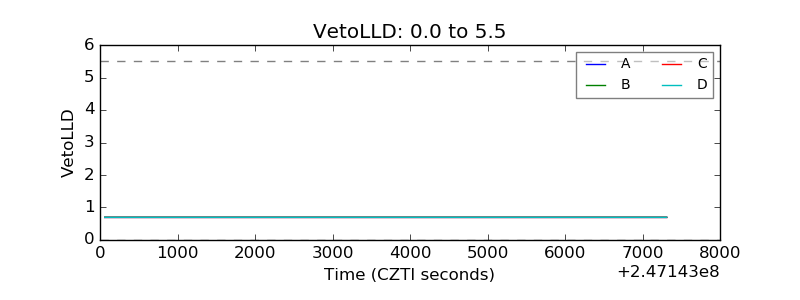 |
| Alpha Counter | 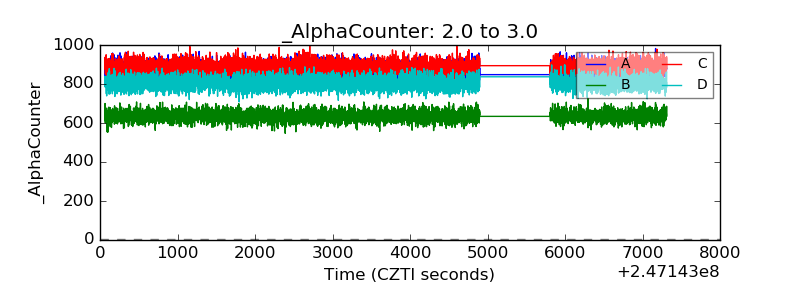 |
| _CPM_Rate | 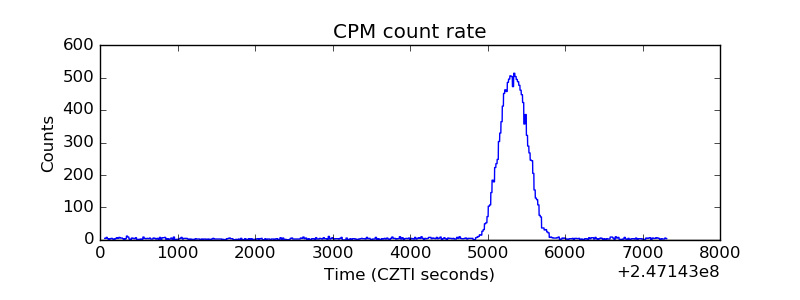 |
| CZT Counter | 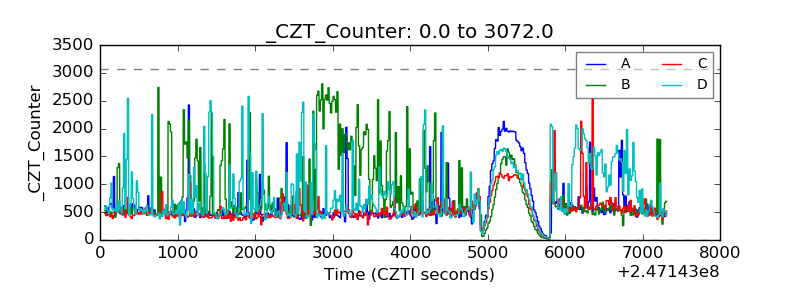 |
| +2.5 Volts monitor |  |
| +5 Volts monitor |  |
| _ROLL_ROT | 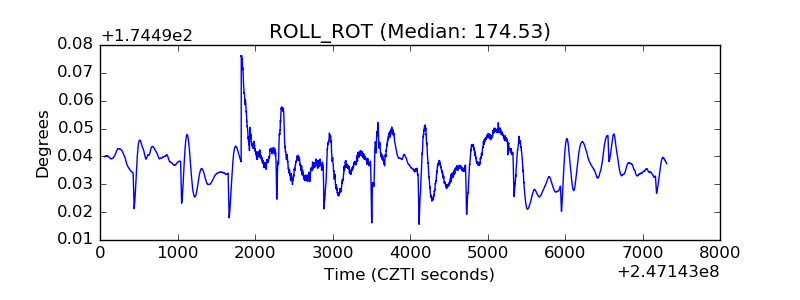 |
| _Roll_DEC | 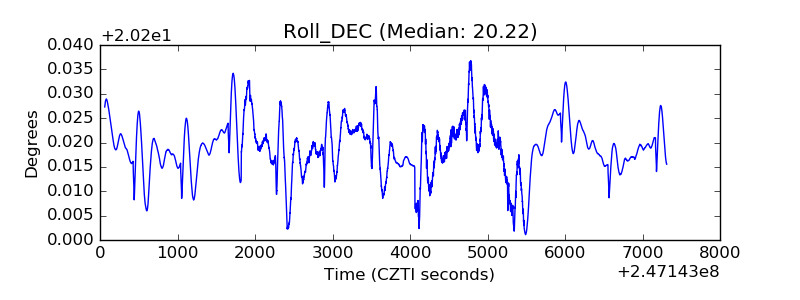 |
| _Roll_RA | 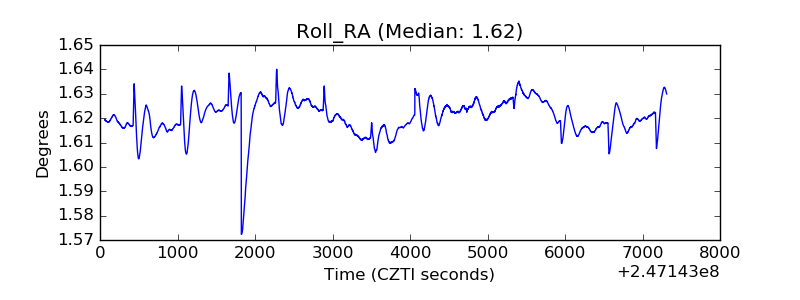 |
| Veto Counter | 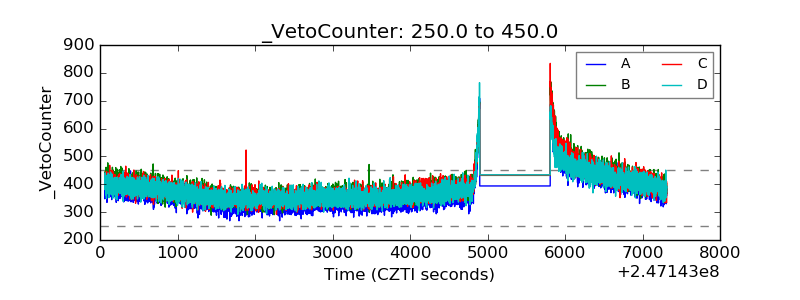 |