| Param | Original file | Final file |
|---|---|---|
| Filename | modeM0/AS1A04_137T01_9000001654_11317cztM0_level2.evt | modeM0/AS1A04_137T01_9000001654_11317cztM0_level2_quad_clean.evt |
| Size (bytes) | 625,786,560 | 105,972,480 |
| Size | 596.8 MB | 101.1 MB |
| Events in quadrant A | 4,595,894 | 695,577 |
| Events in quadrant B | 4,841,373 | 688,944 |
| Events in quadrant C | 3,585,977 | 708,493 |
| Events in quadrant D | 5,487,236 | 661,002 |
| Mode M9 | |||
|---|---|---|---|
| Quadrant | BADHDUFLAG | Total packets | Discarded packets |
| A | 0 | 14 | 0 |
| B | 0 | 14 | 0 |
| C | 0 | 14 | 0 |
| D | 0 | 15 | 0 |
| Mode M0 | |||
|---|---|---|---|
| Quadrant | BADHDUFLAG | Total packets | Discarded packets |
| A | 0 | 17992 | 3 |
| B | 0 | 18769 | 2 |
| C | 0 | 14888 | 2 |
| D | 0 | 20674 | 2 |
| Mode SS | |||
|---|---|---|---|
| Quadrant | BADHDUFLAG | Total packets | Discarded packets |
| A | 0 | 132 | 0 |
| B | 0 | 132 | 0 |
| C | 0 | 132 | 0 |
| D | 0 | 132 | 0 |
| Quadrant | Total seconds | Saturated seconds | Saturation percentage |
|---|---|---|---|
| A | 6527 | 314 | 4.810786% |
| B | 6527 | 397 | 6.082427% |
| C | 6527 | 176 | 2.696491% |
| D | 6527 | 506 | 7.752413% |
Noise dominated data is calculated using 1-second bins in cleaned event files. If a bin has >2000 counts, and if more than 50% of those come from <1% of pixels, then it is considered to be noise-dominated and hence unusable.
| Quadrant | # 1 sec bins | Bins with >0 counts | Bins with >2000 counts | High rate bins dominated by noise | Noise dominated (total time) | Noise dominated (detector-on time) | Marked lightcurve |
|---|---|---|---|---|---|---|---|
| A | 7782 | 6528 | 174 | 174 | 2.24% | 2.67% | 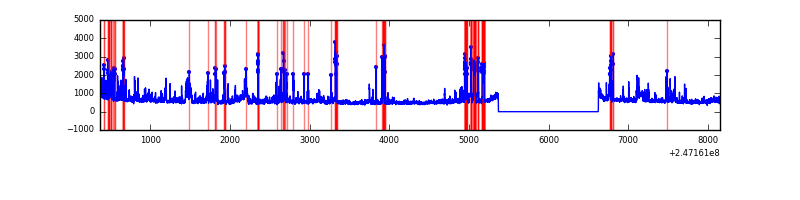 |
| B | 7782 | 6528 | 243 | 243 | 3.12% | 3.72% | 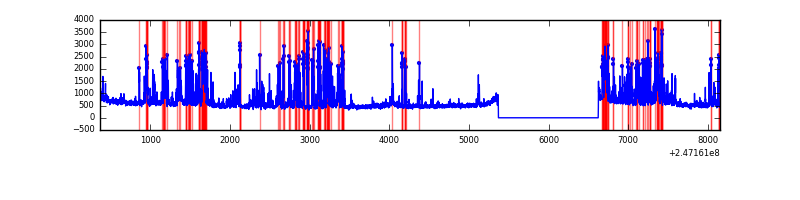 |
| C | 7782 | 6528 | 109 | 109 | 1.40% | 1.67% |  |
| D | 7782 | 6528 | 410 | 410 | 5.27% | 6.28% | 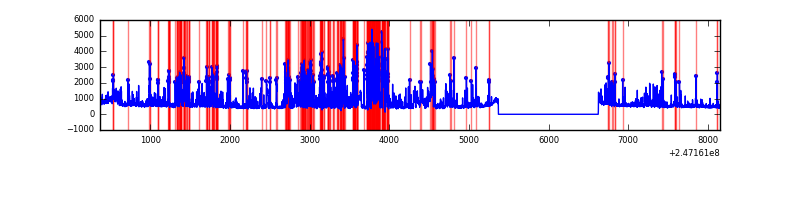 |
Top three noisy pixels from each quadrant. If the there are fewer than three noisy pixels in the level2.evt file, extra rows are filled as -1
| Pixel properties | Quadrant properties | ||||||
|---|---|---|---|---|---|---|---|
| Quadrant | DetID | PixID | Counts | Sigma | Mean | Median | Sigma |
| A | 8 | 5 | 672456 | 4001.9 | 828 | 810 | 167.8 |
| A | 0 | 8 | 331363 | 1969.55 | 828 | 810 | 167.8 |
| A | 8 | 15 | 181134 | 1074.43 | 828 | 810 | 167.8 |
| B | 4 | 239 | 1082446 | 7003.52 | 821 | 803 | 154.4 |
| B | 3 | 64 | 328034 | 2118.78 | 821 | 803 | 154.4 |
| B | 15 | 204 | 65798 | 420.84 | 821 | 803 | 154.4 |
| C | 9 | 204 | 424369 | 2268.01 | 810 | 816 | 186.8 |
| C | 13 | 61 | 5815 | 26.77 | 810 | 816 | 186.8 |
| C | 14 | 234 | 2940 | 11.37 | 810 | 816 | 186.8 |
| D | 1 | 52 | 849793 | 4492.77 | 796 | 776 | 189.0 |
| D | 7 | 80 | 612895 | 3239.17 | 796 | 776 | 189.0 |
| D | 10 | 253 | 585885 | 3096.24 | 796 | 776 | 189.0 |
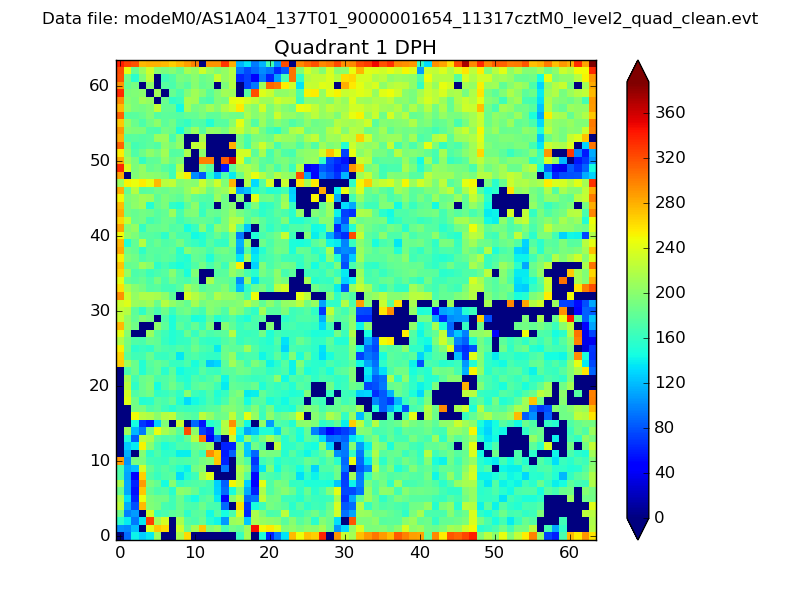
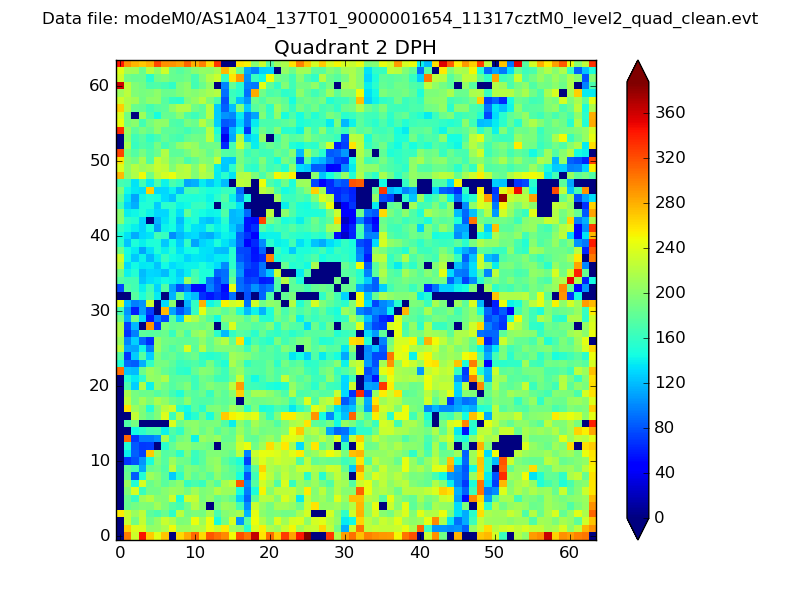
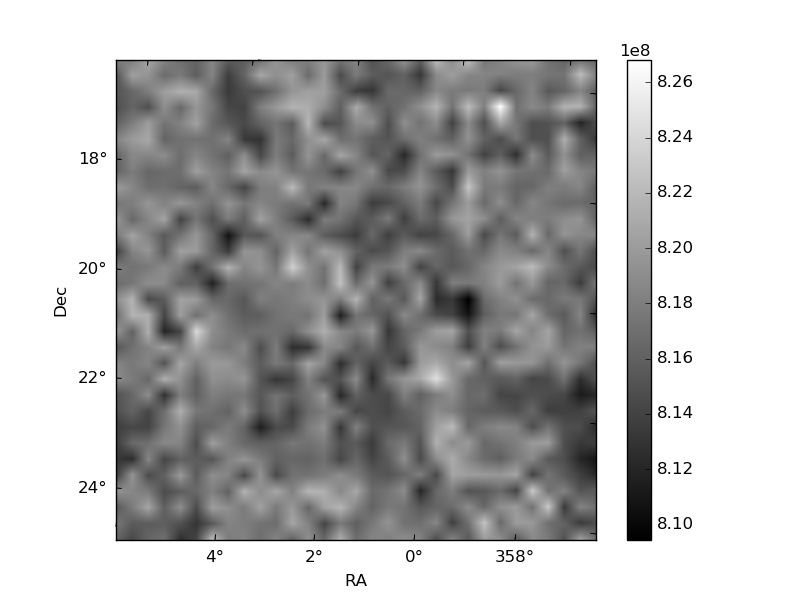
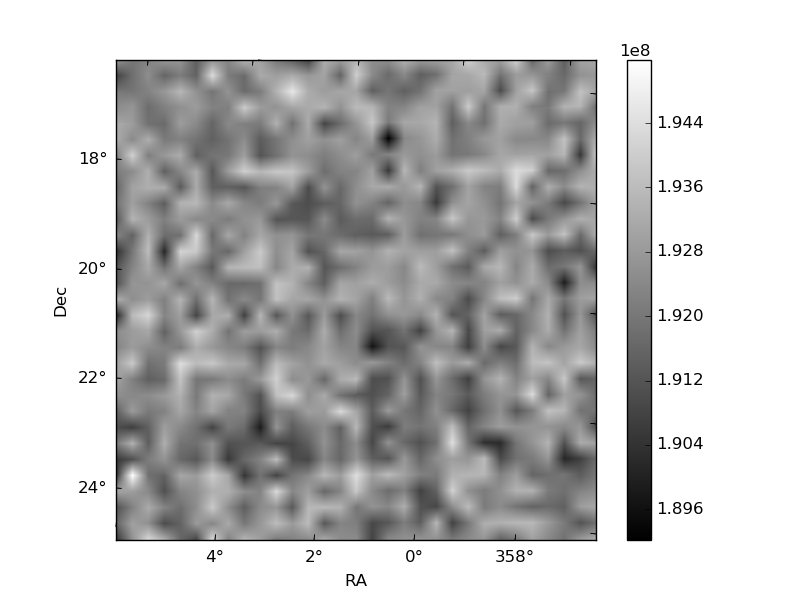
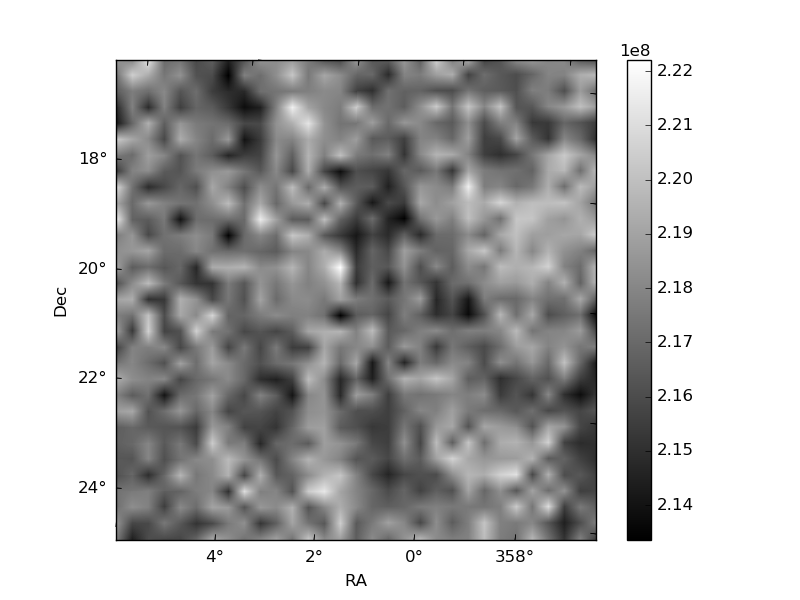
Histogram calculated using DETX and DETY for each event in the final _common_clean file
| Quadrant A | 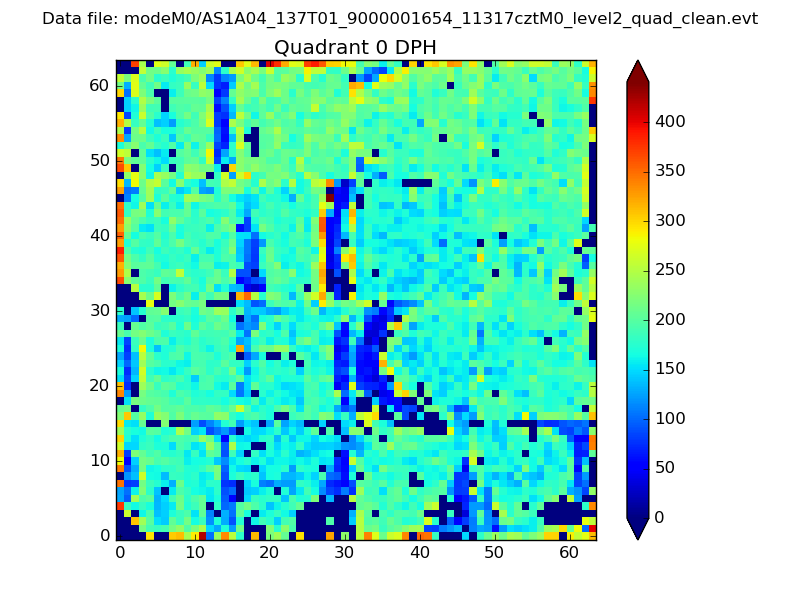 |
 |
Quadrant B |
|---|---|---|---|
| Quadrant D | 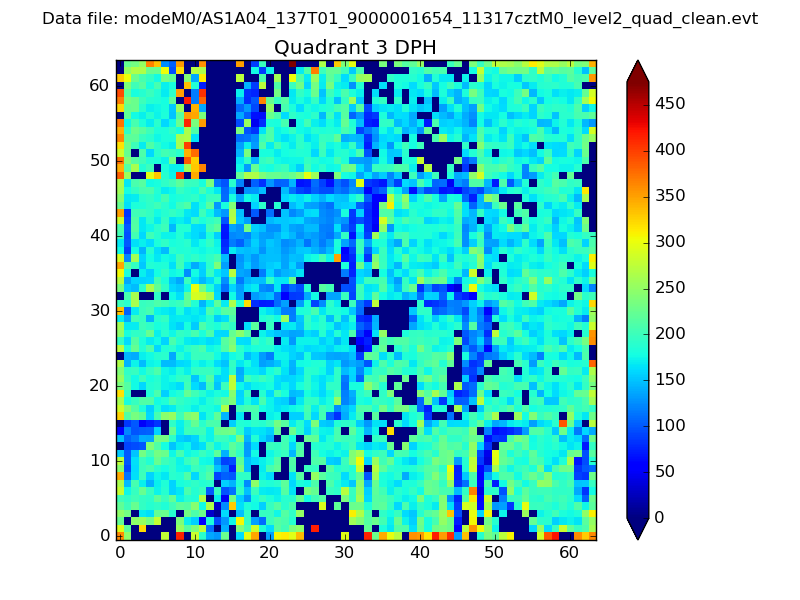 |
 |
Quadrant C |
| Plot type | Count rate plots | Images |
|---|---|---|
| Comparison with Poisson distribution Blue bars denote a histogram of data divided into 1 sec bins. Red curve is a Poisson curve with rate = median count rate of data. |
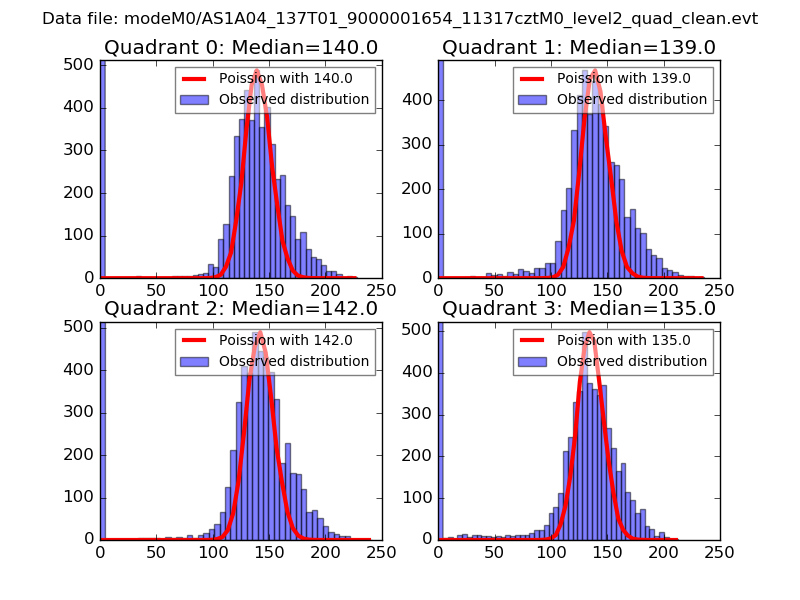 |
 |
| Quadrant-wise count rates Data is divided into 100 sec bins |
 |
|
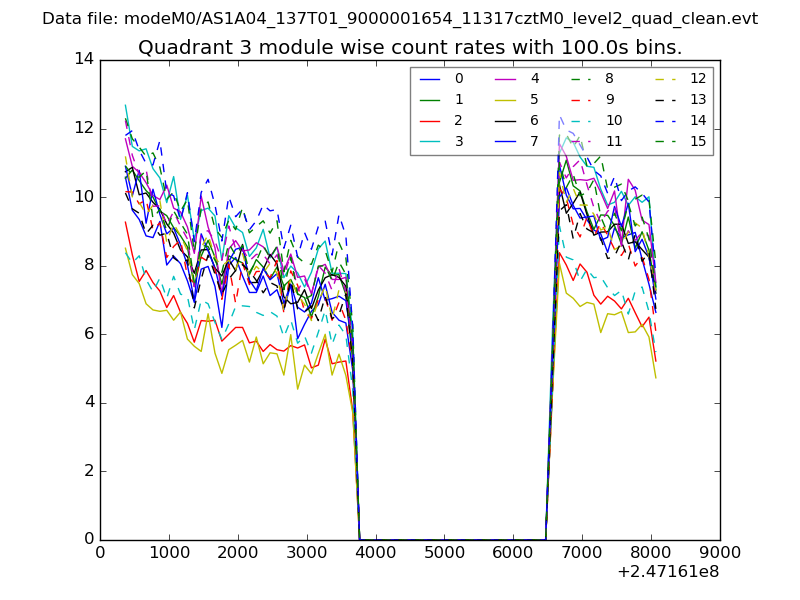
| Module-wise count rates for Quadrant A Data is divided into 100 sec bins |
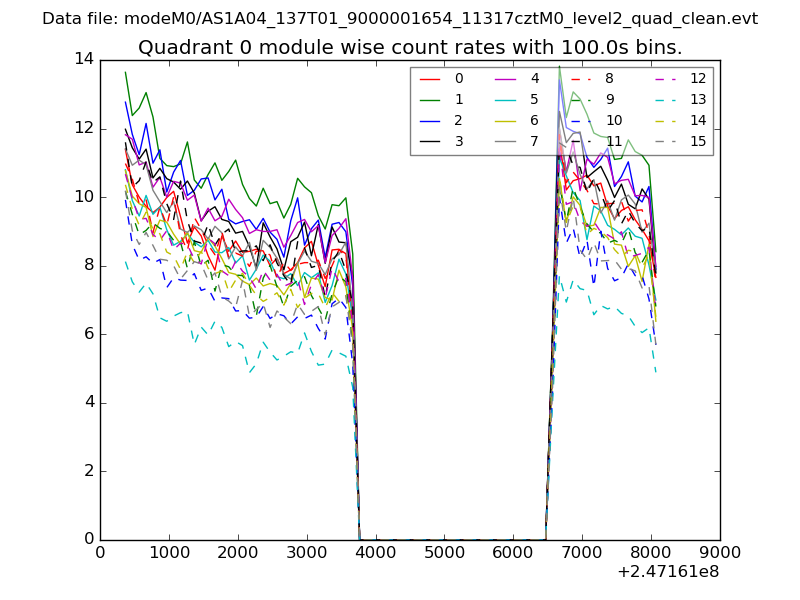 |
 |
| Module-wise count rates for Quadrant B Data is divided into 100 sec bins |
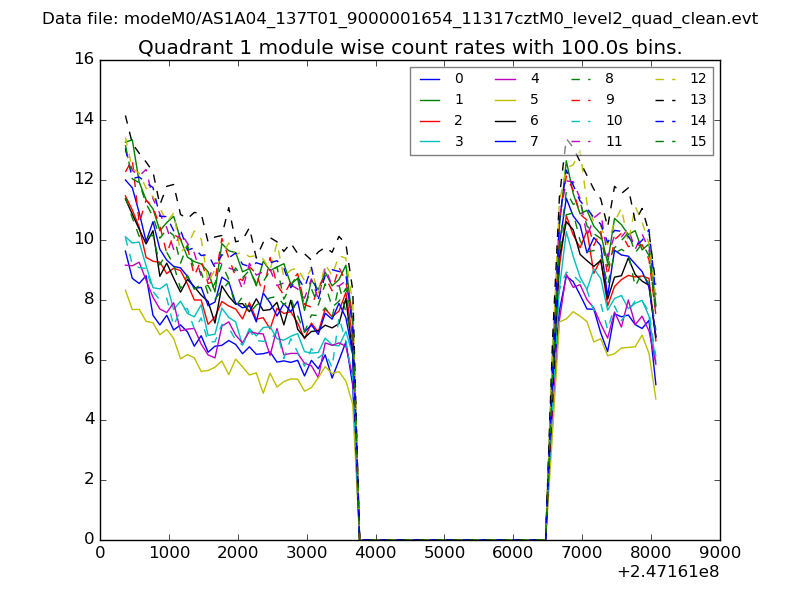 |
 |
| Module-wise count rates for Quadrant C Data is divided into 100 sec bins |
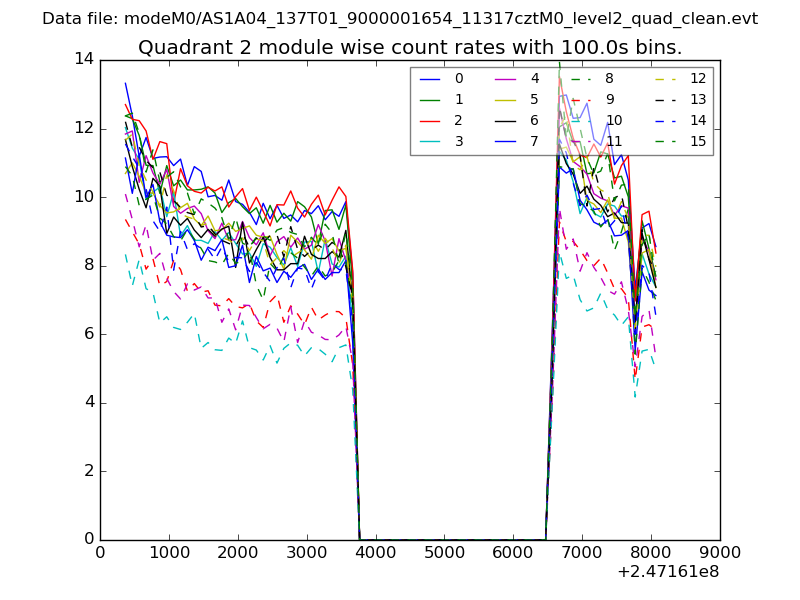 |
 |
| Module-wise count rates for Quadrant D Data is divided into 100 sec bins |
 |
 |
| Parameter | Plot |
|---|---|
| CZT HV Monitor | 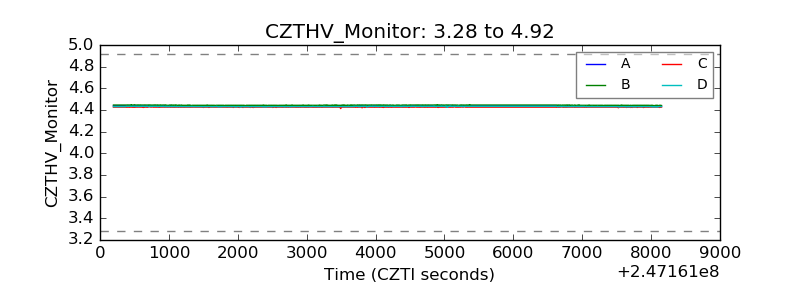 |
| D_VDD | 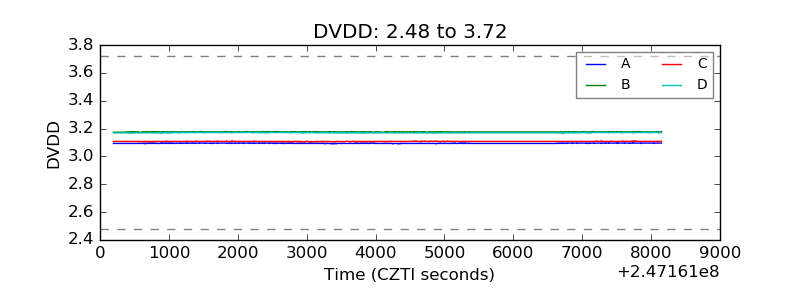 |
| Temperature 1 | 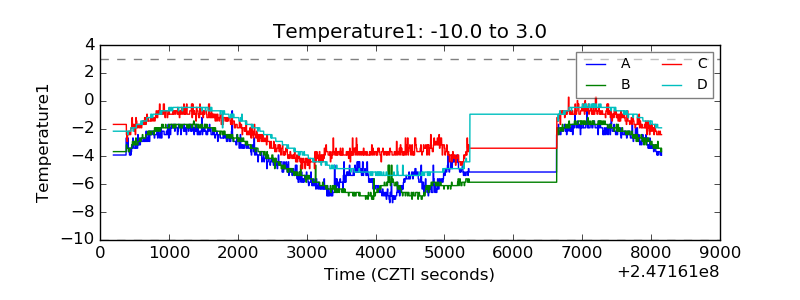 |
| Veto HV Monitor | 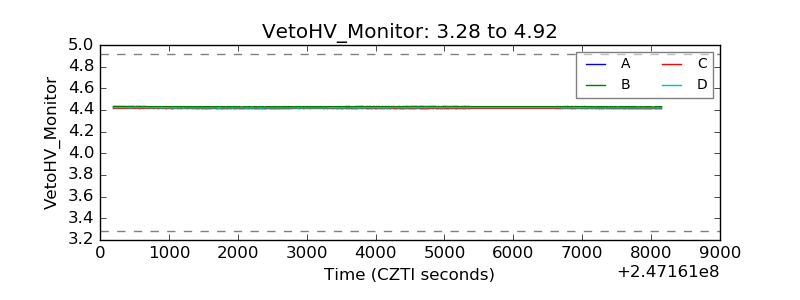 |
| Veto LLD | 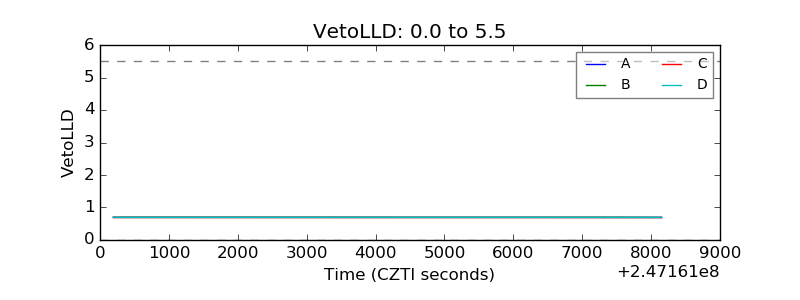 |
| Alpha Counter | 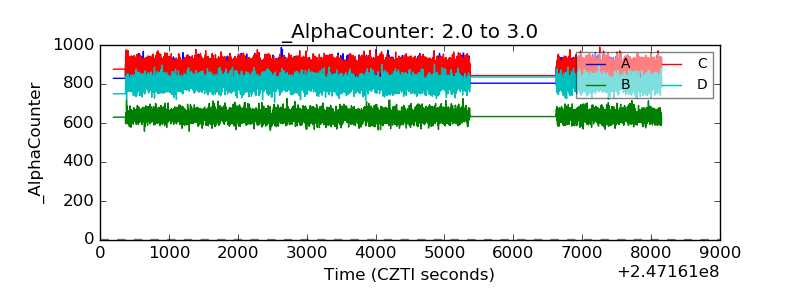 |
| _CPM_Rate | 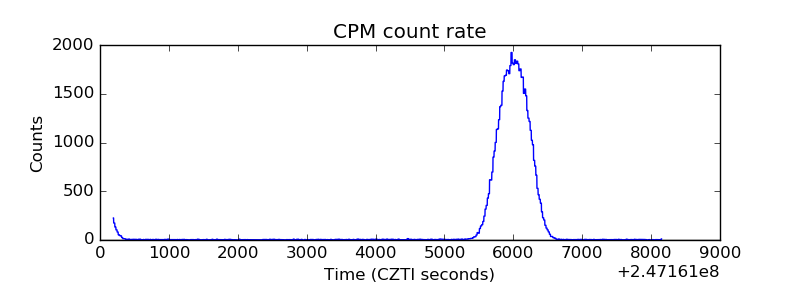 |
| CZT Counter | 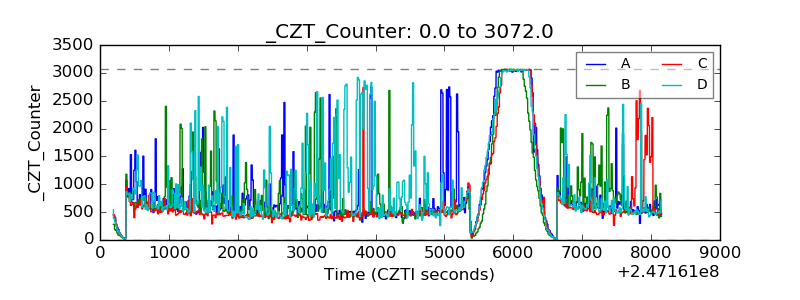 |
| +2.5 Volts monitor |  |
| +5 Volts monitor |  |
| _ROLL_ROT | 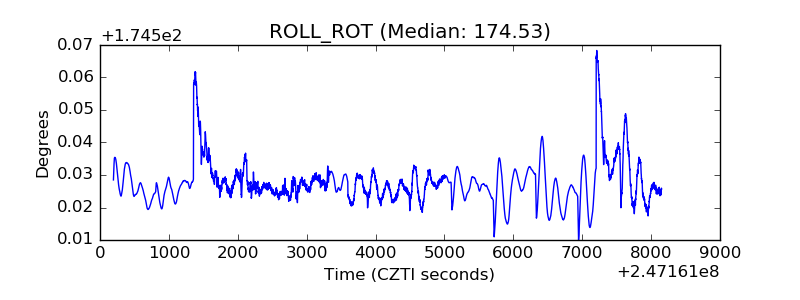 |
| _Roll_DEC | 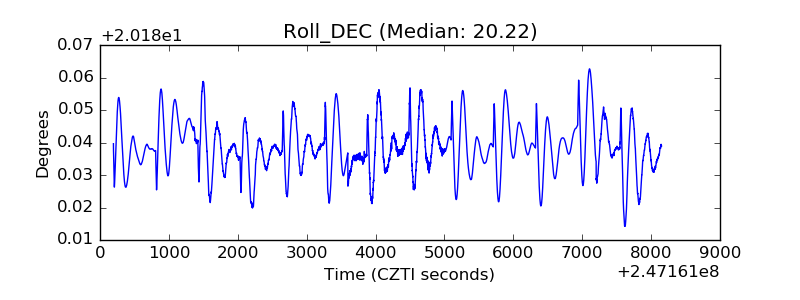 |
| _Roll_RA | 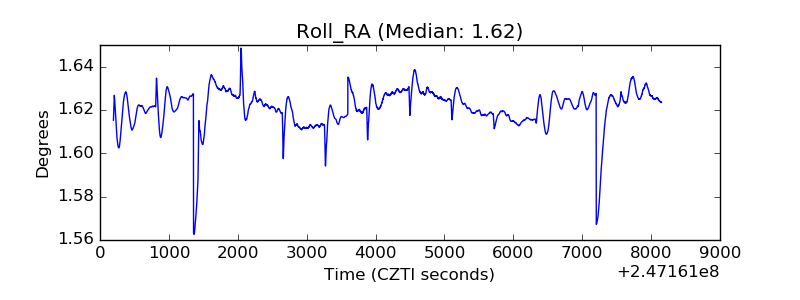 |
| Veto Counter | 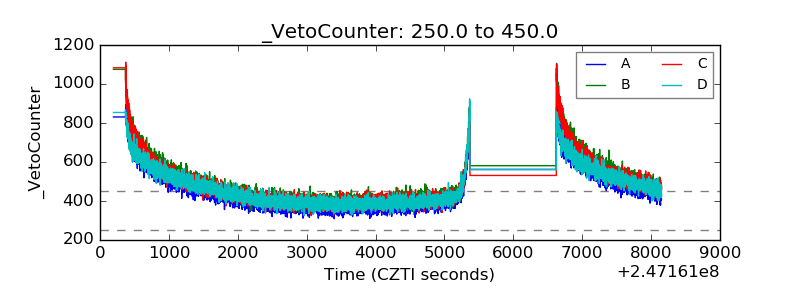 |