| Param | Original file | Final file |
|---|---|---|
| Filename | modeM0/AS1A04_137T01_9000001654_11318cztM0_level2.evt | modeM0/AS1A04_137T01_9000001654_11318cztM0_level2_quad_clean.evt |
| Size (bytes) | 181,958,400 | 41,633,280 |
| Size | 173.5 MB | 39.7 MB |
| Events in quadrant A | 1,312,309 | 284,362 |
| Events in quadrant B | 1,554,657 | 280,765 |
| Events in quadrant C | 1,313,439 | 282,391 |
| Events in quadrant D | 1,199,129 | 274,303 |
| Mode M0 | |||
|---|---|---|---|
| Quadrant | BADHDUFLAG | Total packets | Discarded packets |
| A | 0 | 5220 | 1 |
| B | 0 | 5896 | 1 |
| C | 0 | 5092 | 1 |
| D | 0 | 4794 | 1 |
| Mode SS | |||
|---|---|---|---|
| Quadrant | BADHDUFLAG | Total packets | Discarded packets |
| A | 0 | 38 | 0 |
| B | 0 | 38 | 0 |
| C | 0 | 38 | 0 |
| D | 0 | 38 | 0 |
| Quadrant | Total seconds | Saturated seconds | Saturation percentage |
|---|---|---|---|
| A | 1900 | 33 | 1.736842% |
| B | 1900 | 139 | 7.315789% |
| C | 1900 | 113 | 5.947368% |
| D | 1901 | 33 | 1.735928% |
Noise dominated data is calculated using 1-second bins in cleaned event files. If a bin has >2000 counts, and if more than 50% of those come from <1% of pixels, then it is considered to be noise-dominated and hence unusable.
| Quadrant | # 1 sec bins | Bins with >0 counts | Bins with >2000 counts | High rate bins dominated by noise | Noise dominated (total time) | Noise dominated (detector-on time) | Marked lightcurve |
|---|---|---|---|---|---|---|---|
| A | 1900 | 1900 | 13 | 13 | 0.68% | 0.68% | 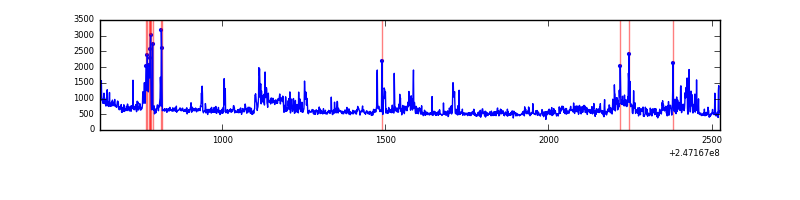 |
| B | 1900 | 1900 | 88 | 88 | 4.63% | 4.63% | 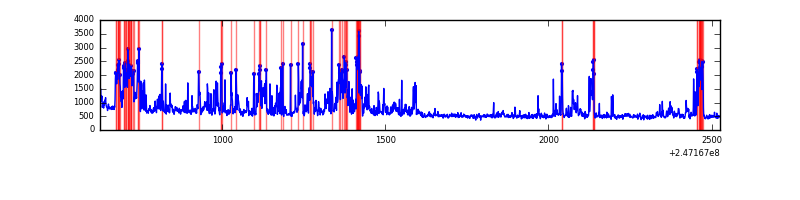 |
| C | 1900 | 1900 | 95 | 95 | 5.00% | 5.00% | 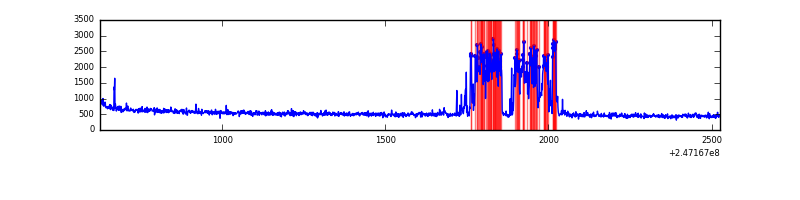 |
| D | 1901 | 1901 | 20 | 20 | 1.05% | 1.05% |  |
Top three noisy pixels from each quadrant. If the there are fewer than three noisy pixels in the level2.evt file, extra rows are filled as -1
| Pixel properties | Quadrant properties | ||||||
|---|---|---|---|---|---|---|---|
| Quadrant | DetID | PixID | Counts | Sigma | Mean | Median | Sigma |
| A | 8 | 5 | 137138 | 2544.97 | 256 | 251 | 53.8 |
| A | 0 | 8 | 58218 | 1077.71 | 256 | 251 | 53.8 |
| A | 8 | 15 | 55928 | 1035.13 | 256 | 251 | 53.8 |
| B | 4 | 239 | 268392 | 5645.64 | 247 | 242 | 47.5 |
| B | 3 | 64 | 200091 | 4207.63 | 247 | 242 | 47.5 |
| B | 15 | 204 | 43555 | 911.91 | 247 | 242 | 47.5 |
| C | 9 | 204 | 367364 | 6454.0 | 242 | 245 | 56.9 |
| C | 13 | 61 | 1733 | 26.16 | 242 | 245 | 56.9 |
| C | 12 | 4 | 998 | 13.24 | 242 | 245 | 56.9 |
| D | 7 | 80 | 77167 | 1277.44 | 249 | 243 | 60.2 |
| D | 1 | 52 | 65453 | 1082.91 | 249 | 243 | 60.2 |
| D | 2 | 120 | 52176 | 862.43 | 249 | 243 | 60.2 |
Histogram calculated using DETX and DETY for each event in the final _common_clean file
| Quadrant A | 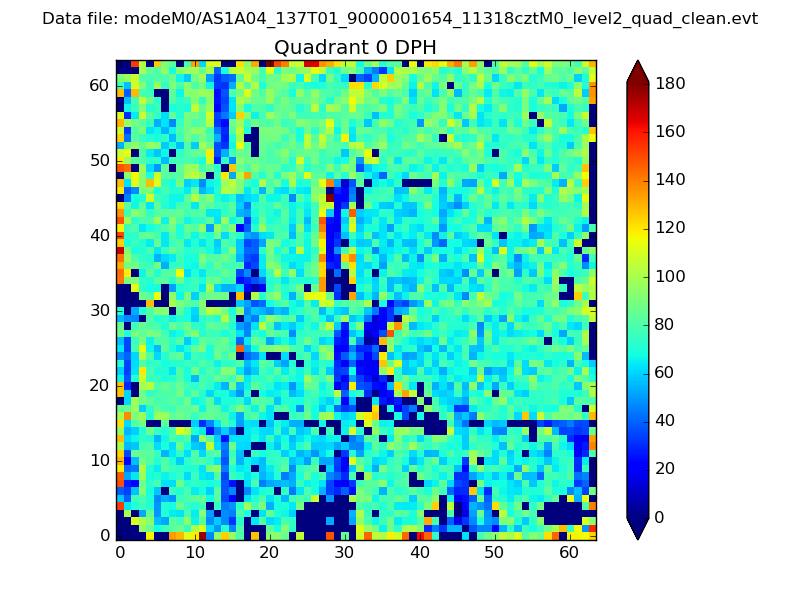 |
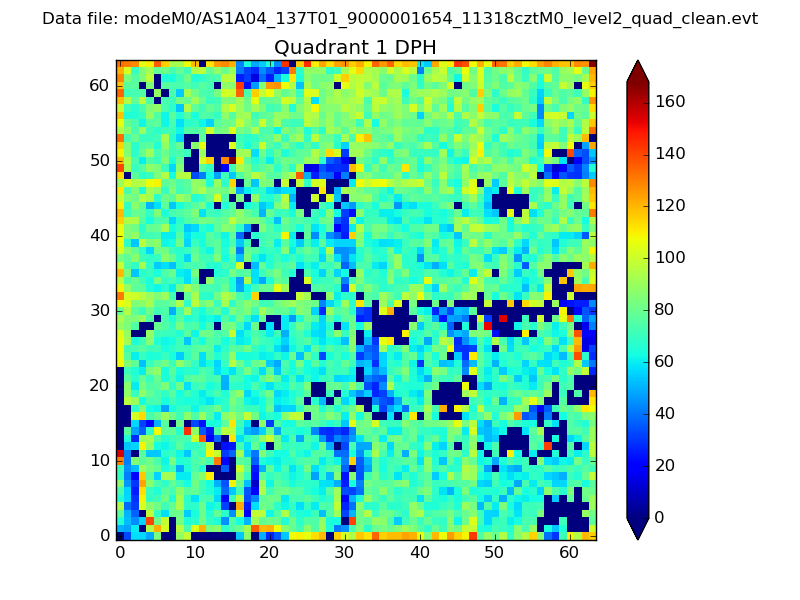 |
Quadrant B |
|---|---|---|---|
| Quadrant D | 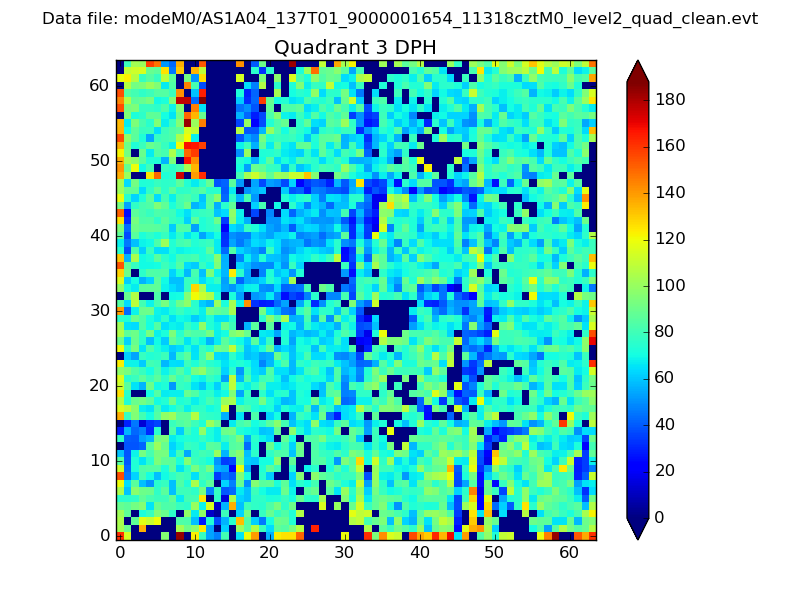 |
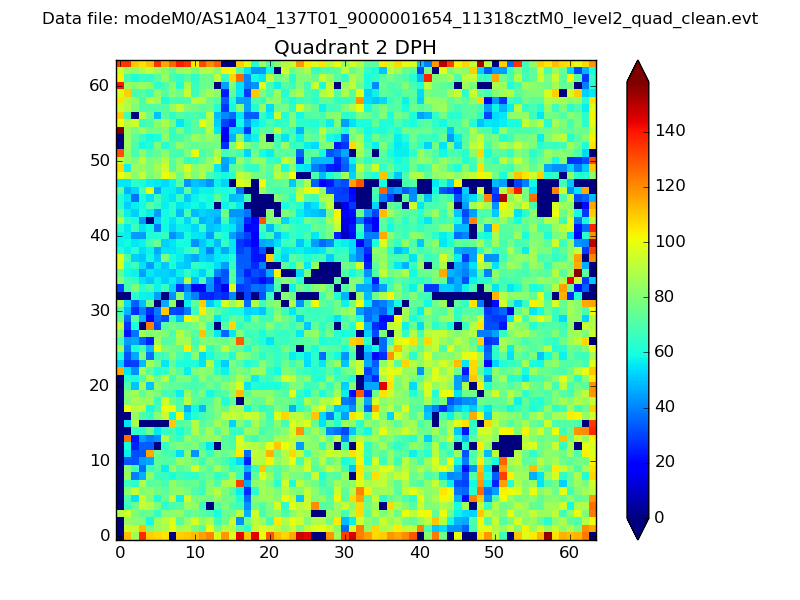 |
Quadrant C |
| Plot type | Count rate plots | Images |
|---|---|---|
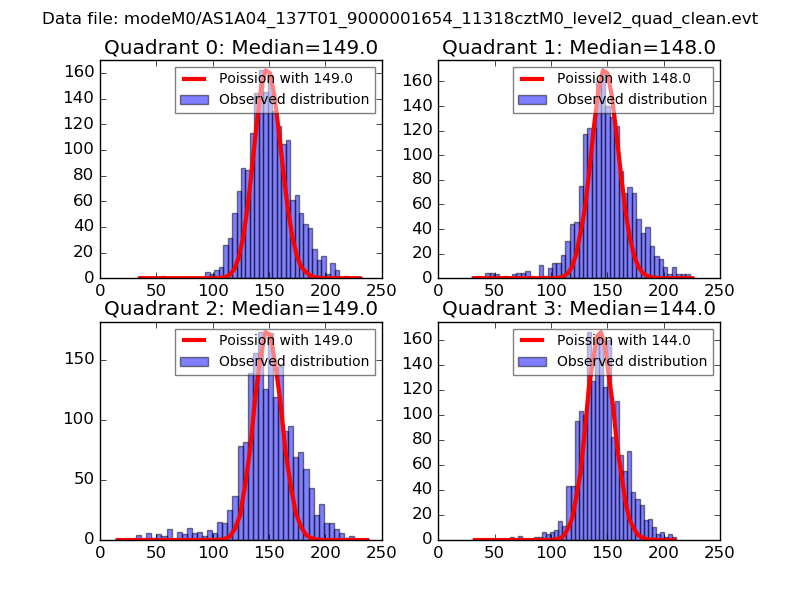
| Comparison with Poisson distribution Blue bars denote a histogram of data divided into 1 sec bins. Red curve is a Poisson curve with rate = median count rate of data. |
 |
 |
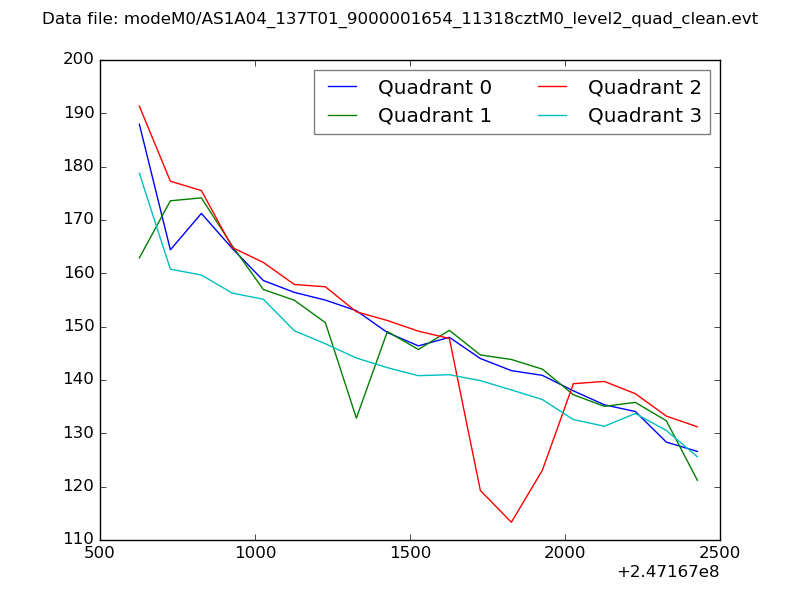
| Quadrant-wise count rates Data is divided into 100 sec bins |
 |
|
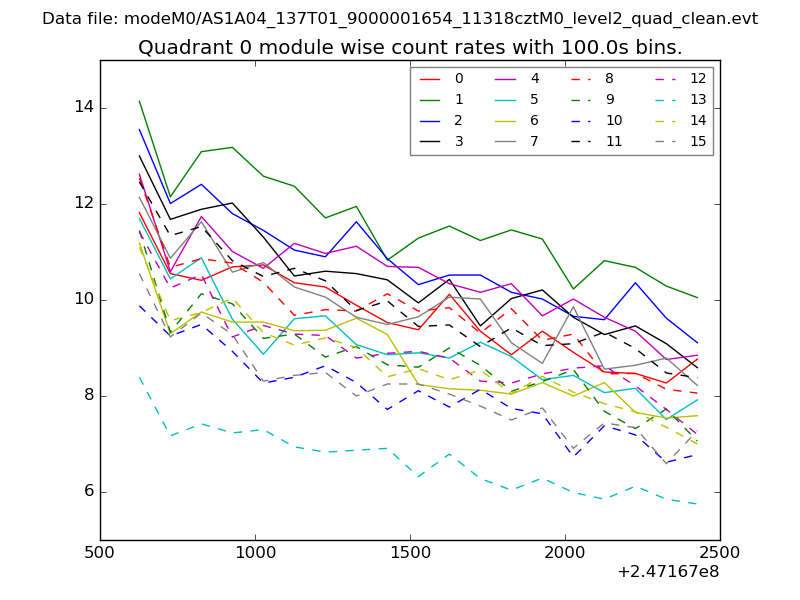
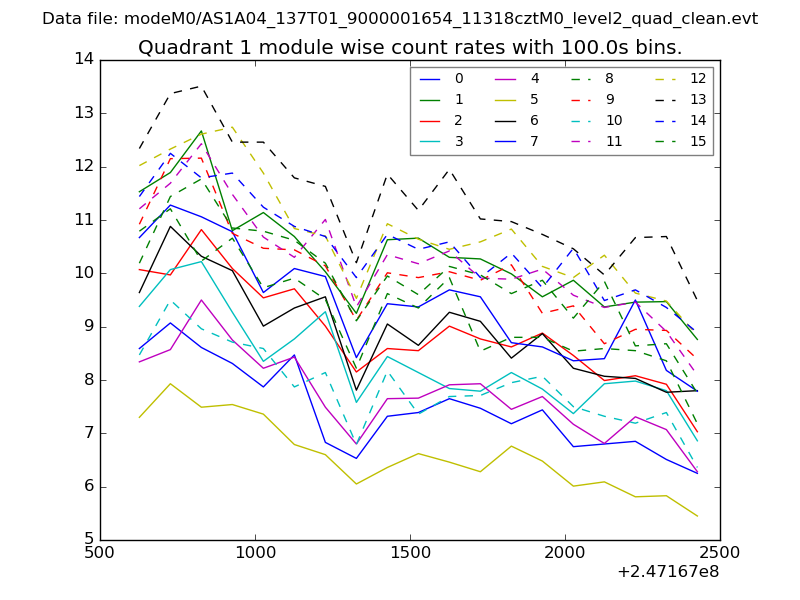
| Module-wise count rates for Quadrant A Data is divided into 100 sec bins |
 |
 |
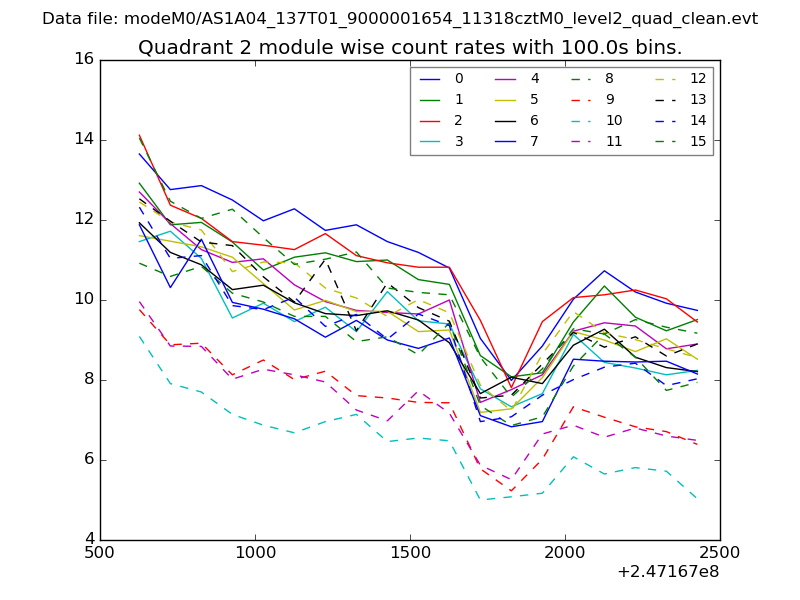
| Module-wise count rates for Quadrant B Data is divided into 100 sec bins |
 |
 |
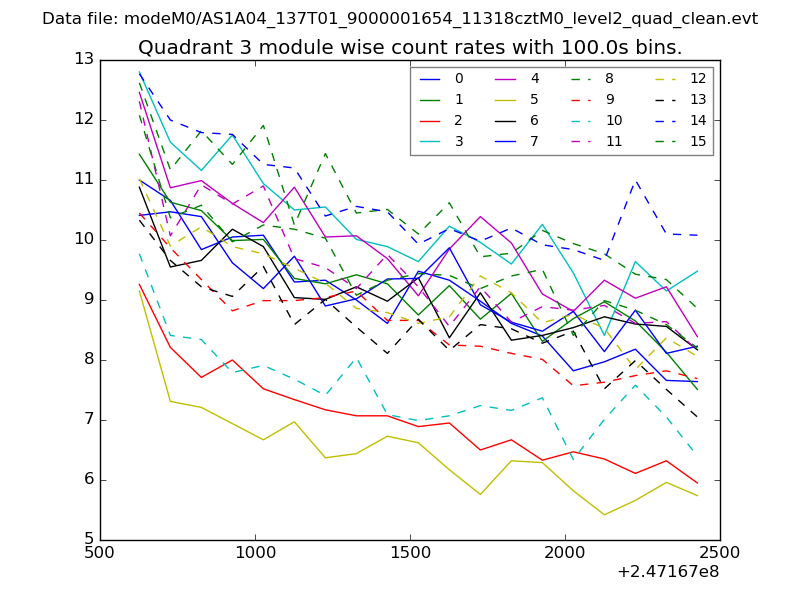
| Module-wise count rates for Quadrant C Data is divided into 100 sec bins |
 |
 |
| Module-wise count rates for Quadrant D Data is divided into 100 sec bins |
 |
 |
| Parameter | Plot |
|---|---|
| CZT HV Monitor | 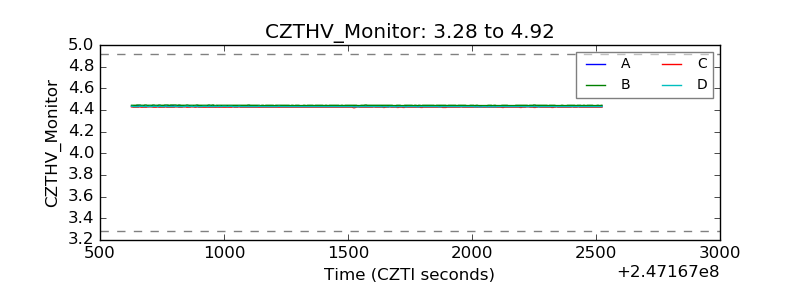 |
| D_VDD | 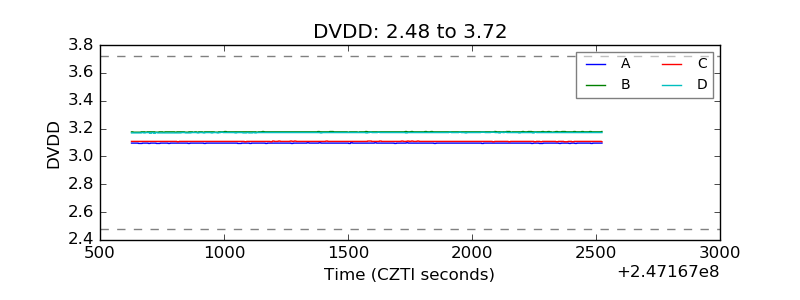 |
| Temperature 1 | 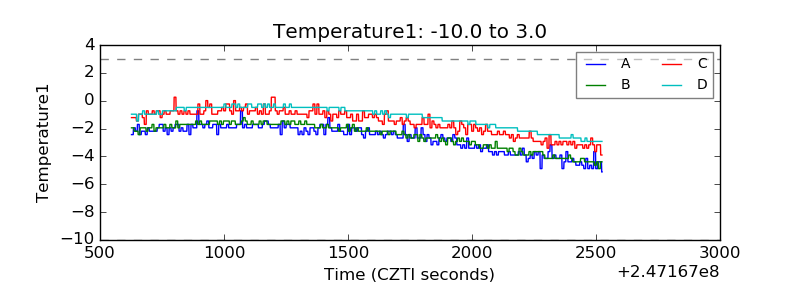 |
| Veto HV Monitor | 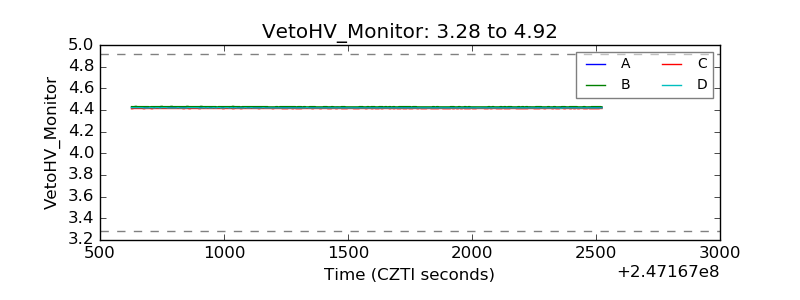 |
| Veto LLD | 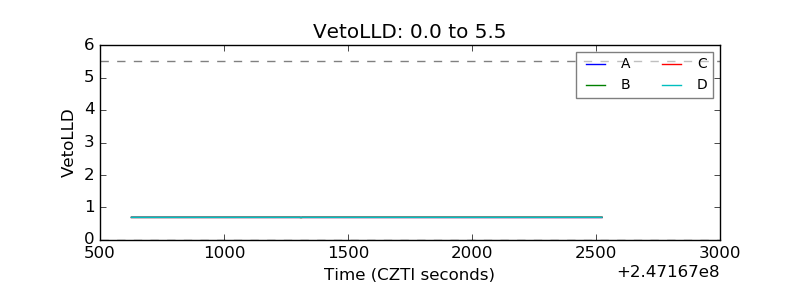 |
| Alpha Counter | 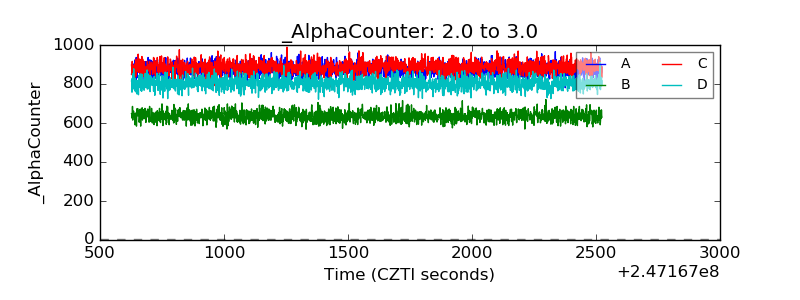 |
| _CPM_Rate | 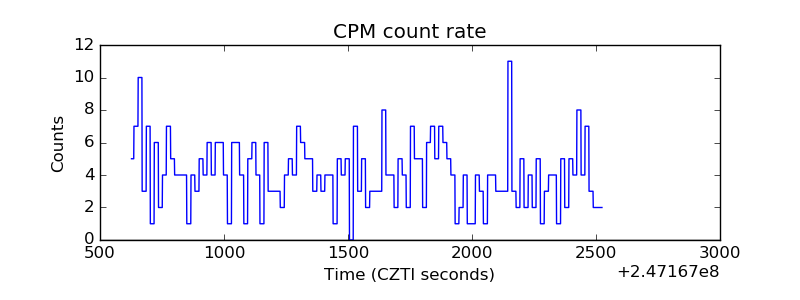 |
| CZT Counter | 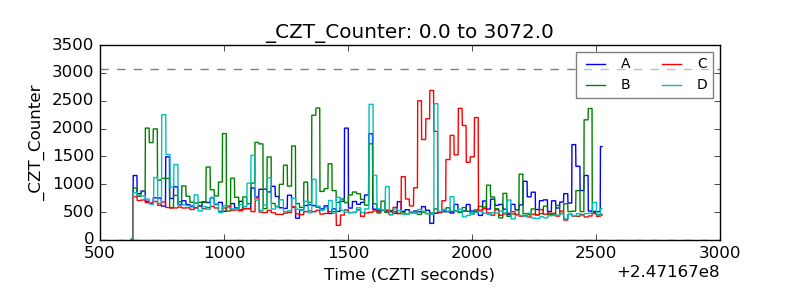 |
| +2.5 Volts monitor | 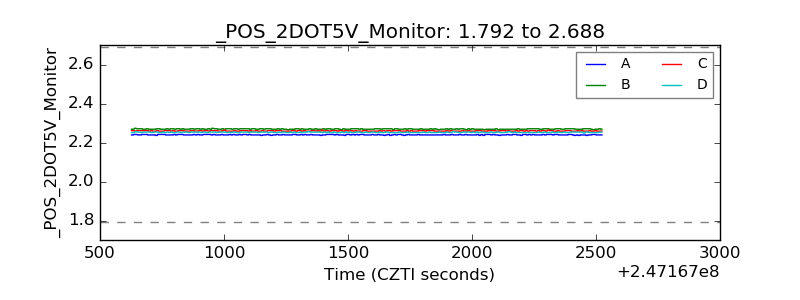 |
| +5 Volts monitor |  |
| _ROLL_ROT | 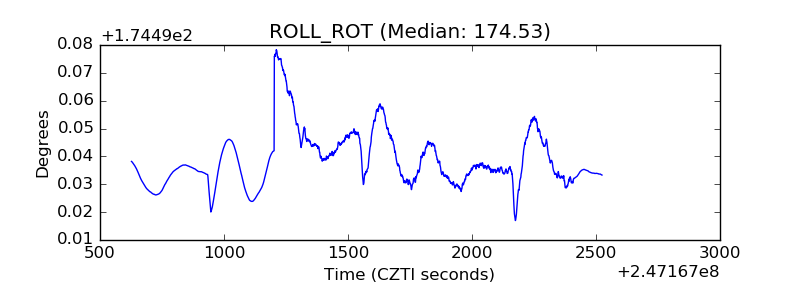 |
| _Roll_DEC |  |
| _Roll_RA | 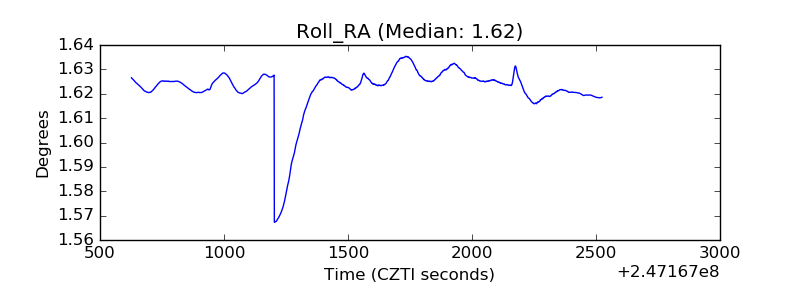 |
| Veto Counter | 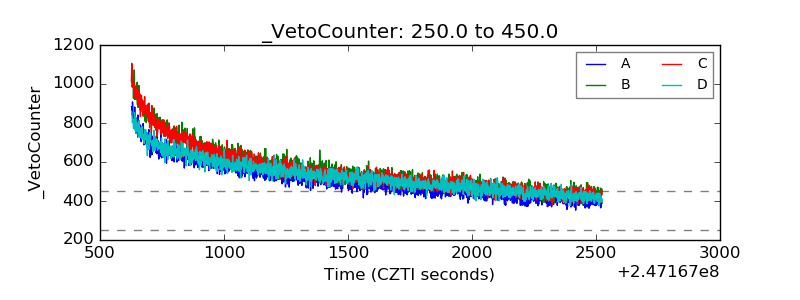 |