| Param | Original file | Final file |
|---|---|---|
| Filename | modeM0/AS1G08_028T01_9000001656cztM0_level2.fits | modeM0/AS1G08_028T01_9000001656cztM0_level2_quad_clean.evt |
| Size (bytes) | 344,833,920 | 281,073,600 |
| Size | 328.9 MB | 268.1 MB |
| Events in quadrant A | 1,949,052 | 1,428,422 |
| Events in quadrant B | 2,071,730 | 1,622,409 |
| Events in quadrant C | 2,084,330 | 1,500,943 |
| Events in quadrant D | 1,723,134 | 1,350,220 |
| Mode SS | |||
|---|---|---|---|
| Quadrant | BADHDUFLAG | Total packets | Discarded packets |
| A | 0 | 770 | 0 |
| B | 0 | 770 | 0 |
| C | 0 | 770 | 0 |
| D | 0 | 770 | 0 |
| Mode M0 | |||
|---|---|---|---|
| Quadrant | BADHDUFLAG | Total packets | Discarded packets |
| A | 0 | 126185 | 0 |
| B | 0 | 96086 | 0 |
| C | 0 | 96394 | 0 |
| D | 0 | 122029 | 0 |
| Mode M9 | |||
|---|---|---|---|
| Quadrant | BADHDUFLAG | Total packets | Discarded packets |
| A | 0 | 54 | 0 |
| B | 0 | 54 | 0 |
| C | 0 | 54 | 0 |
| D | 0 | 54 | 0 |
| Quadrant | Total seconds | Saturated seconds | Saturation percentage |
|---|---|---|---|
| A | 37985 | 6749 | 17.767540% |
| B | 37985 | 2168 | 5.707516% |
| C | 37985 | 2625 | 6.910623% |
| D | 37985 | 4225 | 11.122812% |
Noise dominated data is calculated using 1-second bins in cleaned event files. If a bin has >2000 counts, and if more than 50% of those come from <1% of pixels, then it is considered to be noise-dominated and hence unusable.
| Quadrant | # 1 sec bins | Bins with >0 counts | Bins with >2000 counts | High rate bins dominated by noise | Noise dominated (total time) | Noise dominated (detector-on time) | Marked lightcurve |
|---|---|---|---|---|---|---|---|
| A | 43315 | 37536 | 0 | 0 | 0.00% | 0.00% |  |
| B | 43315 | 37984 | 0 | 0 | 0.00% | 0.00% |  |
| C | 43315 | 37985 | 0 | 0 | 0.00% | 0.00% |  |
| D | 43315 | 37660 | 0 | 0 | 0.00% | 0.00% |  |
Top three noisy pixels from each quadrant. If the there are fewer than three noisy pixels in the level2.evt file, extra rows are filled as -1
| Pixel properties | Quadrant properties | ||||||
|---|---|---|---|---|---|---|---|
| Quadrant | DetID | PixID | Counts | Sigma | Mean | Median | Sigma |
| A | 0 | 29 | 1897 | 10.99 | 507 | 474 | 129.5 |
| A | 7 | 110 | 1621 | 8.86 | 507 | 474 | 129.5 |
| A | 9 | 19 | 1470 | 7.69 | 507 | 474 | 129.5 |
| B | 2 | 9 | 1861 | 12.08 | 547 | 520 | 111.0 |
| B | 5 | 225 | 1442 | 8.31 | 547 | 520 | 111.0 |
| B | 3 | 17 | 1396 | 7.89 | 547 | 520 | 111.0 |
| C | 12 | 241 | 1522 | 7.0 | 550 | 509 | 144.7 |
| C | 3 | 158 | 1375 | 5.99 | 550 | 509 | 144.7 |
| C | 2 | 191 | 1371 | 5.96 | 550 | 509 | 144.7 |
| D | 3 | 14 | 1366 | 6.89 | 491 | 446 | 133.5 |
| D | 6 | 231 | 1277 | 6.22 | 491 | 446 | 133.5 |
| D | 7 | 3 | 1234 | 5.9 | 491 | 446 | 133.5 |
Histogram calculated using DETX and DETY for each event in the final _common_clean file
| Quadrant A | 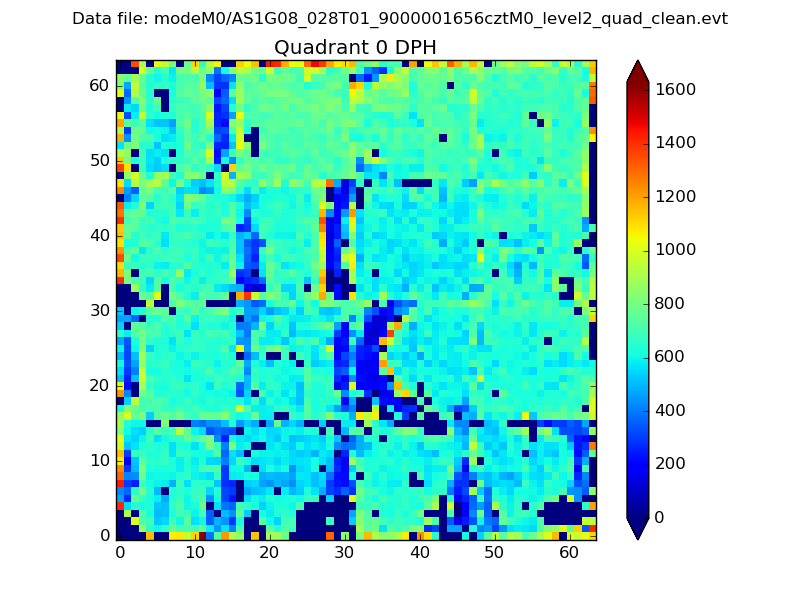 |
 |
Quadrant B |
|---|---|---|---|
| Quadrant D | 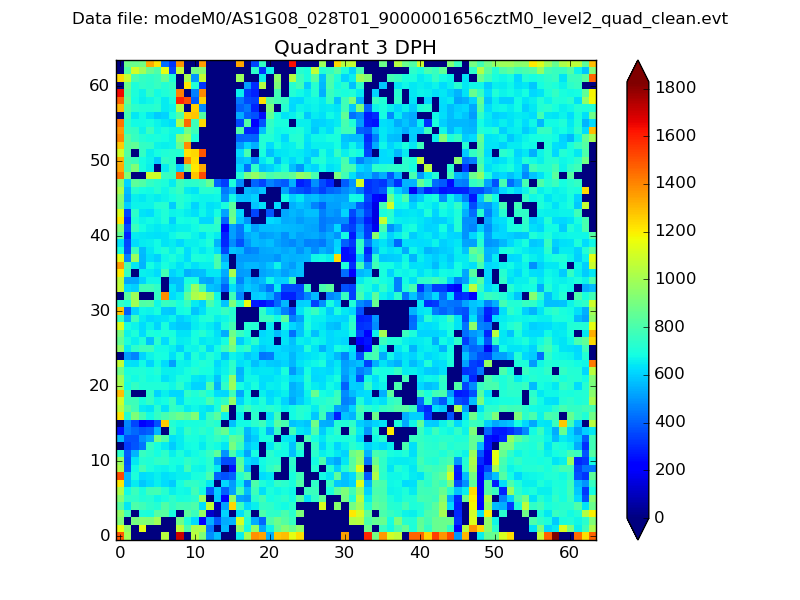 |
 |
Quadrant C |
| Plot type | Count rate plots | Images |
|---|---|---|
| Comparison with Poisson distribution Blue bars denote a histogram of data divided into 1 sec bins. Red curve is a Poisson curve with rate = median count rate of data. |
 |
 |
| Quadrant-wise count rates Data is divided into 100 sec bins |
 |
|
| Module-wise count rates for Quadrant A Data is divided into 100 sec bins |
 |
 |
| Module-wise count rates for Quadrant B Data is divided into 100 sec bins |
 |
 |
| Module-wise count rates for Quadrant C Data is divided into 100 sec bins |
 |
 |
| Module-wise count rates for Quadrant D Data is divided into 100 sec bins |
 |
 |
| Parameter | Plot |
|---|---|
| CZT HV Monitor |  |
| D_VDD |  |
| Temperature 1 |  |
| Veto HV Monitor |  |
| Veto LLD |  |
| Alpha Counter |  |
| _CPM_Rate |  |
| CZT Counter |  |
| +2.5 Volts monitor |  |
| +5 Volts monitor |  |
| _ROLL_ROT |  |
| _Roll_DEC |  |
| _Roll_RA |  |
| Veto Counter |  |