| Param | Original file | Final file |
|---|---|---|
| Filename | modeM0/AS1G08_028T01_9000001656_11318cztM0_level2.evt | modeM0/AS1G08_028T01_9000001656_11318cztM0_level2_quad_clean.evt |
| Size (bytes) | 337,547,520 | 49,291,200 |
| Size | 321.9 MB | 47.0 MB |
| Events in quadrant A | 2,214,138 | 315,042 |
| Events in quadrant B | 2,443,007 | 321,410 |
| Events in quadrant C | 2,144,489 | 314,580 |
| Events in quadrant D | 3,181,497 | 292,178 |
| Mode SS | |||
|---|---|---|---|
| Quadrant | BADHDUFLAG | Total packets | Discarded packets |
| A | 0 | 72 | 0 |
| B | 0 | 72 | 0 |
| C | 0 | 72 | 0 |
| D | 0 | 72 | 0 |
| Mode M0 | |||
|---|---|---|---|
| Quadrant | BADHDUFLAG | Total packets | Discarded packets |
| A | 0 | 8772 | 2 |
| B | 0 | 9473 | 1 |
| C | 0 | 8612 | 1 |
| D | 0 | 11804 | 1 |
| Mode M9 | |||
|---|---|---|---|
| Quadrant | BADHDUFLAG | Total packets | Discarded packets |
| A | 0 | 13 | 0 |
| B | 0 | 13 | 0 |
| C | 0 | 13 | 0 |
| D | 0 | 13 | 0 |
| Quadrant | Total seconds | Saturated seconds | Saturation percentage |
|---|---|---|---|
| A | 3517 | 104 | 2.957066% |
| B | 3517 | 220 | 6.255331% |
| C | 3517 | 86 | 2.445266% |
| D | 3517 | 331 | 9.411430% |
Noise dominated data is calculated using 1-second bins in cleaned event files. If a bin has >2000 counts, and if more than 50% of those come from <1% of pixels, then it is considered to be noise-dominated and hence unusable.
| Quadrant | # 1 sec bins | Bins with >0 counts | Bins with >2000 counts | High rate bins dominated by noise | Noise dominated (total time) | Noise dominated (detector-on time) | Marked lightcurve |
|---|---|---|---|---|---|---|---|
| A | 4817 | 3518 | 55 | 55 | 1.14% | 1.56% | 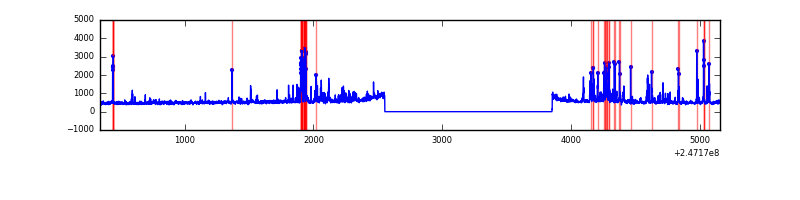 |
| B | 4817 | 3518 | 101 | 101 | 2.10% | 2.87% | 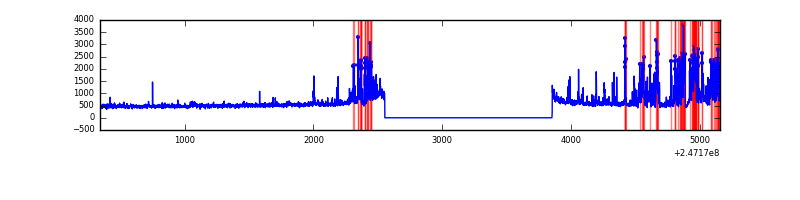 |
| C | 4817 | 3518 | 42 | 42 | 0.87% | 1.19% | 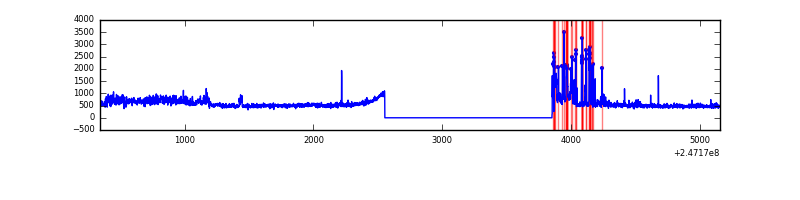 |
| D | 4817 | 3518 | 238 | 238 | 4.94% | 6.77% | 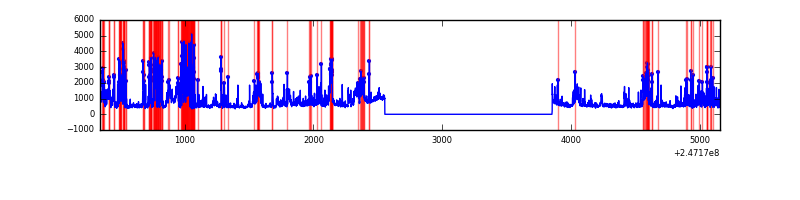 |
Top three noisy pixels from each quadrant. If the there are fewer than three noisy pixels in the level2.evt file, extra rows are filled as -1
| Pixel properties | Quadrant properties | ||||||
|---|---|---|---|---|---|---|---|
| Quadrant | DetID | PixID | Counts | Sigma | Mean | Median | Sigma |
| A | 8 | 5 | 292385 | 3067.77 | 460 | 451 | 95.2 |
| A | 6 | 16 | 45627 | 474.73 | 460 | 451 | 95.2 |
| A | 14 | 238 | 40437 | 420.19 | 460 | 451 | 95.2 |
| B | 4 | 239 | 491323 | 5510.16 | 460 | 448 | 89.1 |
| B | 3 | 189 | 111345 | 1244.84 | 460 | 448 | 89.1 |
| B | 15 | 204 | 20957 | 230.22 | 460 | 448 | 89.1 |
| C | 9 | 204 | 400585 | 3824.14 | 445 | 447 | 104.6 |
| C | 14 | 234 | 4383 | 37.62 | 445 | 447 | 104.6 |
| C | 12 | 4 | 3965 | 33.62 | 445 | 447 | 104.6 |
| D | 7 | 80 | 656959 | 6281.45 | 429 | 417 | 104.5 |
| D | 10 | 253 | 553005 | 5286.87 | 429 | 417 | 104.5 |
| D | 2 | 120 | 191148 | 1824.81 | 429 | 417 | 104.5 |
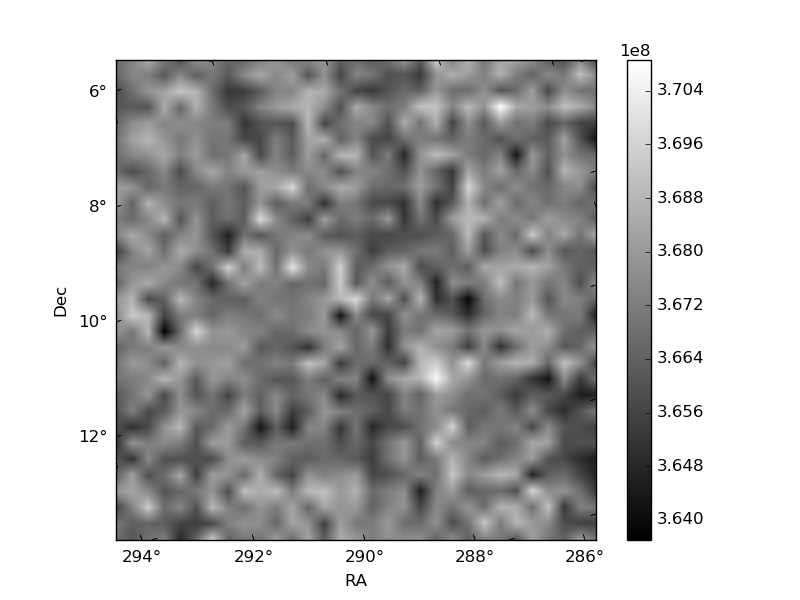
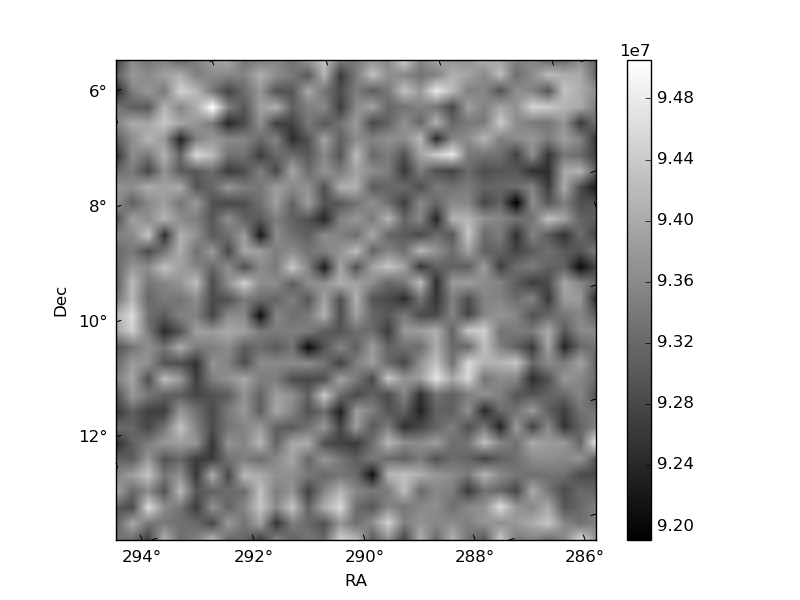
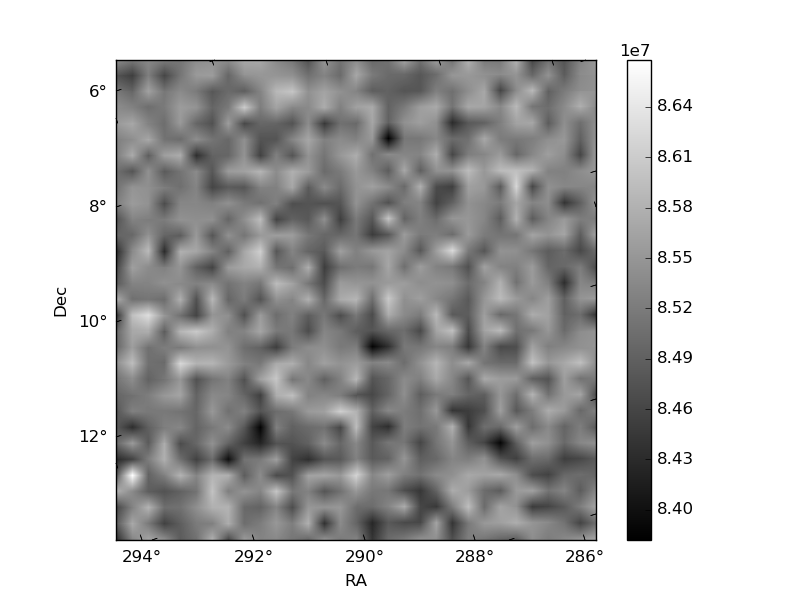
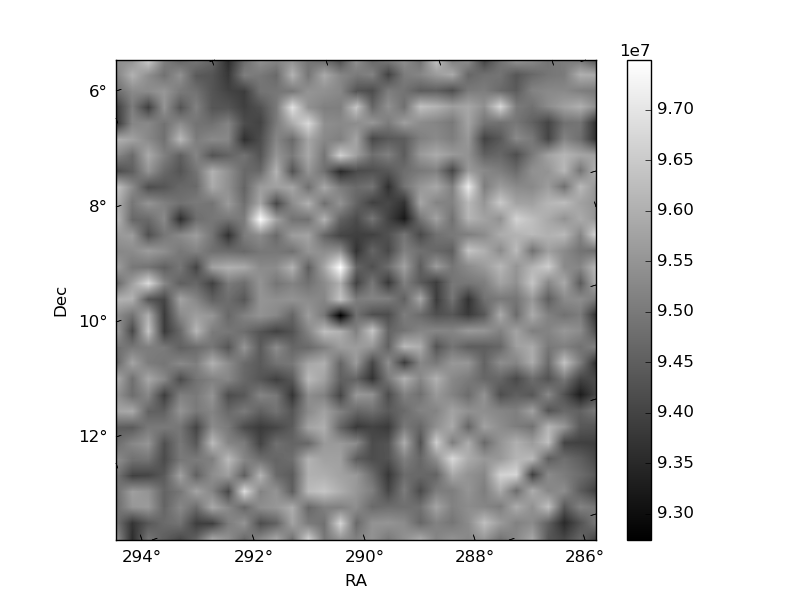
Histogram calculated using DETX and DETY for each event in the final _common_clean file
| Quadrant A | 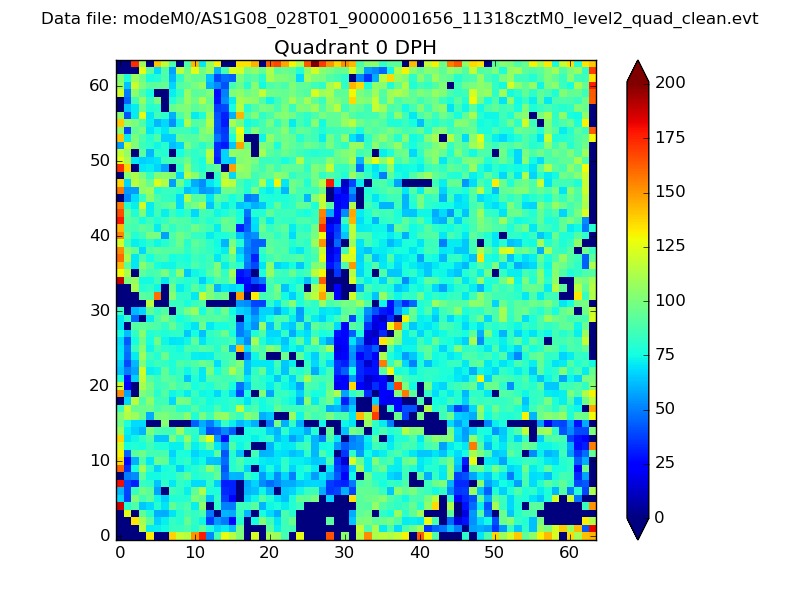 |
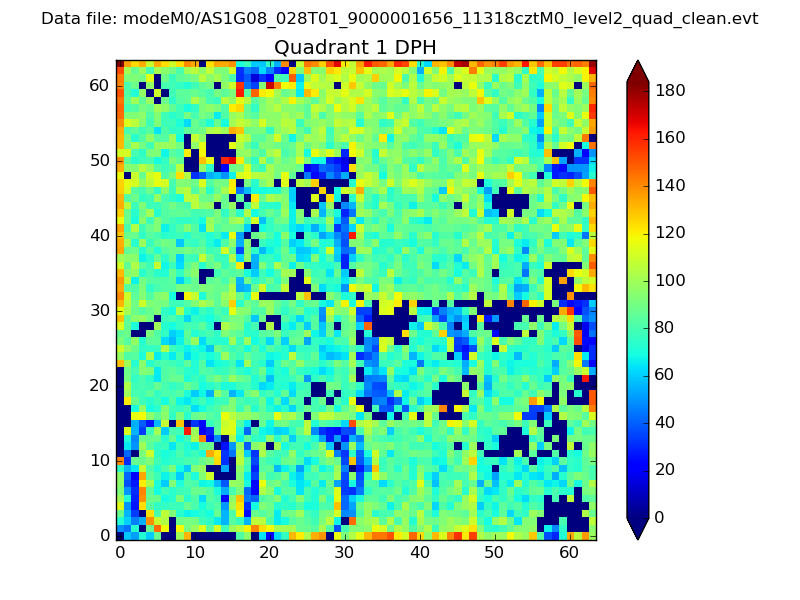 |
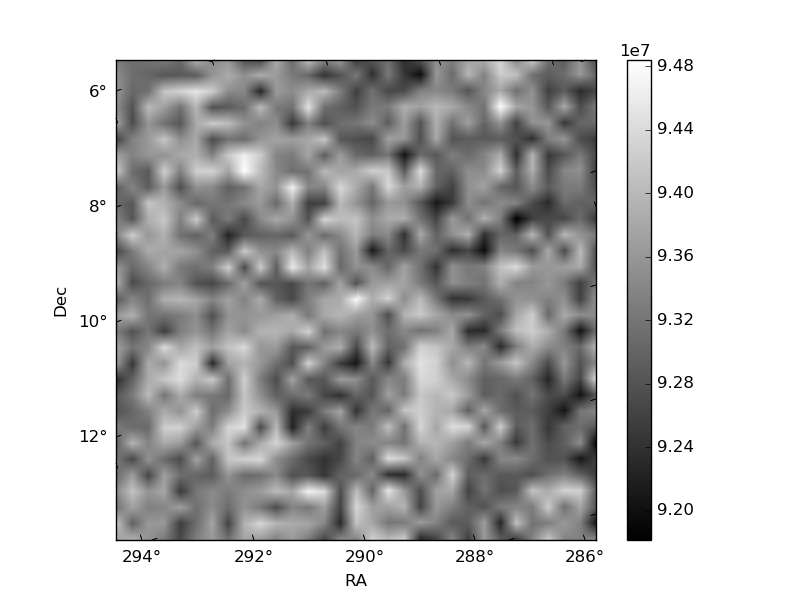
Quadrant B |
|---|---|---|---|
| Quadrant D | 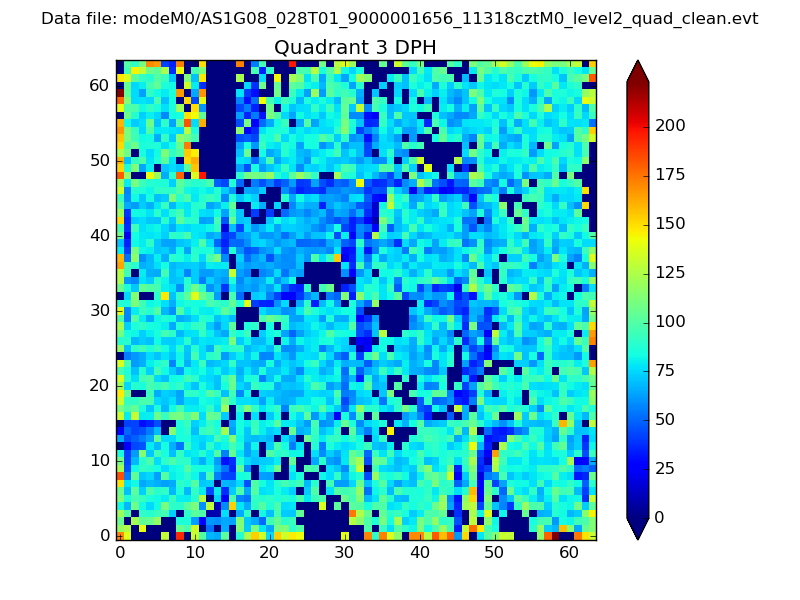 |
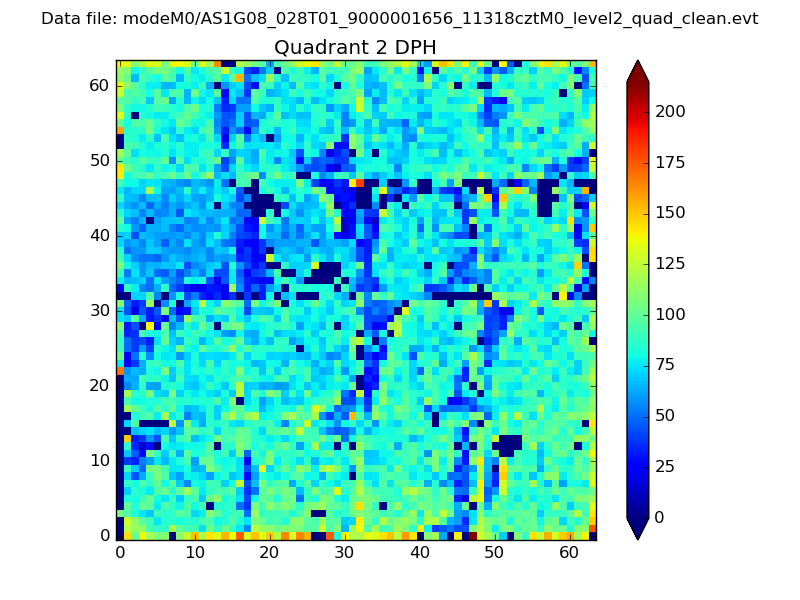 |
Quadrant C |
| Plot type | Count rate plots | Images |
|---|---|---|
| Comparison with Poisson distribution Blue bars denote a histogram of data divided into 1 sec bins. Red curve is a Poisson curve with rate = median count rate of data. |
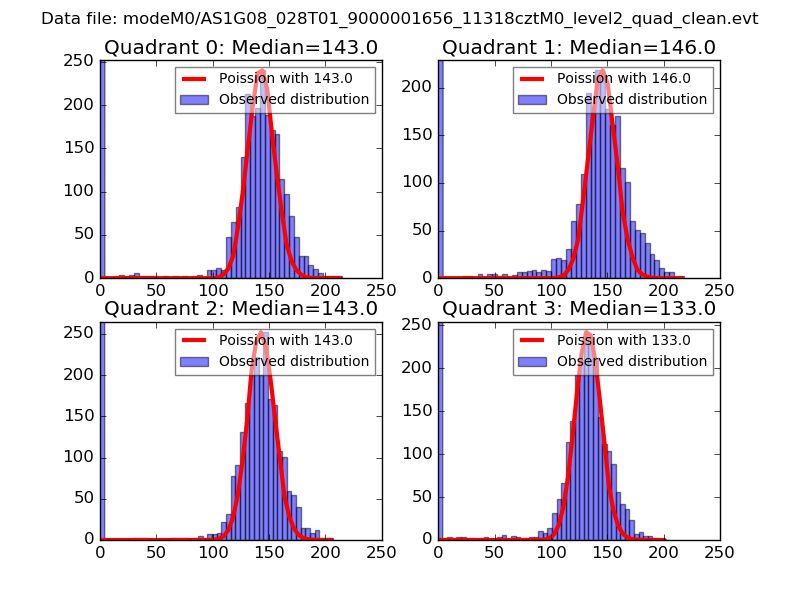 |
 |
| Quadrant-wise count rates Data is divided into 100 sec bins |
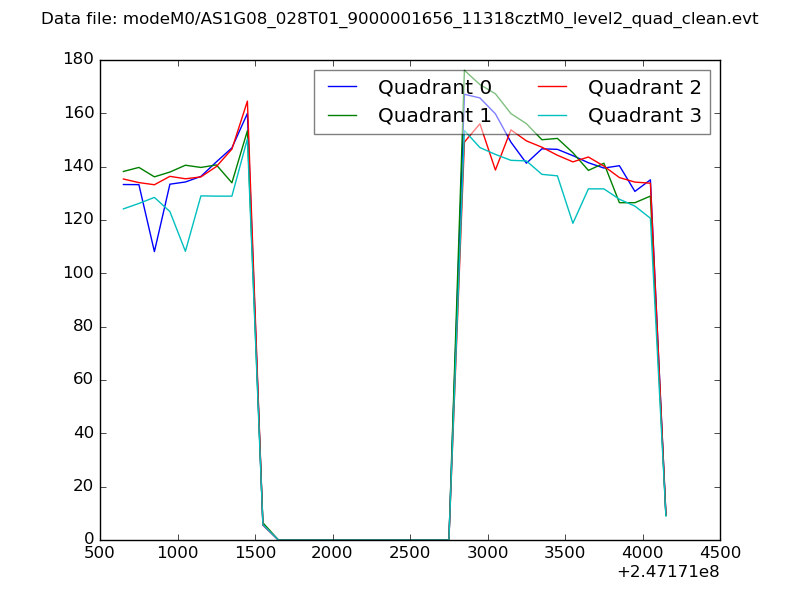 |
|
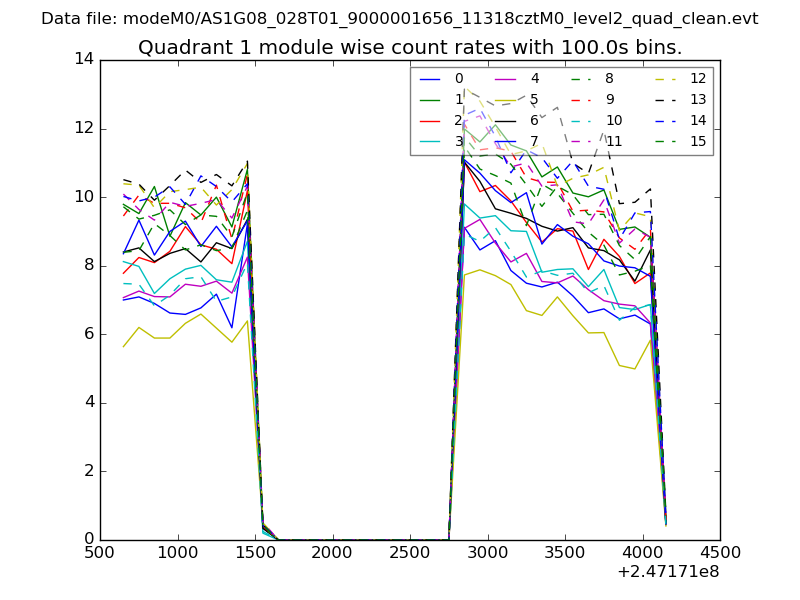
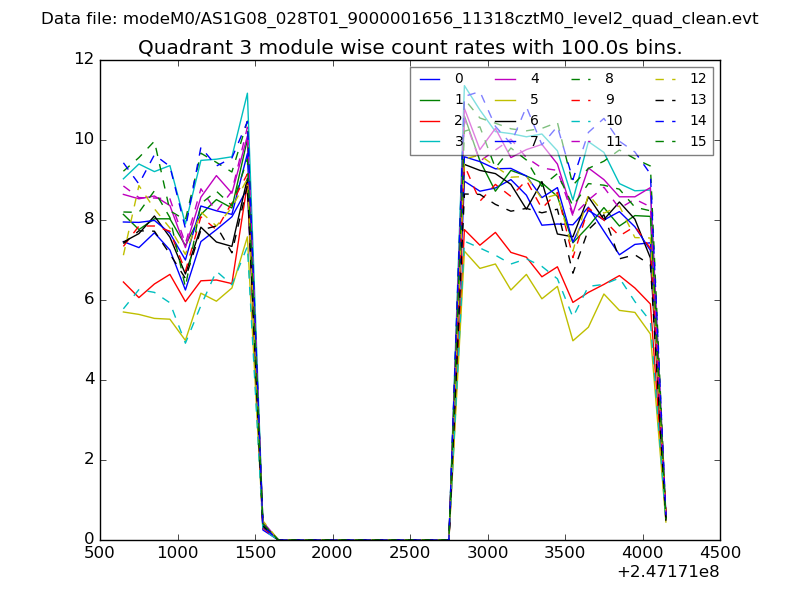
| Module-wise count rates for Quadrant A Data is divided into 100 sec bins |
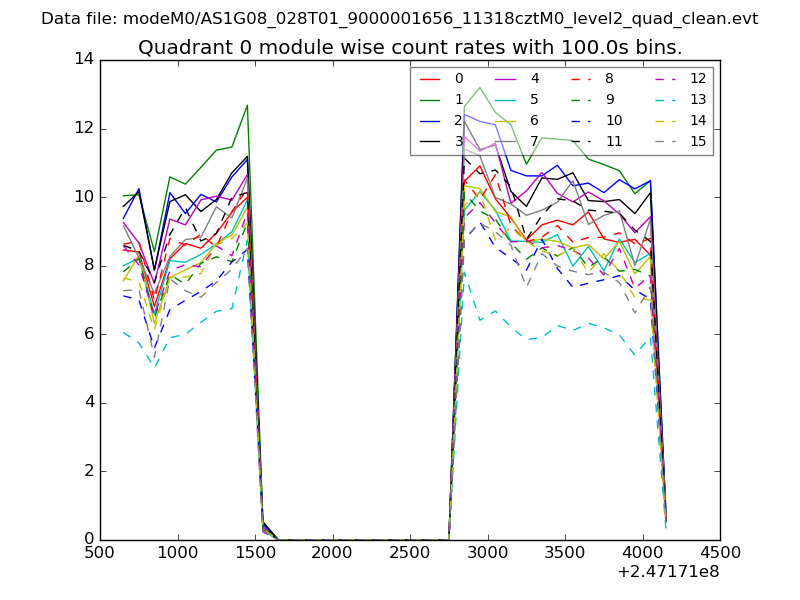 |
 |
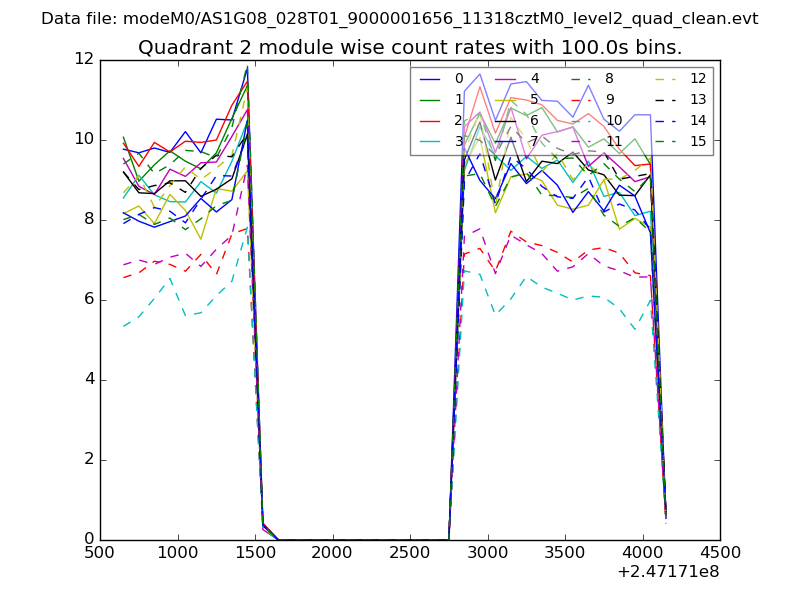
| Module-wise count rates for Quadrant B Data is divided into 100 sec bins |
 |
 |
| Module-wise count rates for Quadrant C Data is divided into 100 sec bins |
 |
 |
| Module-wise count rates for Quadrant D Data is divided into 100 sec bins |
 |
 |
| Parameter | Plot |
|---|---|
| CZT HV Monitor | 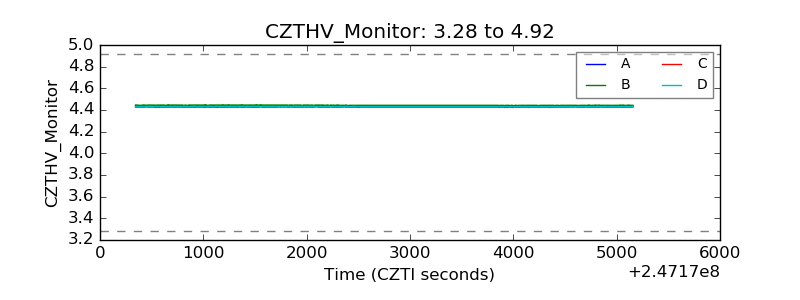 |
| D_VDD | 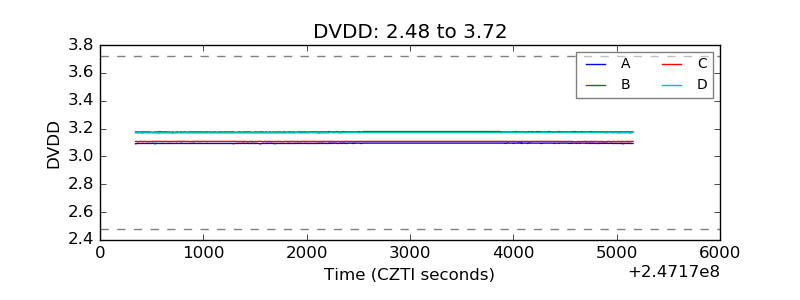 |
| Temperature 1 | 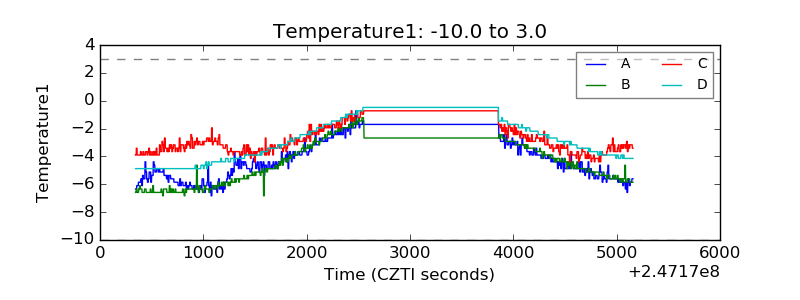 |
| Veto HV Monitor | 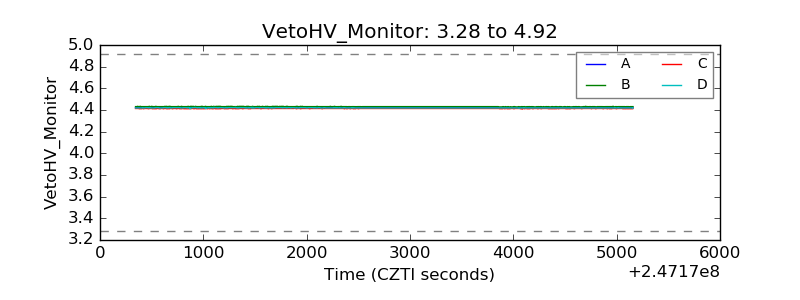 |
| Veto LLD | 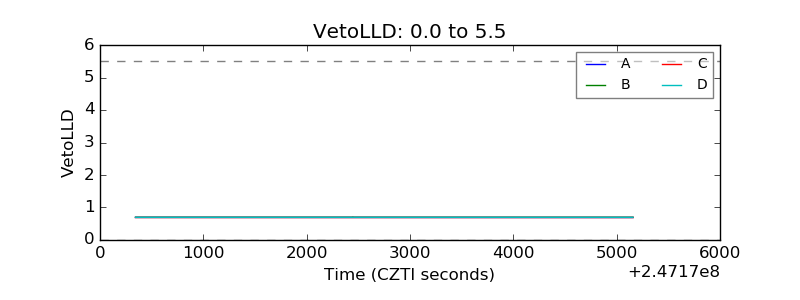 |
| Alpha Counter | 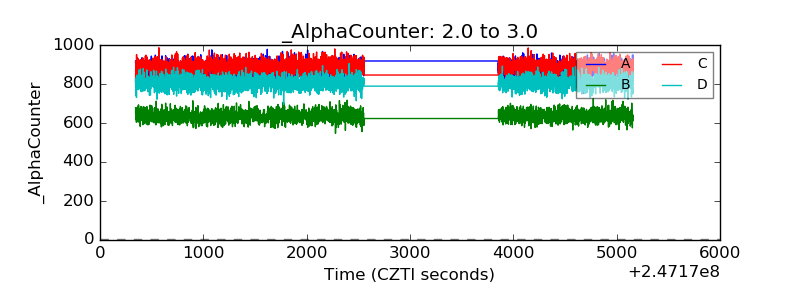 |
| _CPM_Rate | 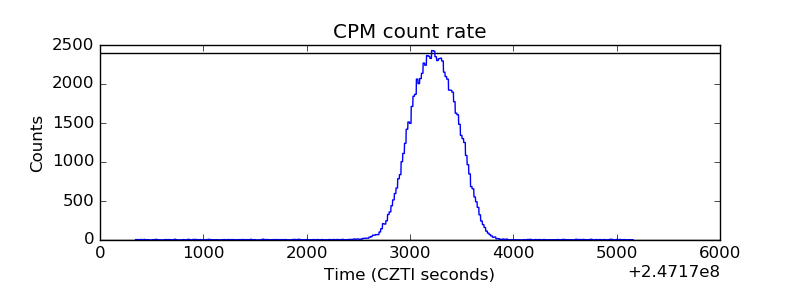 |
| CZT Counter | 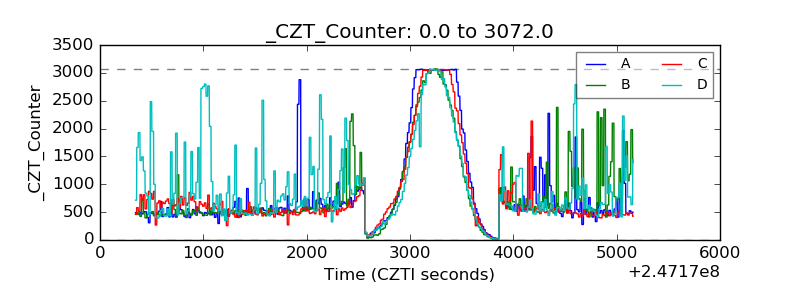 |
| +2.5 Volts monitor |  |
| +5 Volts monitor |  |
| _ROLL_ROT | 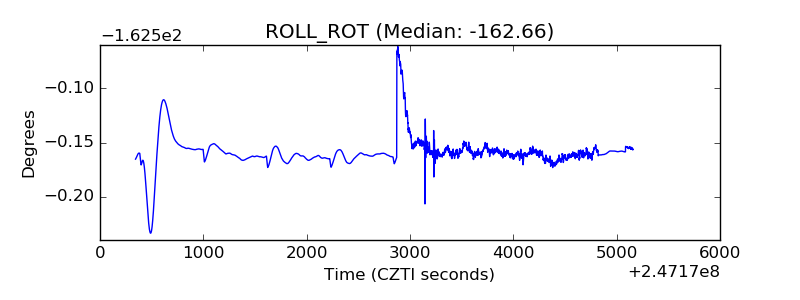 |
| _Roll_DEC | 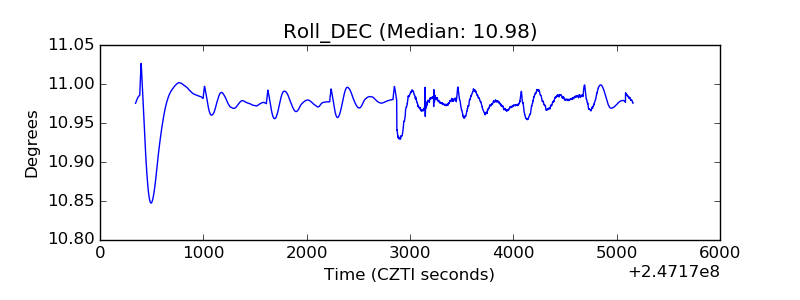 |
| _Roll_RA | 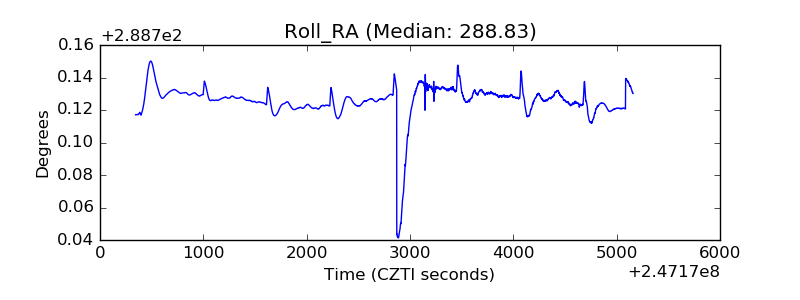 |
| Veto Counter | 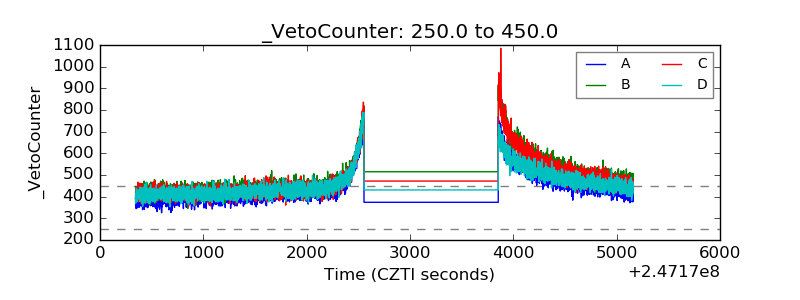 |