| Param | Original file | Final file |
|---|---|---|
| Filename | modeM0/AS1G08_028T01_9000001656_11320cztM0_level2.evt | modeM0/AS1G08_028T01_9000001656_11320cztM0_level2_quad_clean.evt |
| Size (bytes) | 603,383,040 | 63,786,240 |
| Size | 575.4 MB | 60.8 MB |
| Events in quadrant A | 5,025,746 | 377,667 |
| Events in quadrant B | 3,732,335 | 393,804 |
| Events in quadrant C | 3,022,316 | 387,635 |
| Events in quadrant D | 6,075,468 | 341,145 |
| Mode SS | |||
|---|---|---|---|
| Quadrant | BADHDUFLAG | Total packets | Discarded packets |
| A | 0 | 126 | 0 |
| B | 0 | 126 | 0 |
| C | 0 | 126 | 0 |
| D | 0 | 126 | 0 |
| Mode M0 | |||
|---|---|---|---|
| Quadrant | BADHDUFLAG | Total packets | Discarded packets |
| A | 0 | 18865 | 2 |
| B | 0 | 15033 | 1 |
| C | 0 | 13012 | 1 |
| D | 0 | 22242 | 1 |
| Mode M9 | |||
|---|---|---|---|
| Quadrant | BADHDUFLAG | Total packets | Discarded packets |
| A | 0 | 12 | 0 |
| B | 0 | 12 | 0 |
| C | 0 | 12 | 0 |
| D | 0 | 12 | 0 |
| Quadrant | Total seconds | Saturated seconds | Saturation percentage |
|---|---|---|---|
| A | 6166 | 721 | 11.693156% |
| B | 6166 | 220 | 3.567953% |
| C | 6166 | 41 | 0.664937% |
| D | 6166 | 818 | 13.266299% |
Noise dominated data is calculated using 1-second bins in cleaned event files. If a bin has >2000 counts, and if more than 50% of those come from <1% of pixels, then it is considered to be noise-dominated and hence unusable.
| Quadrant | # 1 sec bins | Bins with >0 counts | Bins with >2000 counts | High rate bins dominated by noise | Noise dominated (total time) | Noise dominated (detector-on time) | Marked lightcurve |
|---|---|---|---|---|---|---|---|
| A | 7356 | 6167 | 493 | 493 | 6.70% | 7.99% |  |
| B | 7356 | 6167 | 86 | 86 | 1.17% | 1.39% | 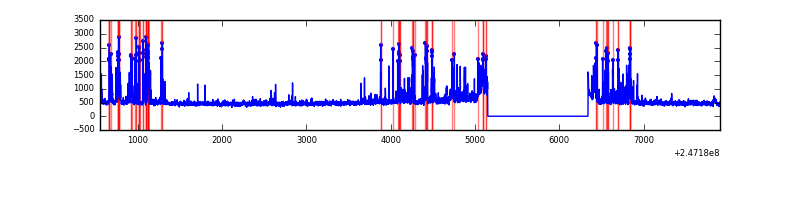 |
| C | 7356 | 6167 | 29 | 29 | 0.39% | 0.47% | 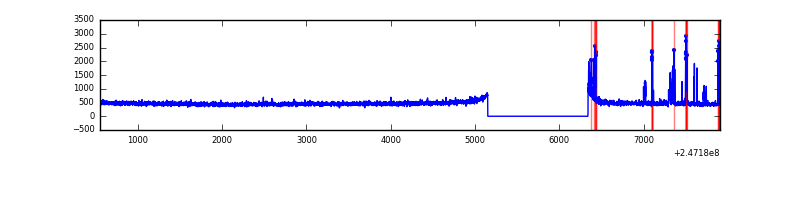 |
| D | 7356 | 6166 | 756 | 756 | 10.28% | 12.26% |  |
Top three noisy pixels from each quadrant. If the there are fewer than three noisy pixels in the level2.evt file, extra rows are filled as -1
| Pixel properties | Quadrant properties | ||||||
|---|---|---|---|---|---|---|---|
| Quadrant | DetID | PixID | Counts | Sigma | Mean | Median | Sigma |
| A | 14 | 238 | 1597441 | 11118.52 | 698 | 685 | 143.6 |
| A | 8 | 5 | 552569 | 3842.87 | 698 | 685 | 143.6 |
| A | 1 | 162 | 53568 | 368.23 | 698 | 685 | 143.6 |
| B | 4 | 239 | 692614 | 4833.84 | 747 | 730 | 143.1 |
| B | 15 | 204 | 44940 | 308.87 | 747 | 730 | 143.1 |
| B | 0 | 214 | 18929 | 127.15 | 747 | 730 | 143.1 |
| C | 9 | 204 | 172502 | 1018.18 | 726 | 729 | 168.7 |
| C | 8 | 128 | 8575 | 46.51 | 726 | 729 | 168.7 |
| C | 13 | 61 | 5357 | 27.43 | 726 | 729 | 168.7 |
| D | 7 | 80 | 1097712 | 6663.67 | 676 | 658 | 164.6 |
| D | 1 | 52 | 918580 | 5575.59 | 676 | 658 | 164.6 |
| D | 10 | 253 | 880011 | 5341.32 | 676 | 658 | 164.6 |
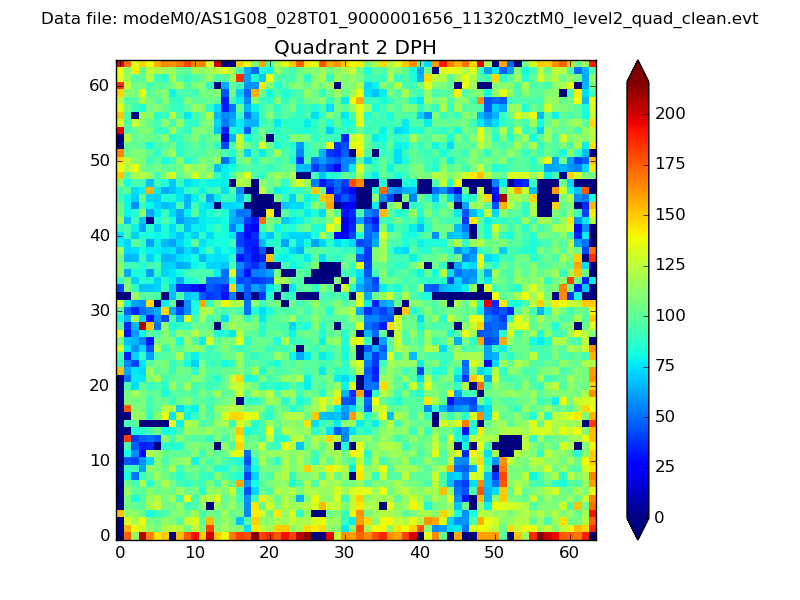
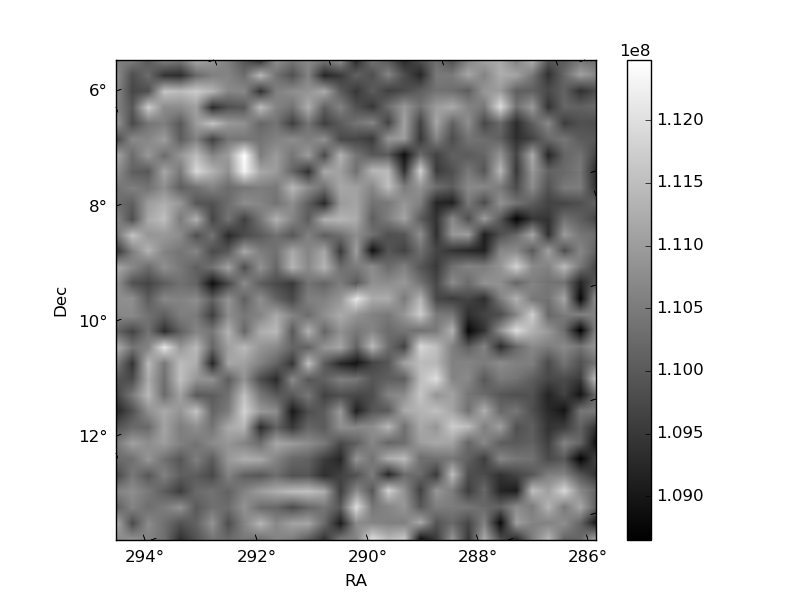
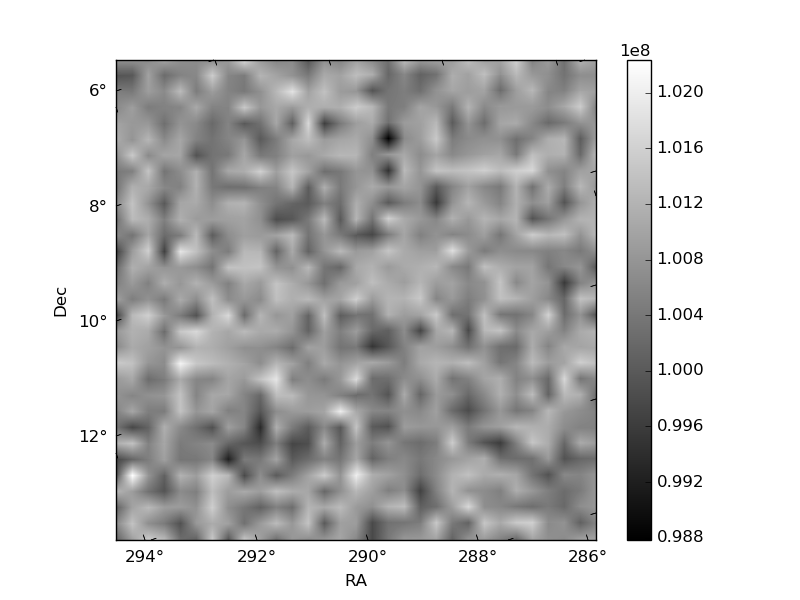
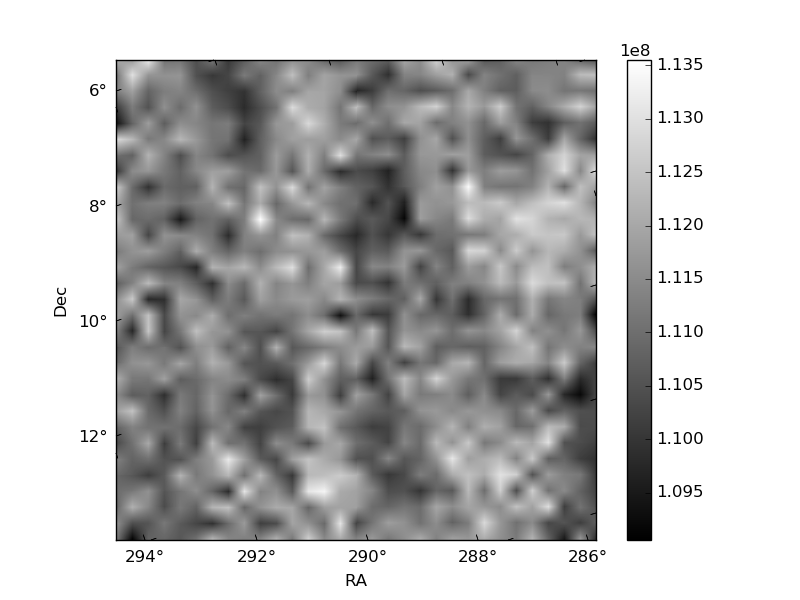
Histogram calculated using DETX and DETY for each event in the final _common_clean file
| Quadrant A | 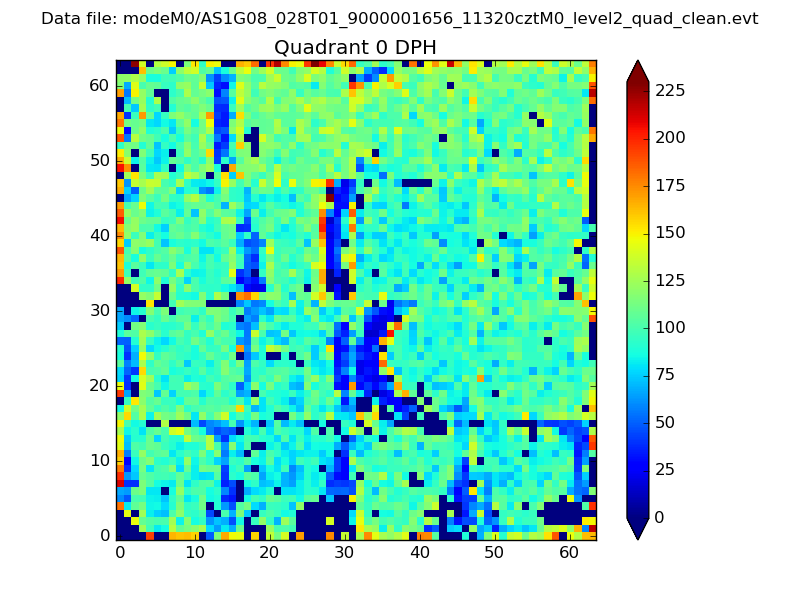 |
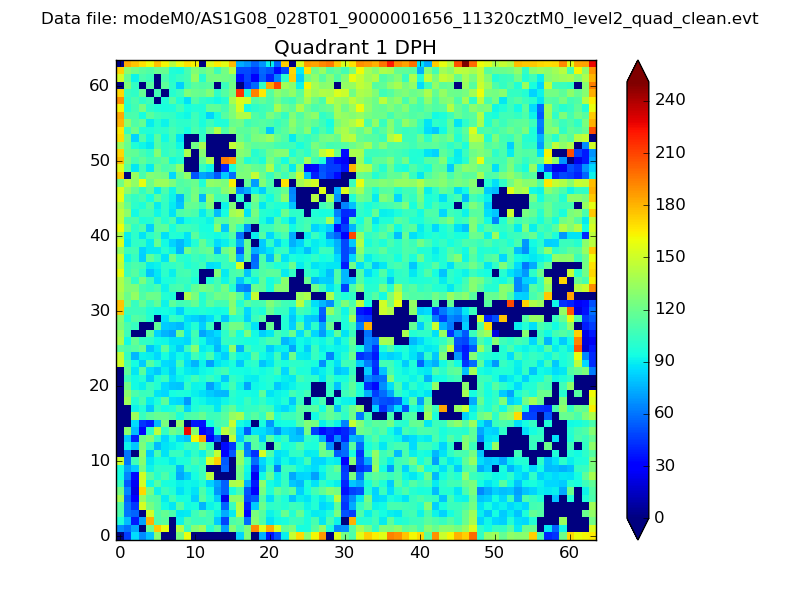 |
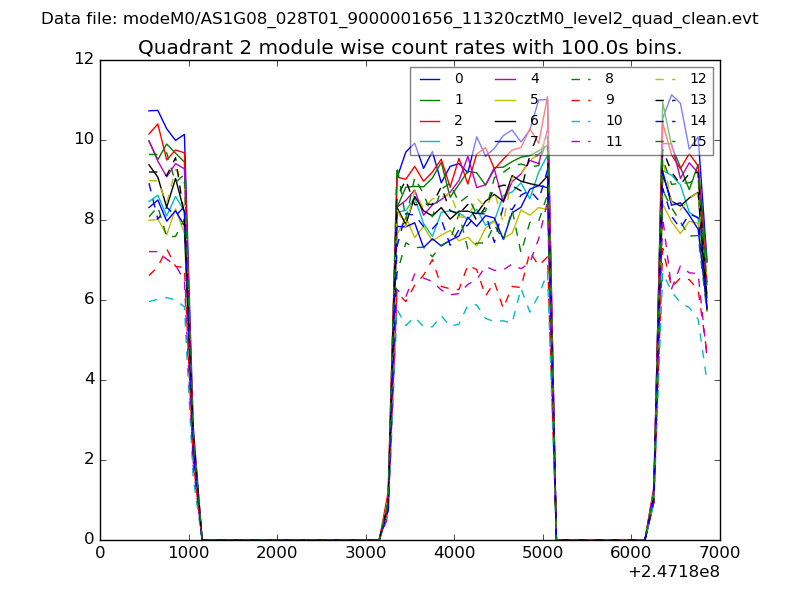
Quadrant B |
|---|---|---|---|
| Quadrant D | 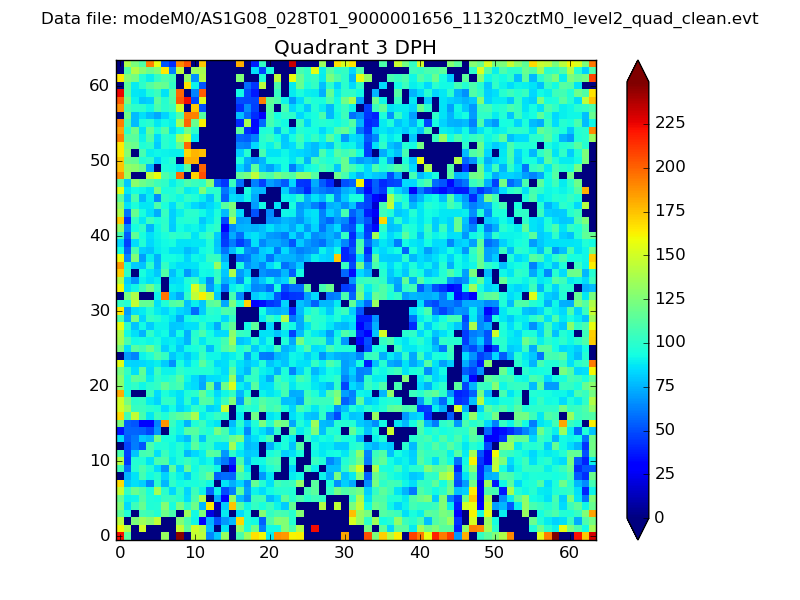 |
 |
Quadrant C |
| Plot type | Count rate plots | Images |
|---|---|---|
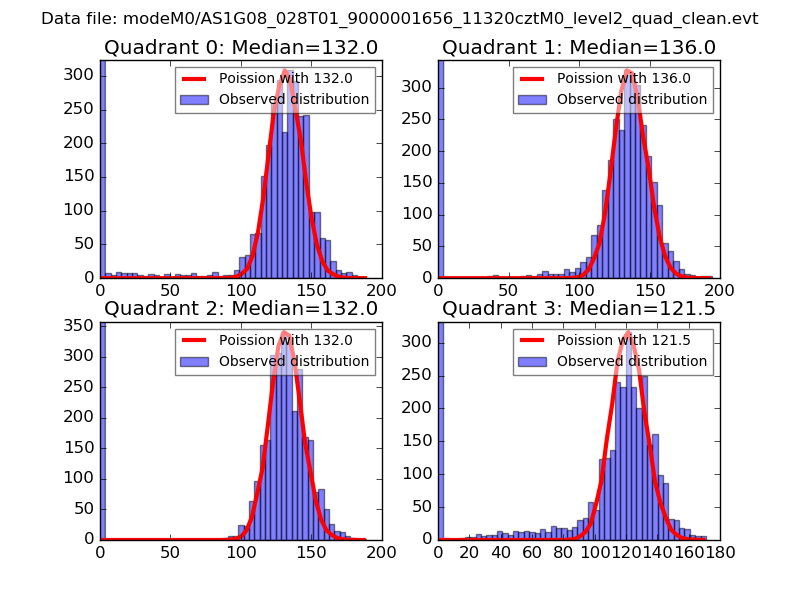
| Comparison with Poisson distribution Blue bars denote a histogram of data divided into 1 sec bins. Red curve is a Poisson curve with rate = median count rate of data. |
 |
 |
| Quadrant-wise count rates Data is divided into 100 sec bins |
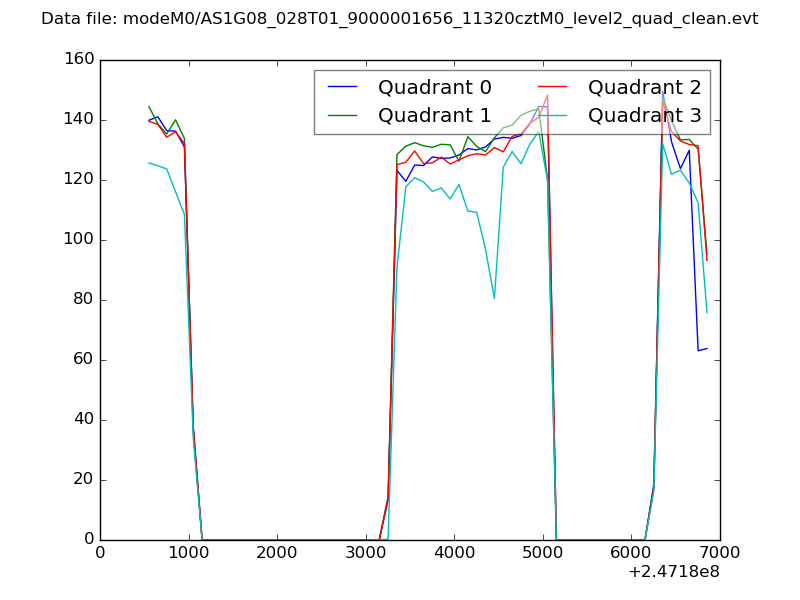 |
|
| Module-wise count rates for Quadrant A Data is divided into 100 sec bins |
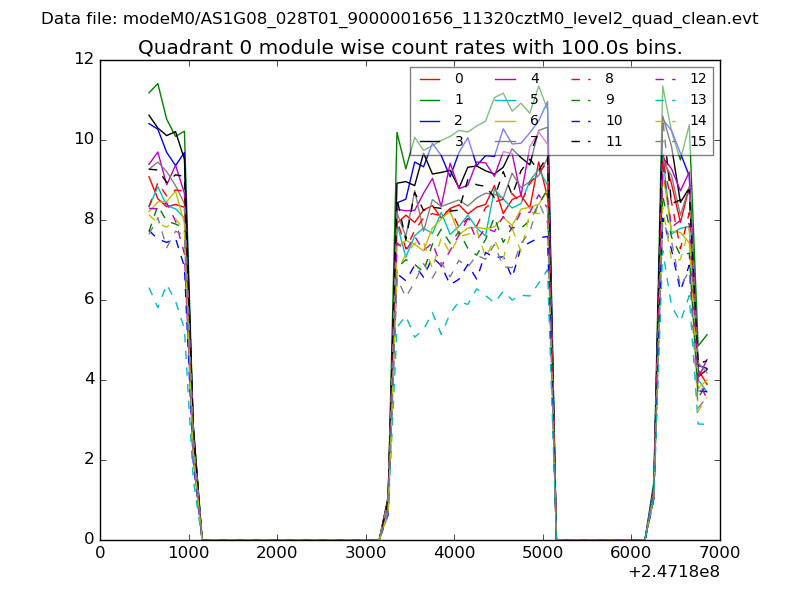 |
 |
| Module-wise count rates for Quadrant B Data is divided into 100 sec bins |
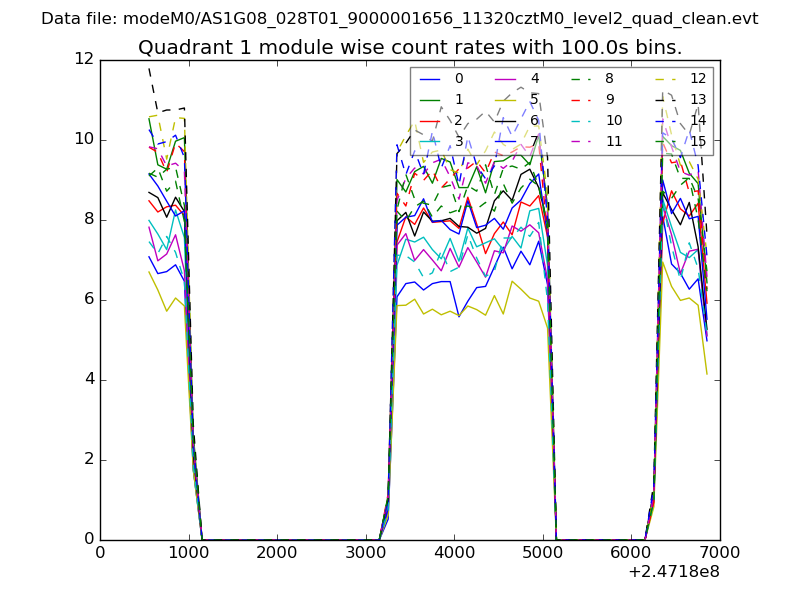 |
 |
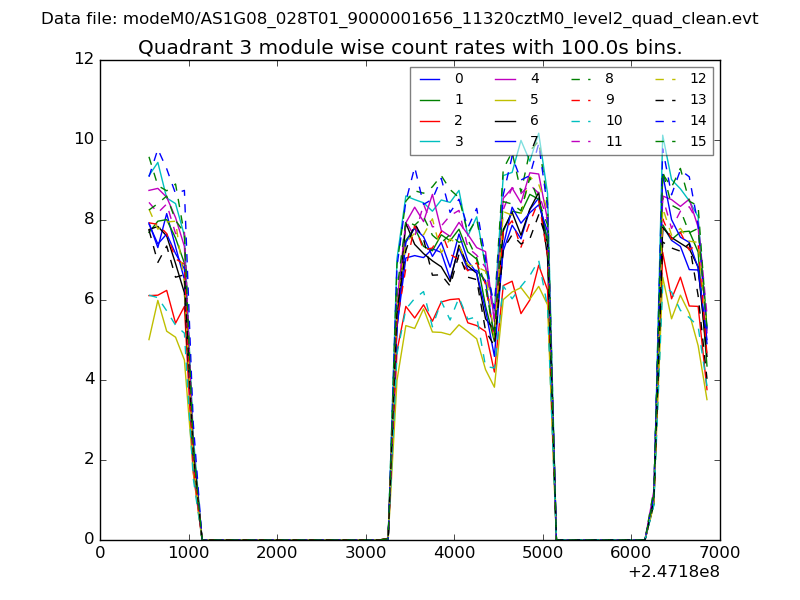
| Module-wise count rates for Quadrant C Data is divided into 100 sec bins |
 |
 |
| Module-wise count rates for Quadrant D Data is divided into 100 sec bins |
 |
 |
| Parameter | Plot |
|---|---|
| CZT HV Monitor | 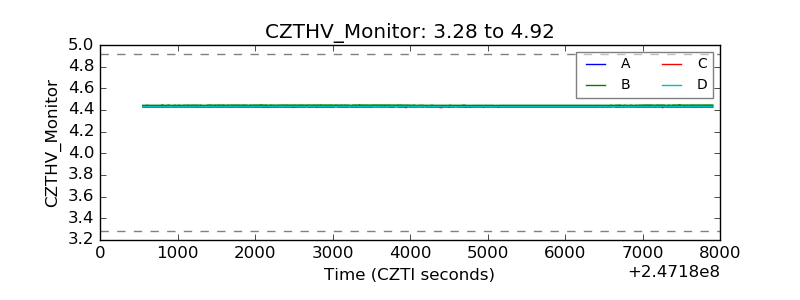 |
| D_VDD | 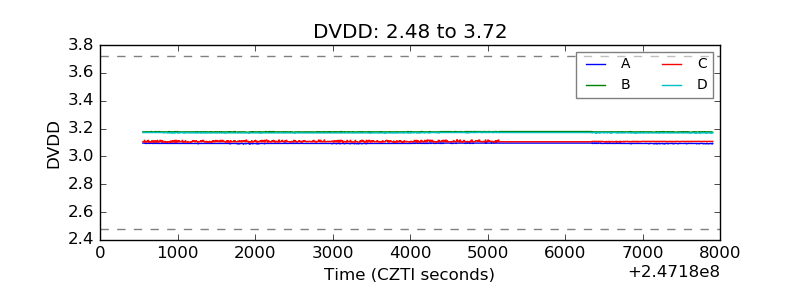 |
| Temperature 1 | 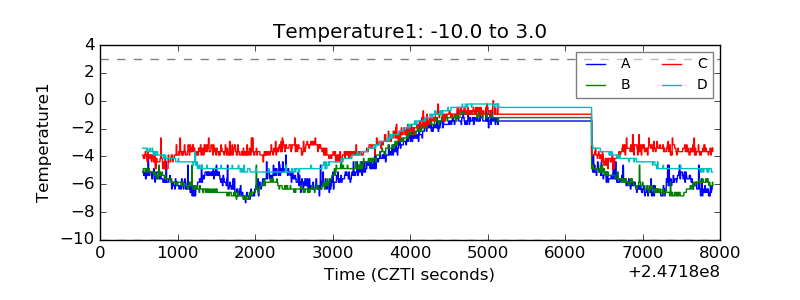 |
| Veto HV Monitor | 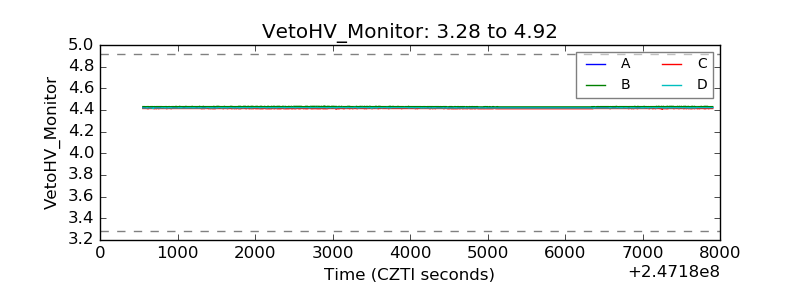 |
| Veto LLD | 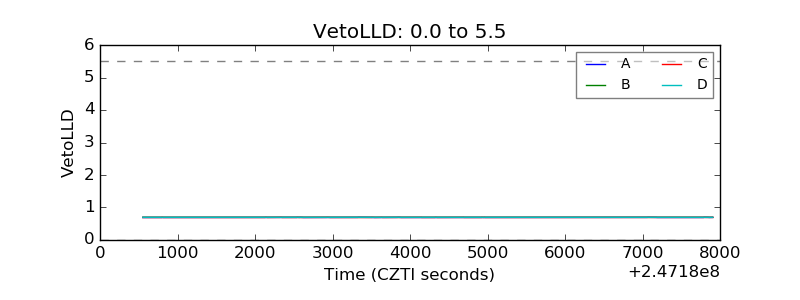 |
| Alpha Counter | 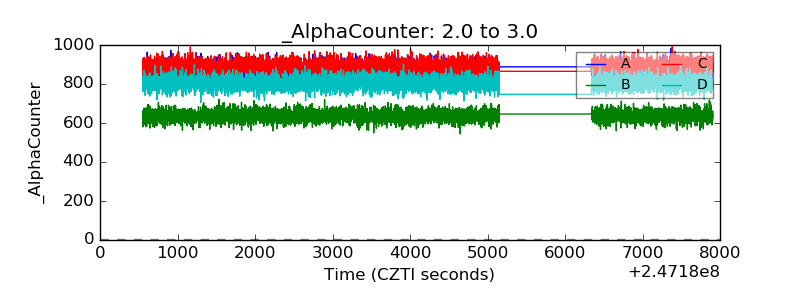 |
| _CPM_Rate | 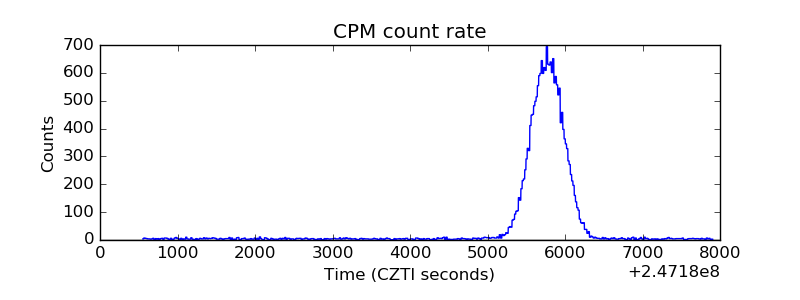 |
| CZT Counter | 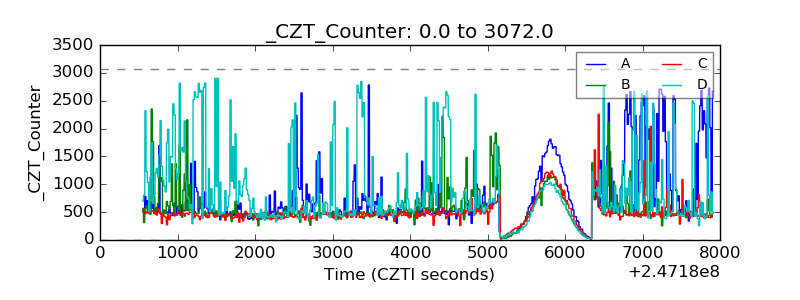 |
| +2.5 Volts monitor | 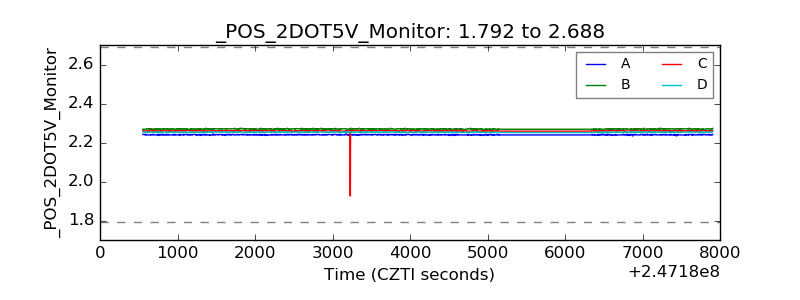 |
| +5 Volts monitor |  |
| _ROLL_ROT | 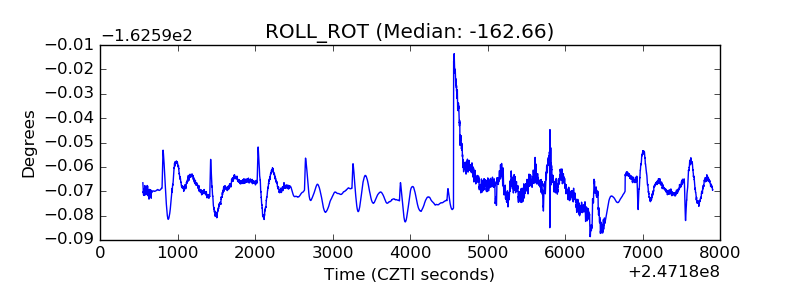 |
| _Roll_DEC | 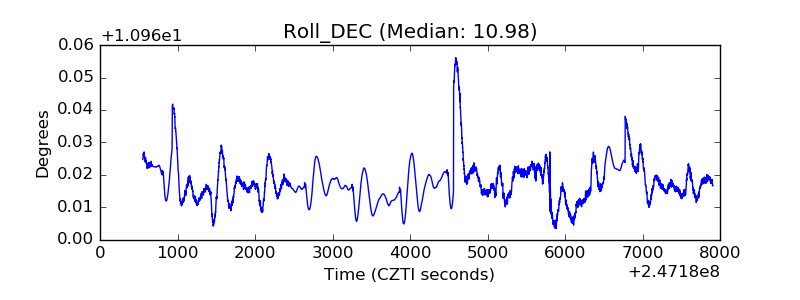 |
| _Roll_RA | 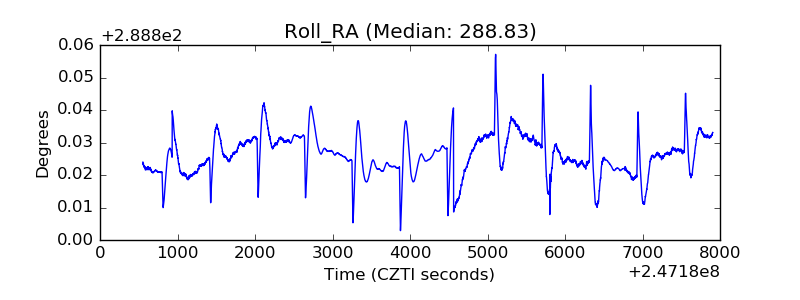 |
| Veto Counter | 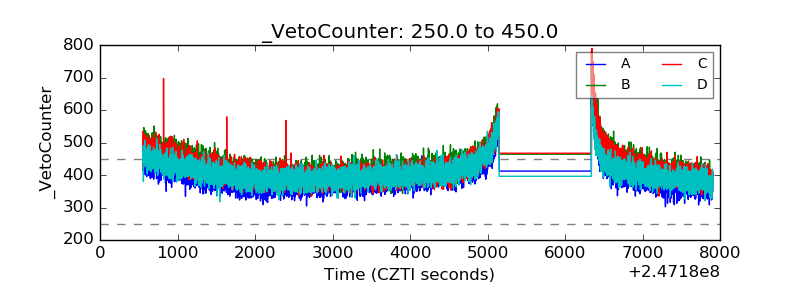 |