| Param | Original file | Final file |
|---|---|---|
| Filename | modeM0/AS1G08_028T01_9000001656_11321cztM0_level2.evt | modeM0/AS1G08_028T01_9000001656_11321cztM0_level2_quad_clean.evt |
| Size (bytes) | 661,397,760 | 57,994,560 |
| Size | 630.8 MB | 55.3 MB |
| Events in quadrant A | 7,574,195 | 299,537 |
| Events in quadrant B | 3,618,663 | 350,303 |
| Events in quadrant C | 3,174,308 | 345,274 |
| Events in quadrant D | 5,232,961 | 316,796 |
| Mode SS | |||
|---|---|---|---|
| Quadrant | BADHDUFLAG | Total packets | Discarded packets |
| A | 0 | 128 | 0 |
| B | 0 | 128 | 0 |
| C | 0 | 128 | 0 |
| D | 0 | 128 | 0 |
| Mode M0 | |||
|---|---|---|---|
| Quadrant | BADHDUFLAG | Total packets | Discarded packets |
| A | 0 | 26844 | 2 |
| B | 0 | 14793 | 1 |
| C | 0 | 13741 | 1 |
| D | 0 | 19845 | 1 |
| Mode M9 | |||
|---|---|---|---|
| Quadrant | BADHDUFLAG | Total packets | Discarded packets |
| A | 0 | 9 | 0 |
| B | 0 | 9 | 0 |
| C | 0 | 9 | 0 |
| D | 0 | 9 | 0 |
| Quadrant | Total seconds | Saturated seconds | Saturation percentage |
|---|---|---|---|
| A | 6358 | 1899 | 29.867883% |
| B | 6358 | 182 | 2.862535% |
| C | 6358 | 64 | 1.006606% |
| D | 6358 | 733 | 11.528783% |
Noise dominated data is calculated using 1-second bins in cleaned event files. If a bin has >2000 counts, and if more than 50% of those come from <1% of pixels, then it is considered to be noise-dominated and hence unusable.
| Quadrant | # 1 sec bins | Bins with >0 counts | Bins with >2000 counts | High rate bins dominated by noise | Noise dominated (total time) | Noise dominated (detector-on time) | Marked lightcurve |
|---|---|---|---|---|---|---|---|
| A | 7228 | 6358 | 1218 | 1218 | 16.85% | 19.16% | 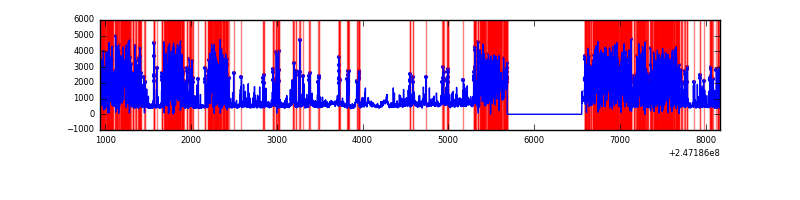 |
| B | 7228 | 6359 | 71 | 71 | 0.98% | 1.12% | 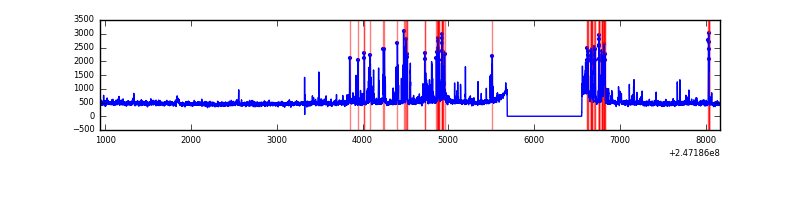 |
| C | 7228 | 6359 | 32 | 32 | 0.44% | 0.50% | 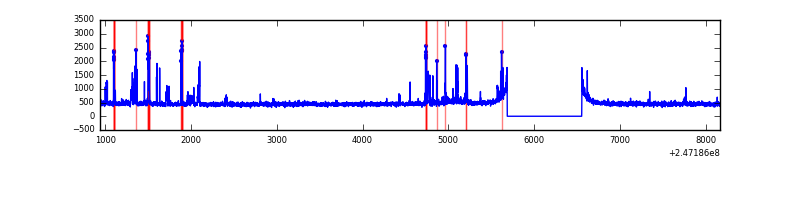 |
| D | 7228 | 6359 | 603 | 603 | 8.34% | 9.48% | 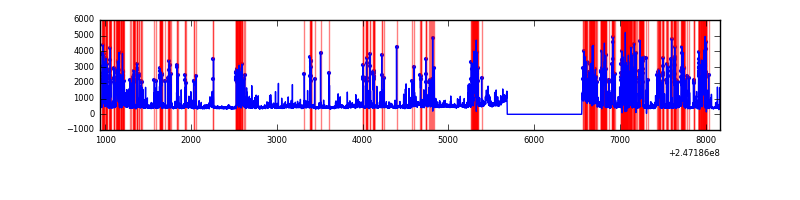 |
Top three noisy pixels from each quadrant. If the there are fewer than three noisy pixels in the level2.evt file, extra rows are filled as -1
| Pixel properties | Quadrant properties | ||||||
|---|---|---|---|---|---|---|---|
| Quadrant | DetID | PixID | Counts | Sigma | Mean | Median | Sigma |
| A | 14 | 238 | 4169544 | 32838.87 | 614 | 602 | 127.0 |
| A | 8 | 5 | 581995 | 4579.65 | 614 | 602 | 127.0 |
| A | 1 | 162 | 105429 | 825.73 | 614 | 602 | 127.0 |
| B | 4 | 239 | 535484 | 3675.99 | 760 | 743 | 145.5 |
| B | 0 | 219 | 29278 | 196.16 | 760 | 743 | 145.5 |
| B | 0 | 214 | 23098 | 153.67 | 760 | 743 | 145.5 |
| C | 9 | 204 | 277582 | 1599.83 | 737 | 742 | 173.0 |
| C | 9 | 54 | 21441 | 119.62 | 737 | 742 | 173.0 |
| C | 13 | 61 | 5595 | 28.05 | 737 | 742 | 173.0 |
| D | 10 | 253 | 1334168 | 7981.23 | 686 | 668 | 167.1 |
| D | 7 | 80 | 452564 | 2704.68 | 686 | 668 | 167.1 |
| D | 2 | 120 | 375356 | 2242.57 | 686 | 668 | 167.1 |
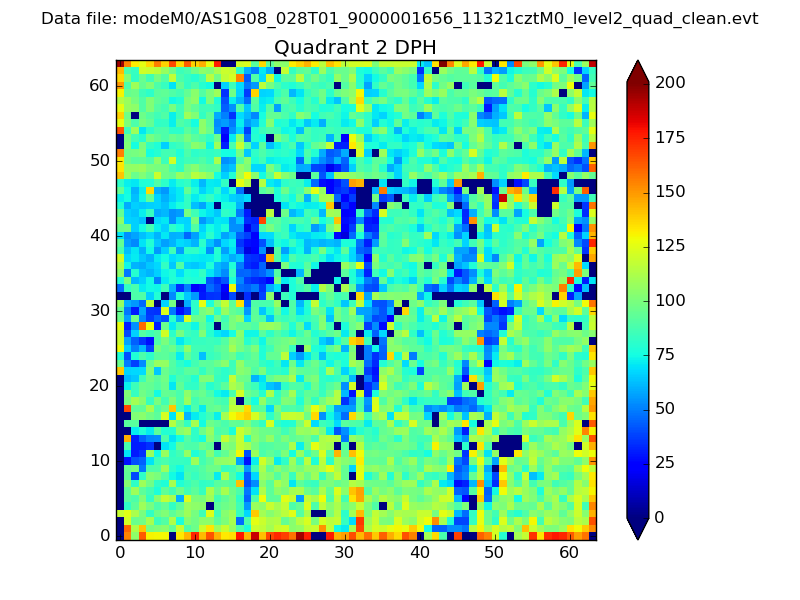
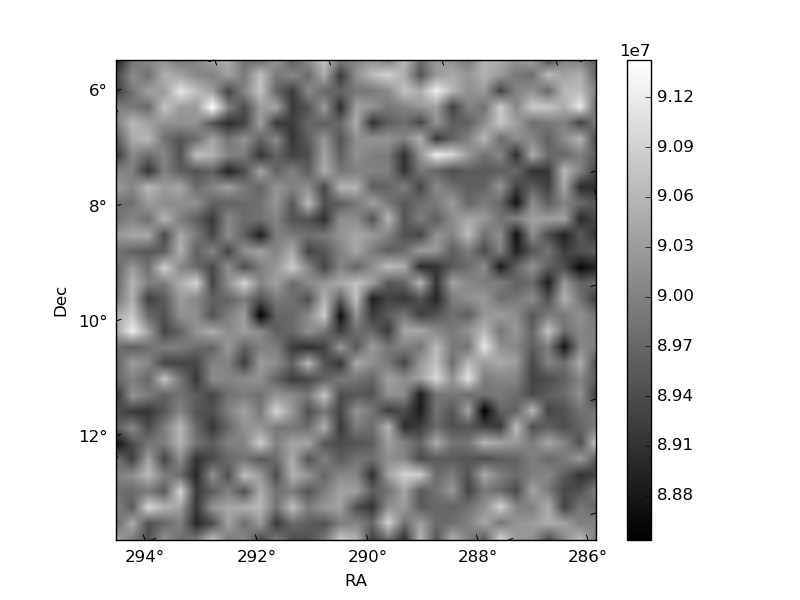
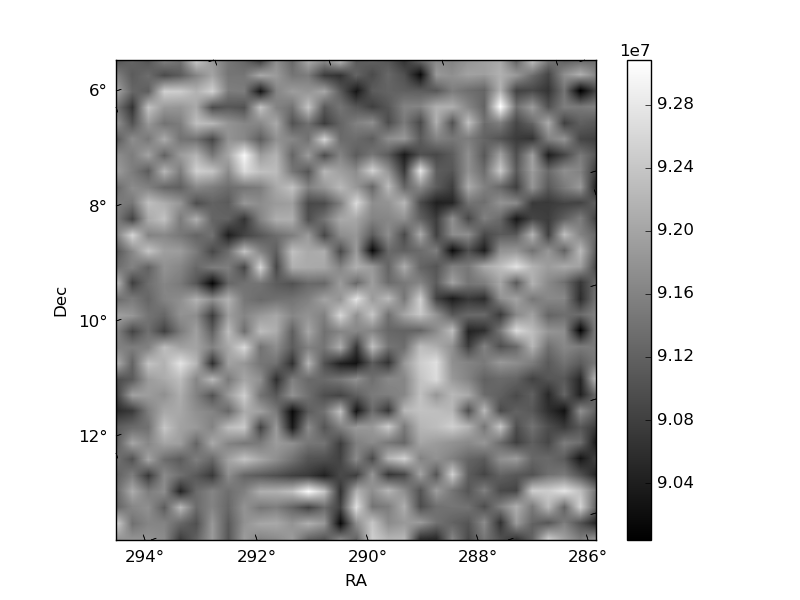
Histogram calculated using DETX and DETY for each event in the final _common_clean file
| Quadrant A | 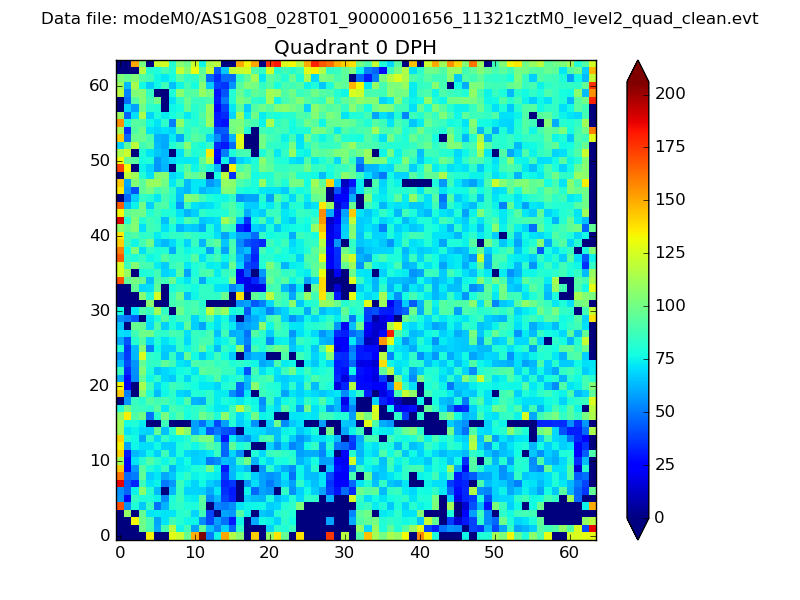 |
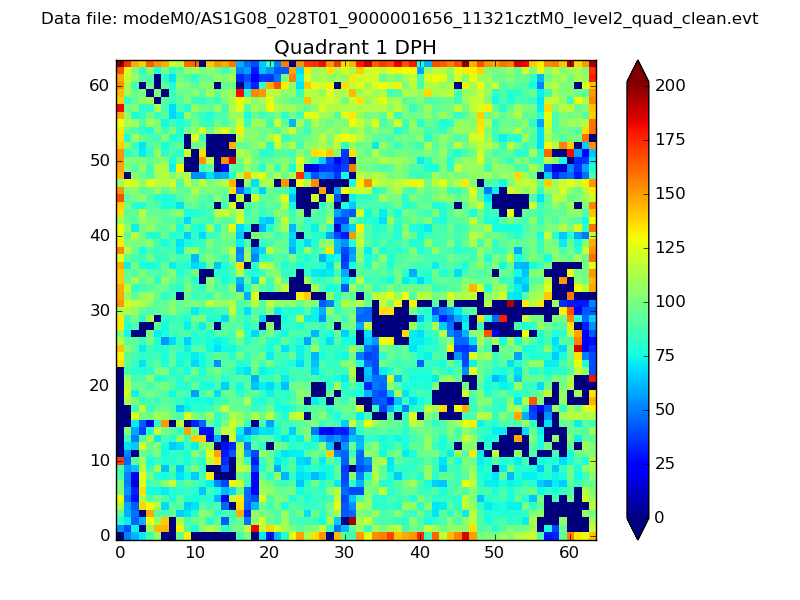 |
Quadrant B |
|---|---|---|---|
| Quadrant D | 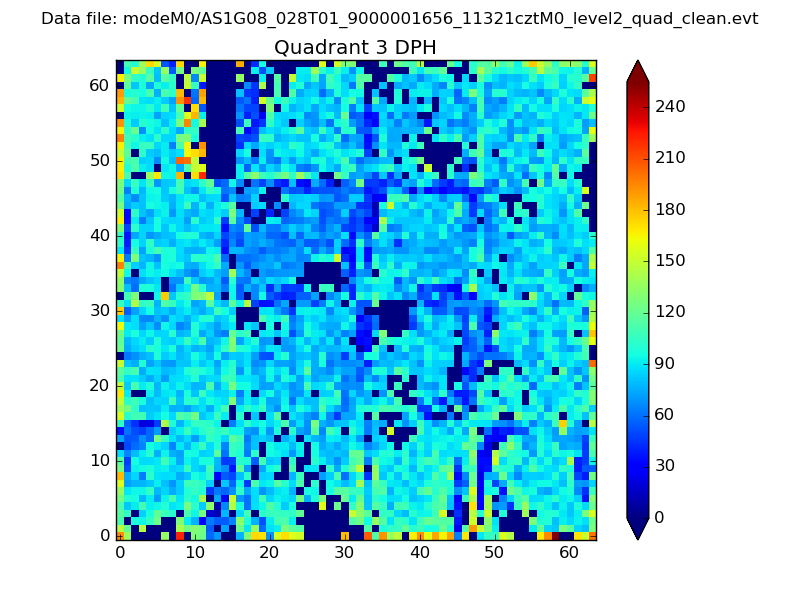 |
 |
Quadrant C |
| Plot type | Count rate plots | Images |
|---|---|---|
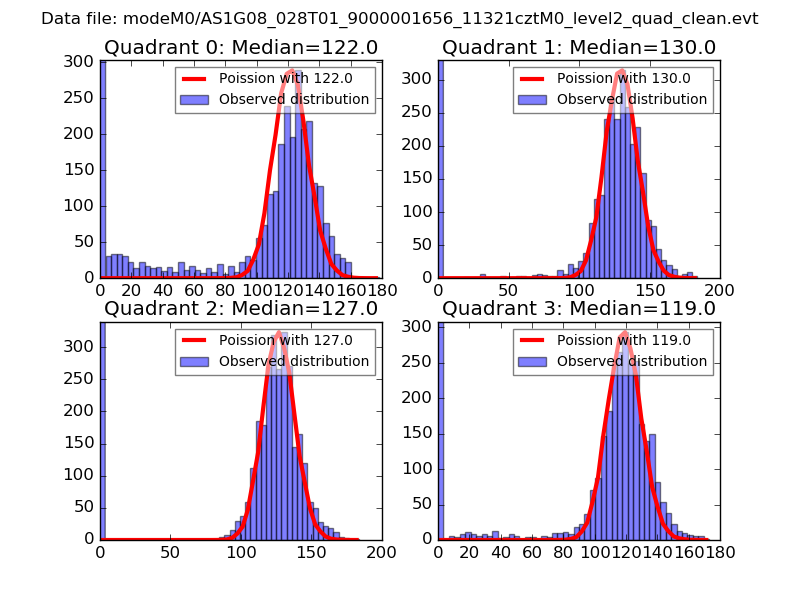
| Comparison with Poisson distribution Blue bars denote a histogram of data divided into 1 sec bins. Red curve is a Poisson curve with rate = median count rate of data. |
 |
 |
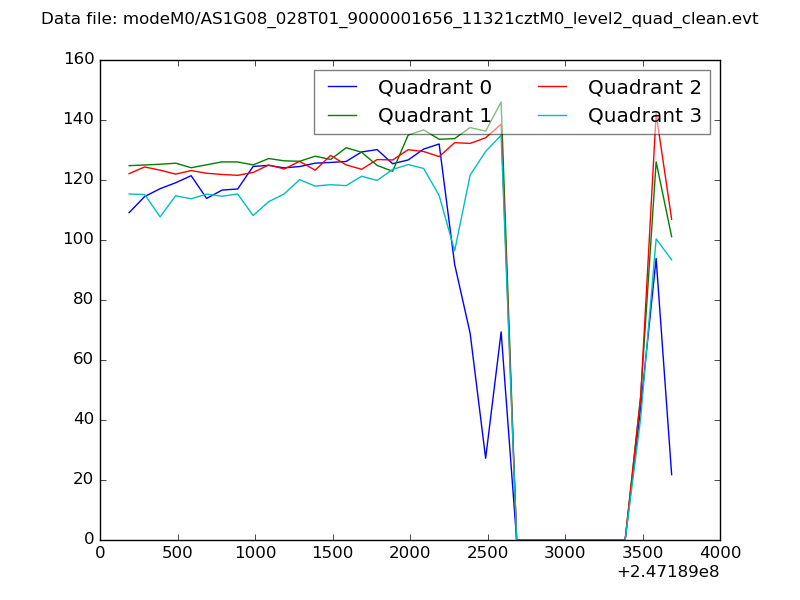
| Quadrant-wise count rates Data is divided into 100 sec bins |
 |
|
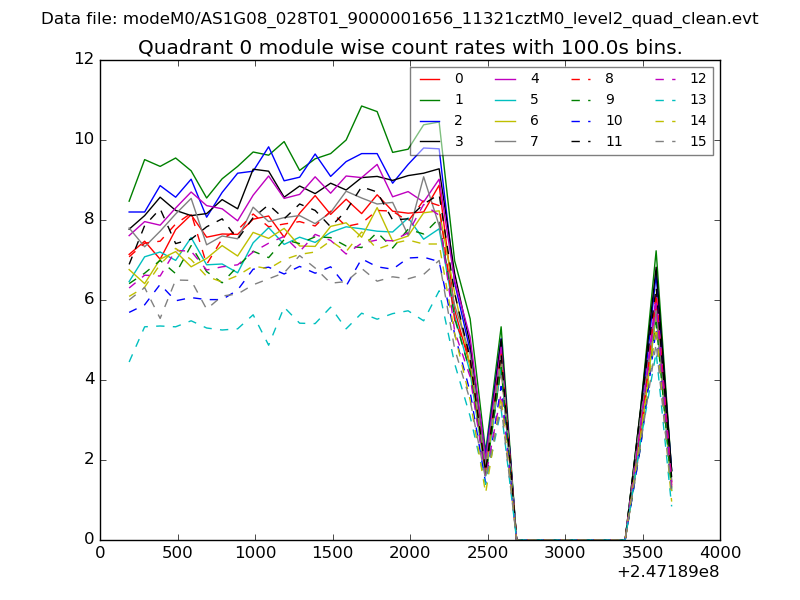
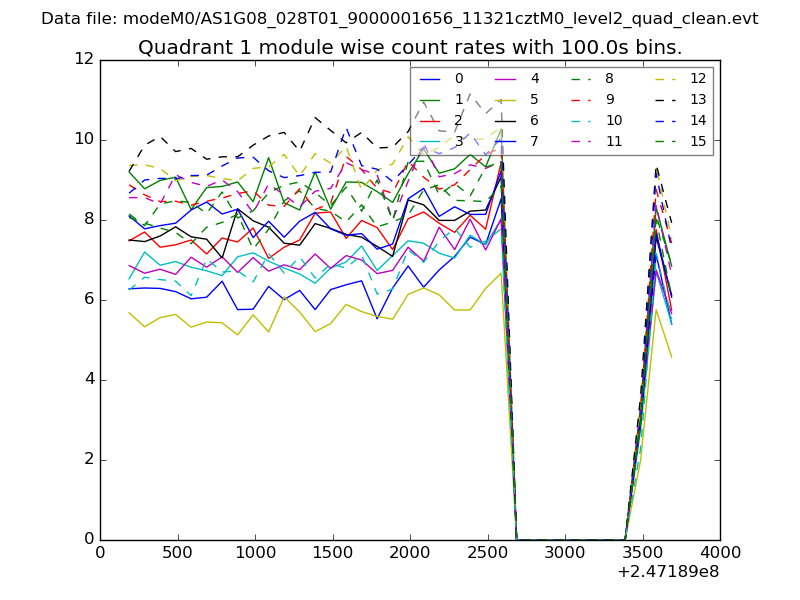
| Module-wise count rates for Quadrant A Data is divided into 100 sec bins |
 |
 |
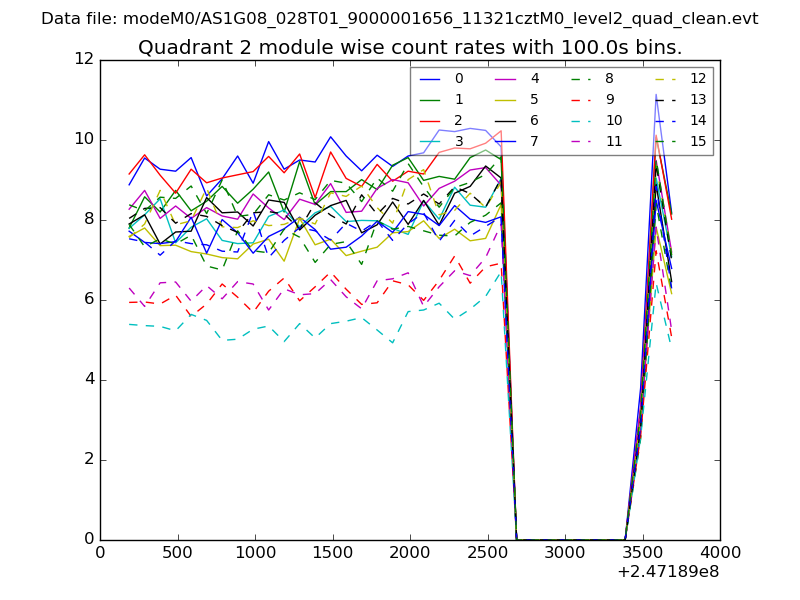
| Module-wise count rates for Quadrant B Data is divided into 100 sec bins |
 |
 |
| Module-wise count rates for Quadrant C Data is divided into 100 sec bins |
 |
 |
| Module-wise count rates for Quadrant D Data is divided into 100 sec bins |
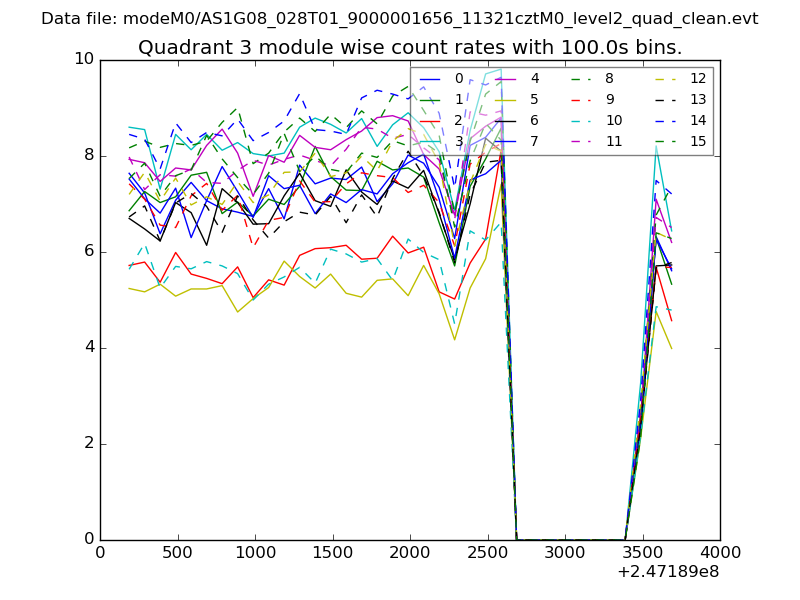 |
 |
| Parameter | Plot |
|---|---|
| CZT HV Monitor | 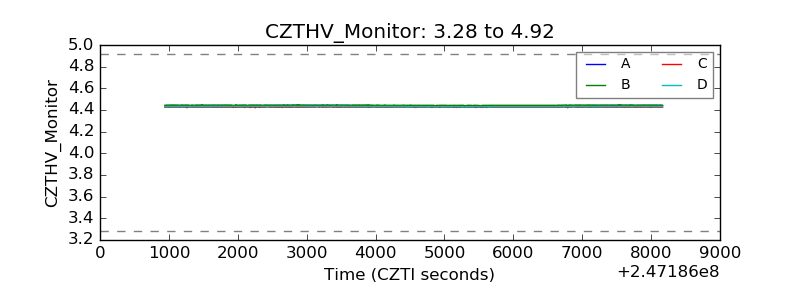 |
| D_VDD | 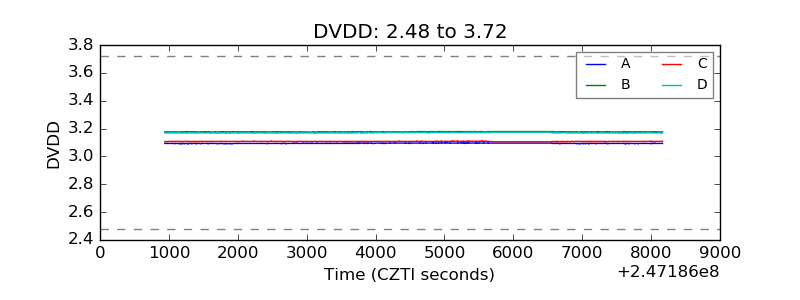 |
| Temperature 1 | 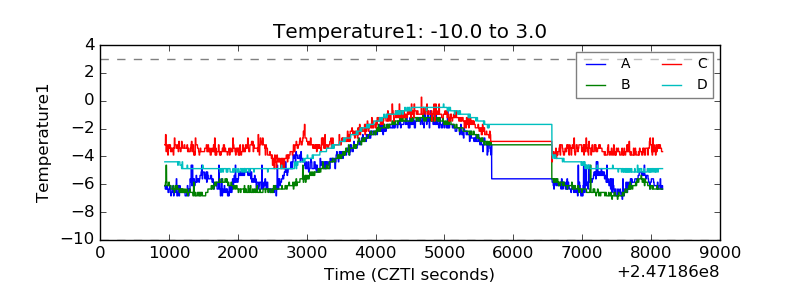 |
| Veto HV Monitor | 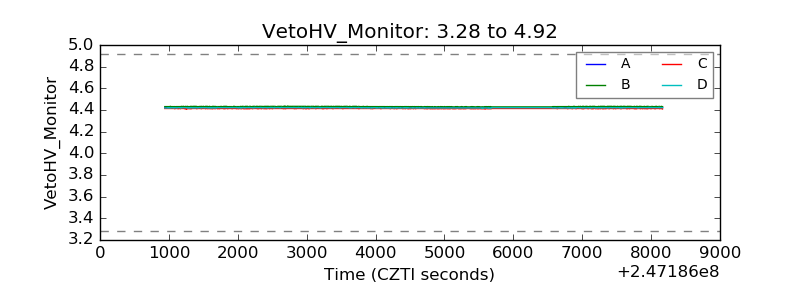 |
| Veto LLD | 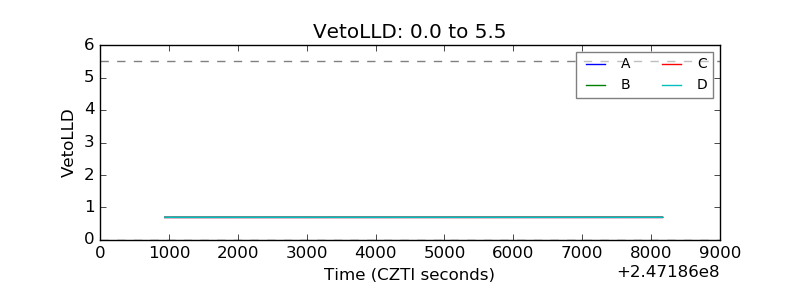 |
| Alpha Counter | 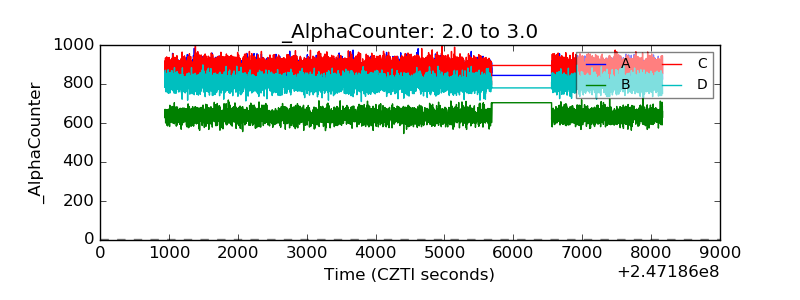 |
| _CPM_Rate | 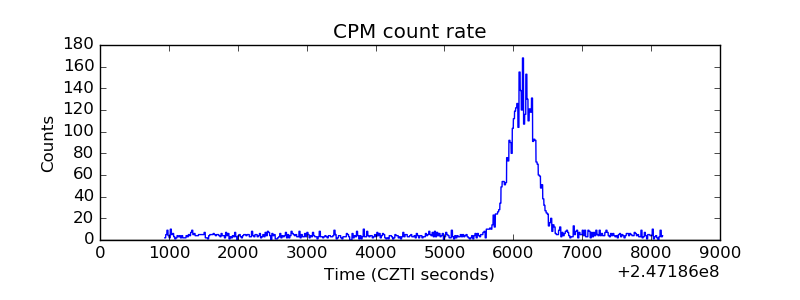 |
| CZT Counter | 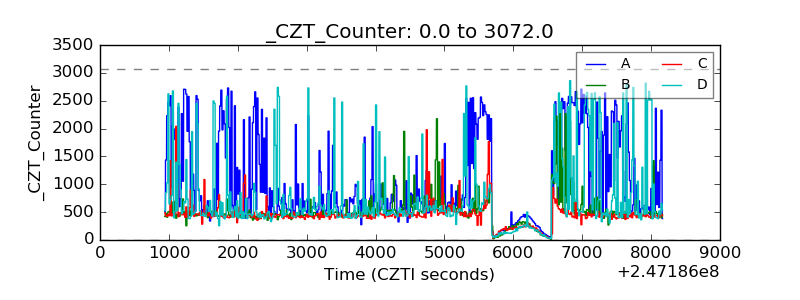 |
| +2.5 Volts monitor |  |
| +5 Volts monitor |  |
| _ROLL_ROT | 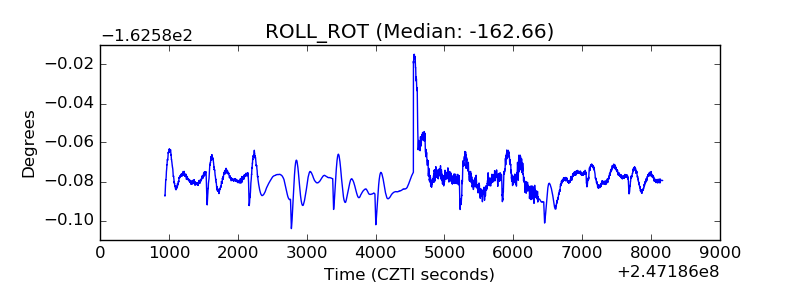 |
| _Roll_DEC | 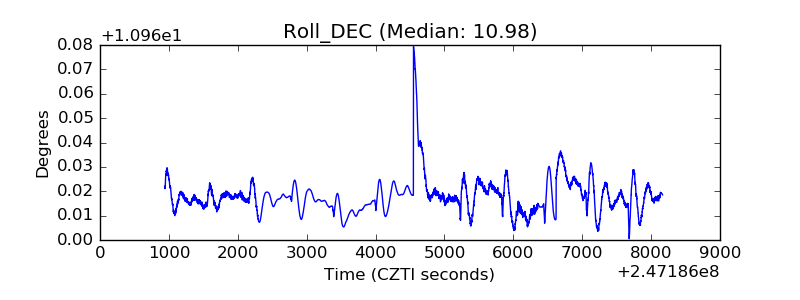 |
| _Roll_RA | 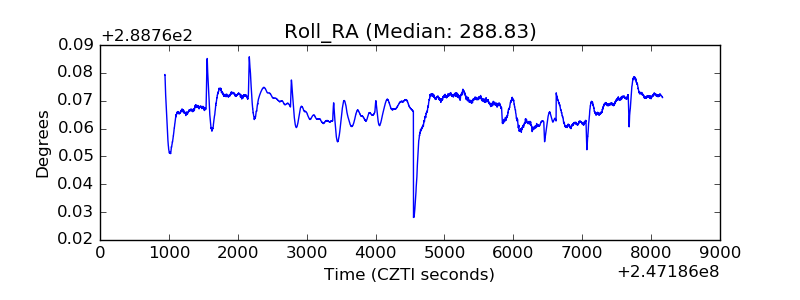 |
| Veto Counter | 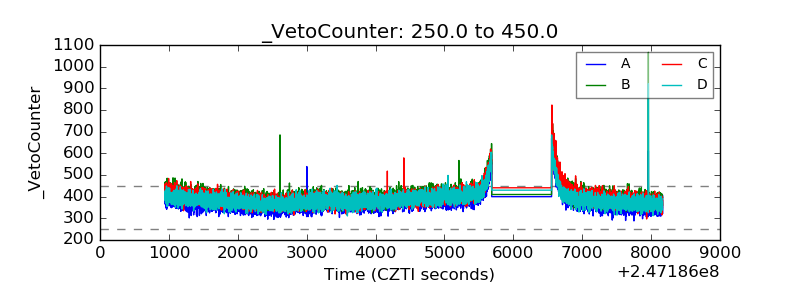 |