| Param | Original file | Final file |
|---|---|---|
| Filename | modeM0/AS1G08_028T01_9000001656_11322cztM0_level2.evt | modeM0/AS1G08_028T01_9000001656_11322cztM0_level2_quad_clean.evt |
| Size (bytes) | 745,511,040 | 72,267,840 |
| Size | 711.0 MB | 68.9 MB |
| Events in quadrant A | 7,715,815 | 397,071 |
| Events in quadrant B | 4,718,541 | 435,344 |
| Events in quadrant C | 3,575,291 | 441,547 |
| Events in quadrant D | 6,073,452 | 404,748 |
| Mode SS | |||
|---|---|---|---|
| Quadrant | BADHDUFLAG | Total packets | Discarded packets |
| A | 0 | 148 | 0 |
| B | 0 | 148 | 0 |
| C | 0 | 148 | 0 |
| D | 0 | 148 | 0 |
| Mode M0 | |||
|---|---|---|---|
| Quadrant | BADHDUFLAG | Total packets | Discarded packets |
| A | 0 | 27656 | 3 |
| B | 0 | 18812 | 2 |
| C | 0 | 15695 | 2 |
| D | 0 | 23008 | 2 |
| Mode M9 | |||
|---|---|---|---|
| Quadrant | BADHDUFLAG | Total packets | Discarded packets |
| A | 0 | 6 | 0 |
| B | 0 | 6 | 0 |
| C | 0 | 6 | 0 |
| D | 0 | 7 | 0 |
| Quadrant | Total seconds | Saturated seconds | Saturation percentage |
|---|---|---|---|
| A | 7311 | 1972 | 26.973054% |
| B | 7311 | 465 | 6.360279% |
| C | 7311 | 136 | 1.860211% |
| D | 7311 | 848 | 11.598960% |
Noise dominated data is calculated using 1-second bins in cleaned event files. If a bin has >2000 counts, and if more than 50% of those come from <1% of pixels, then it is considered to be noise-dominated and hence unusable.
| Quadrant | # 1 sec bins | Bins with >0 counts | Bins with >2000 counts | High rate bins dominated by noise | Noise dominated (total time) | Noise dominated (detector-on time) | Marked lightcurve |
|---|---|---|---|---|---|---|---|
| A | 7691 | 7312 | 1134 | 1134 | 14.74% | 15.51% | 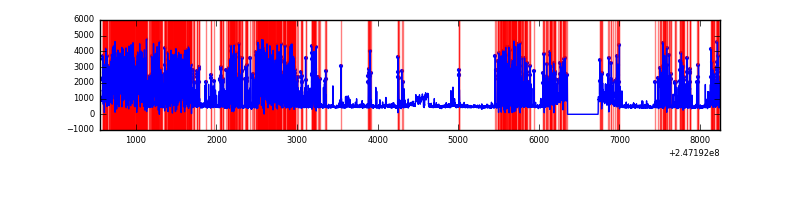 |
| B | 7691 | 7312 | 171 | 171 | 2.22% | 2.34% | 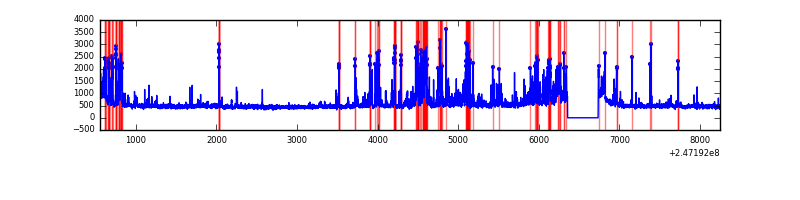 |
| C | 7691 | 7312 | 36 | 36 | 0.47% | 0.49% | 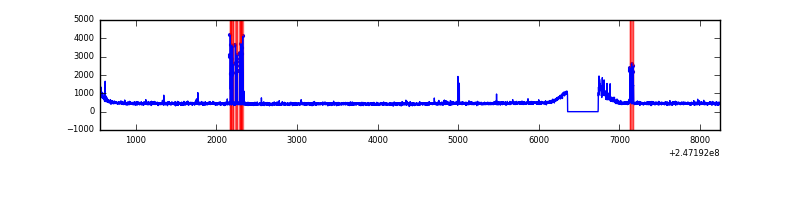 |
| D | 7691 | 7312 | 611 | 611 | 7.94% | 8.36% | 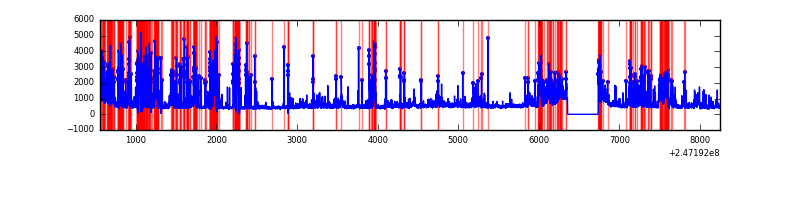 |
Top three noisy pixels from each quadrant. If the there are fewer than three noisy pixels in the level2.evt file, extra rows are filled as -1
| Pixel properties | Quadrant properties | ||||||
|---|---|---|---|---|---|---|---|
| Quadrant | DetID | PixID | Counts | Sigma | Mean | Median | Sigma |
| A | 14 | 238 | 4360405 | 27976.47 | 750 | 735 | 155.8 |
| A | 8 | 5 | 119157 | 759.93 | 750 | 735 | 155.8 |
| A | 15 | 174 | 103381 | 658.69 | 750 | 735 | 155.8 |
| B | 4 | 239 | 769899 | 4488.22 | 879 | 855 | 171.3 |
| B | 3 | 64 | 203512 | 1182.73 | 879 | 855 | 171.3 |
| B | 0 | 168 | 109980 | 636.86 | 879 | 855 | 171.3 |
| C | 9 | 204 | 200717 | 981.35 | 864 | 867 | 203.6 |
| C | 13 | 61 | 6366 | 27.0 | 864 | 867 | 203.6 |
| C | 9 | 54 | 5028 | 20.43 | 864 | 867 | 203.6 |
| D | 10 | 253 | 1286825 | 6591.92 | 802 | 780 | 195.1 |
| D | 7 | 80 | 551934 | 2825.07 | 802 | 780 | 195.1 |
| D | 2 | 120 | 443772 | 2270.66 | 802 | 780 | 195.1 |
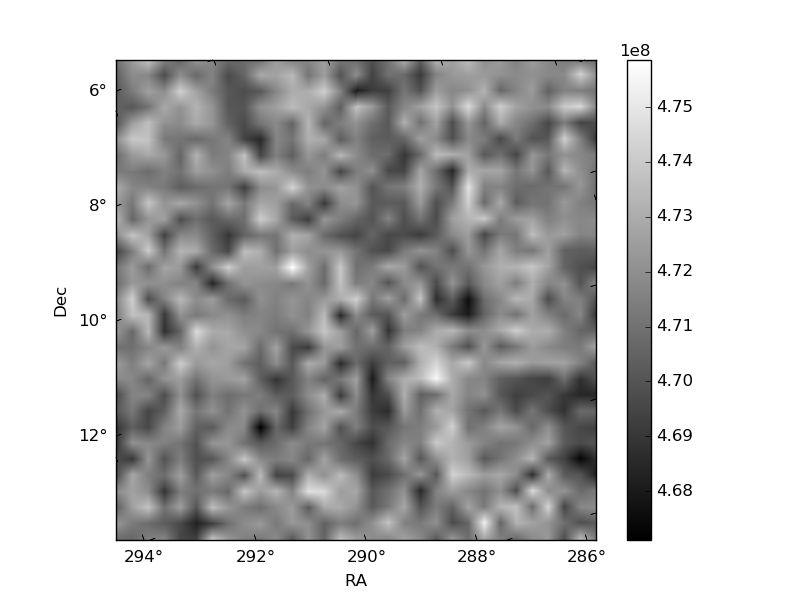
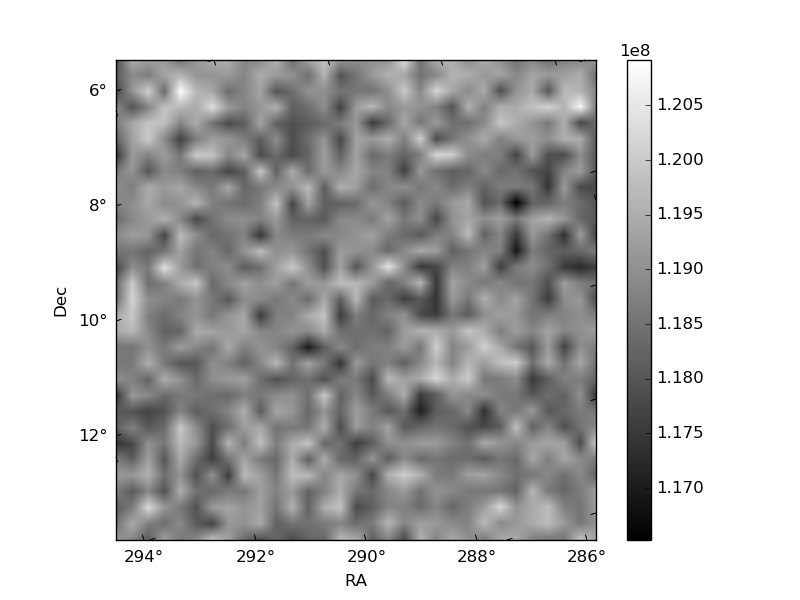
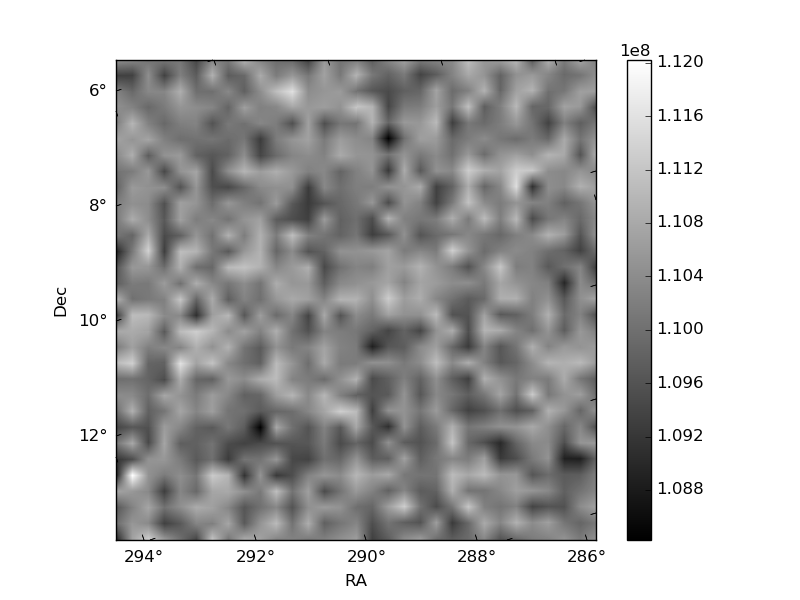
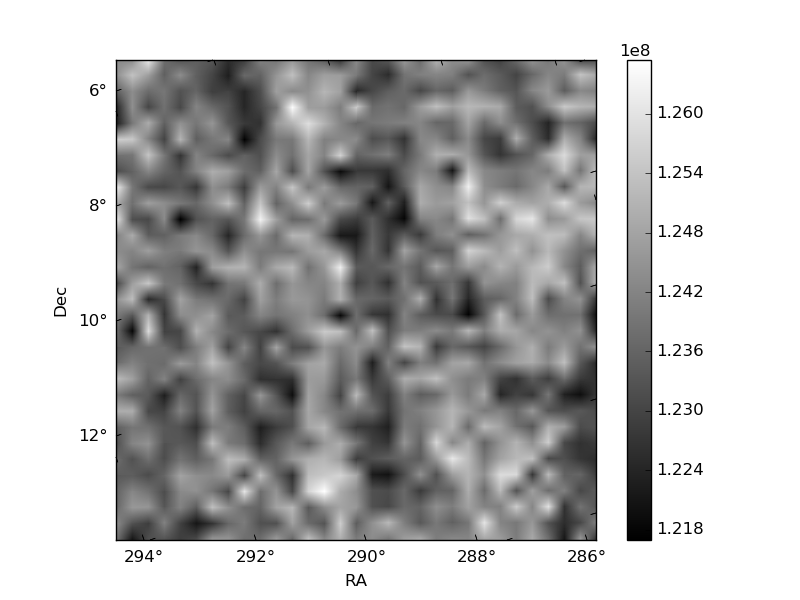
Histogram calculated using DETX and DETY for each event in the final _common_clean file
| Quadrant A | 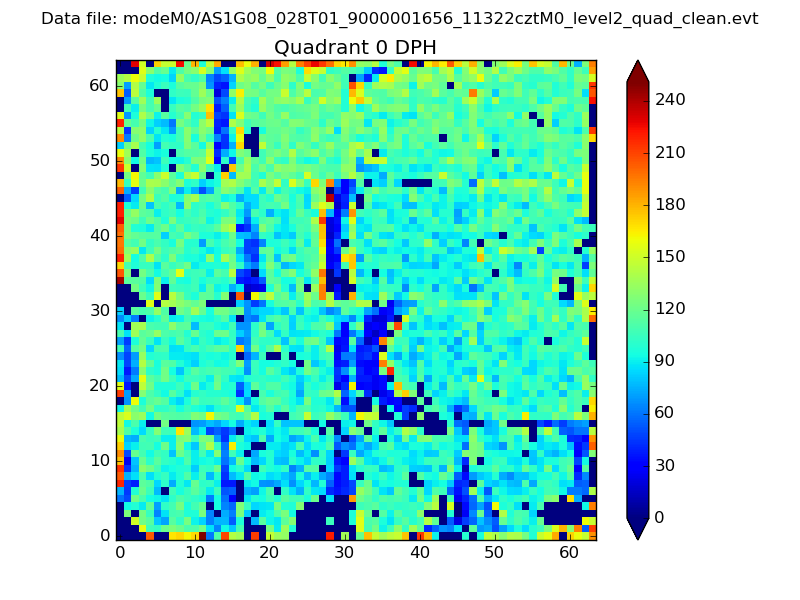 |
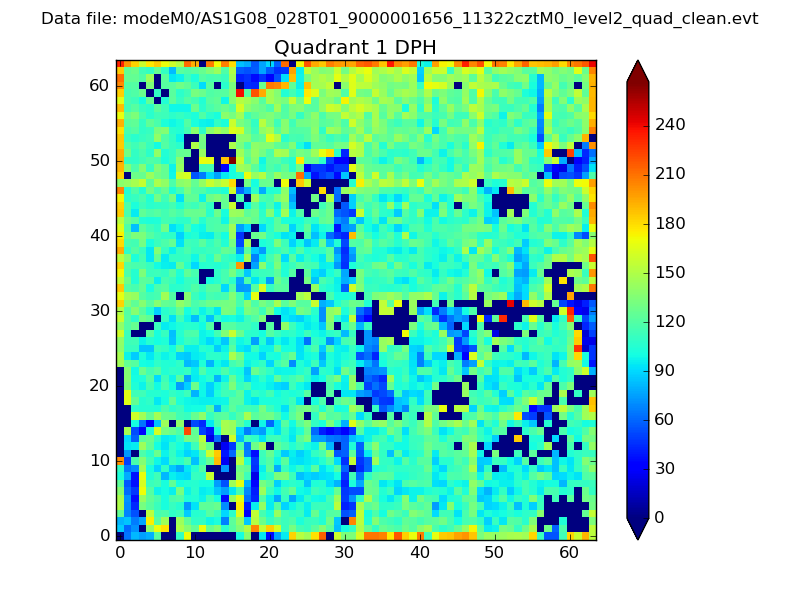 |
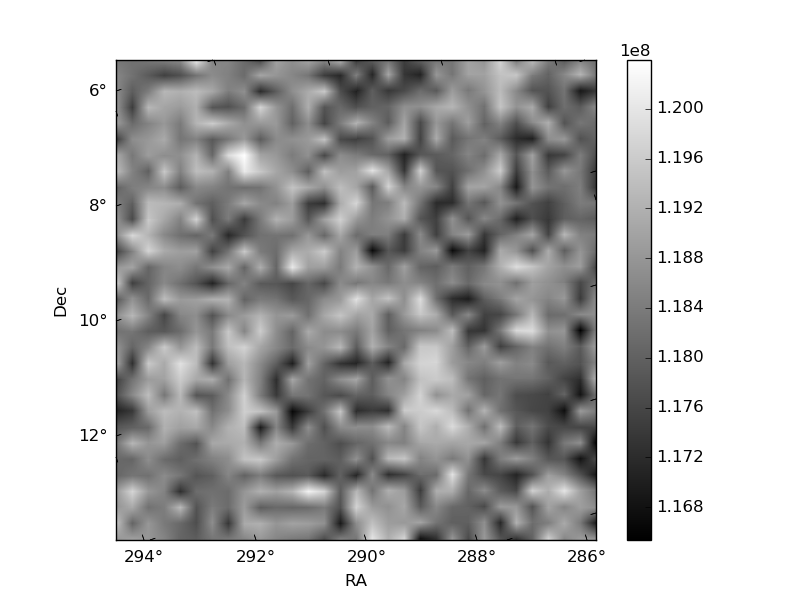
Quadrant B |
|---|---|---|---|
| Quadrant D | 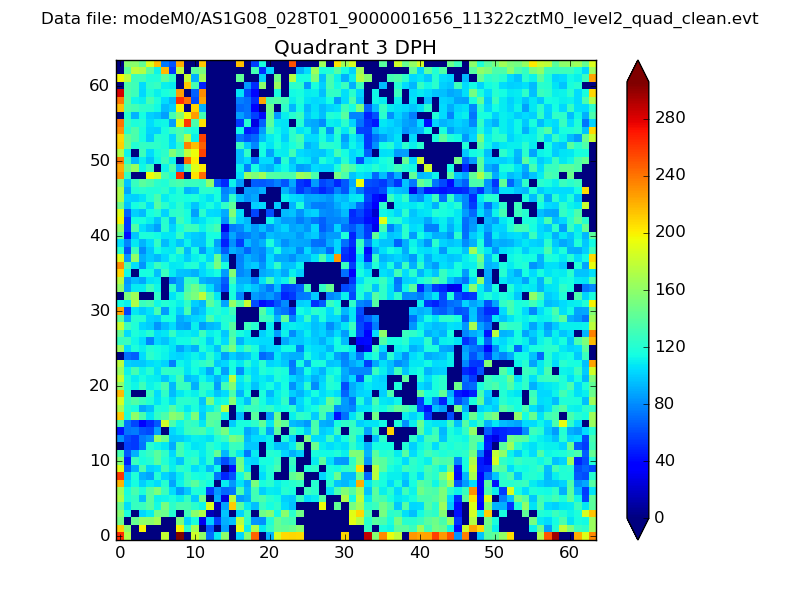 |
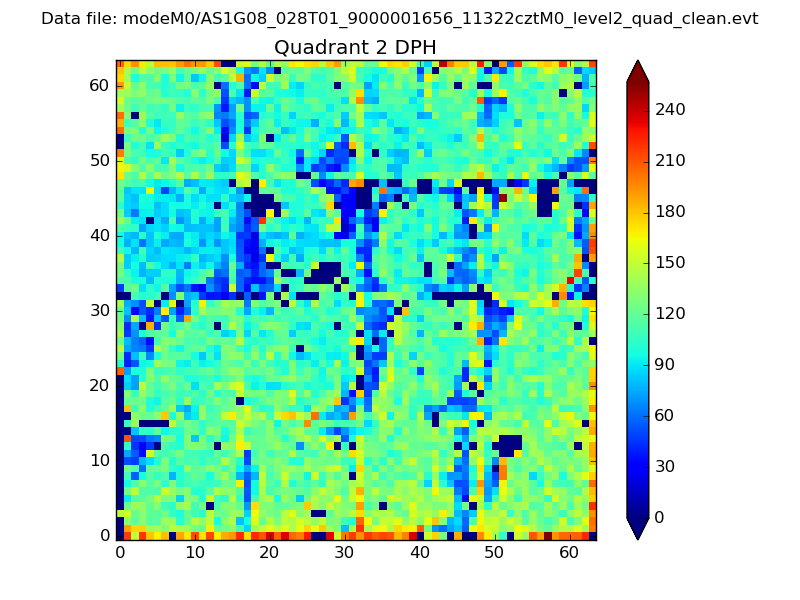 |
Quadrant C |
| Plot type | Count rate plots | Images |
|---|---|---|
| Comparison with Poisson distribution Blue bars denote a histogram of data divided into 1 sec bins. Red curve is a Poisson curve with rate = median count rate of data. |
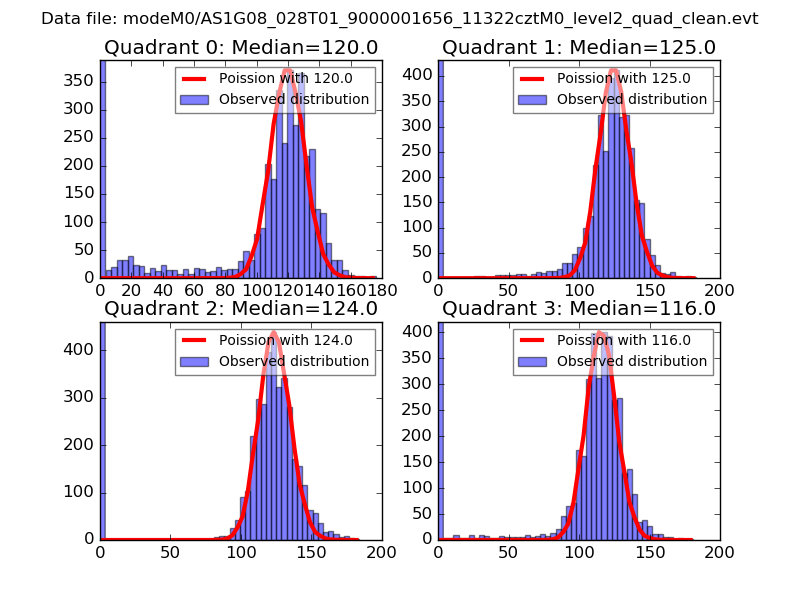 |
 |
| Quadrant-wise count rates Data is divided into 100 sec bins |
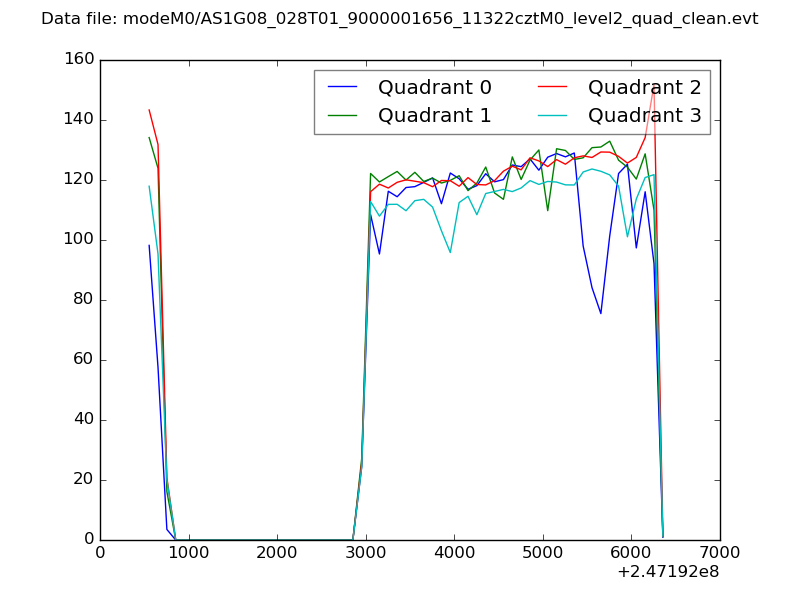 |
|
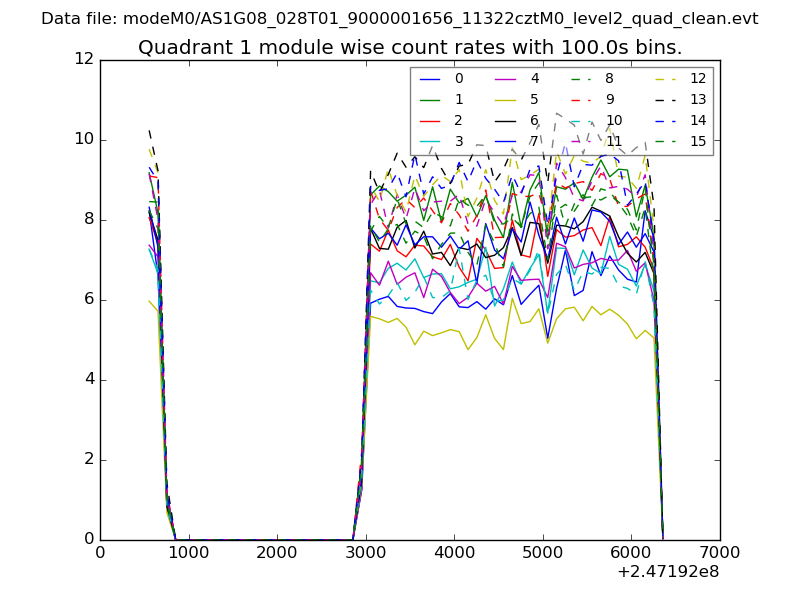
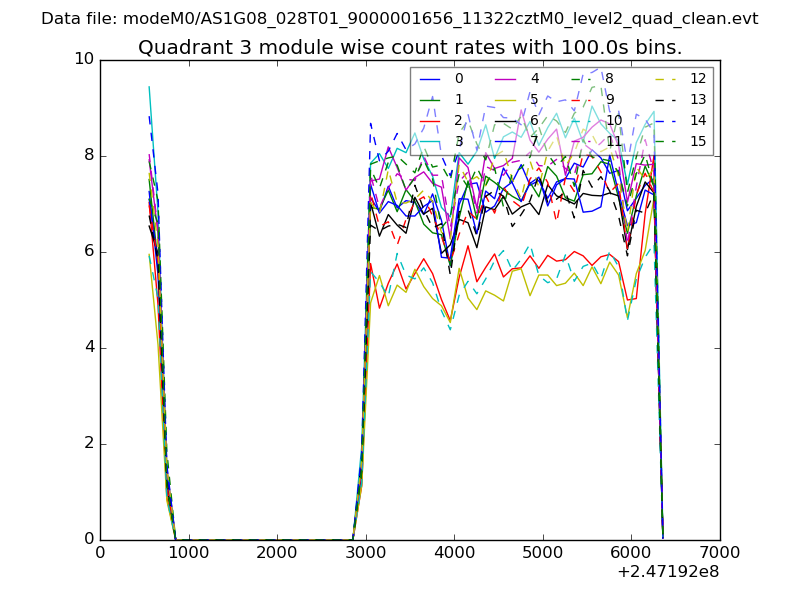
| Module-wise count rates for Quadrant A Data is divided into 100 sec bins |
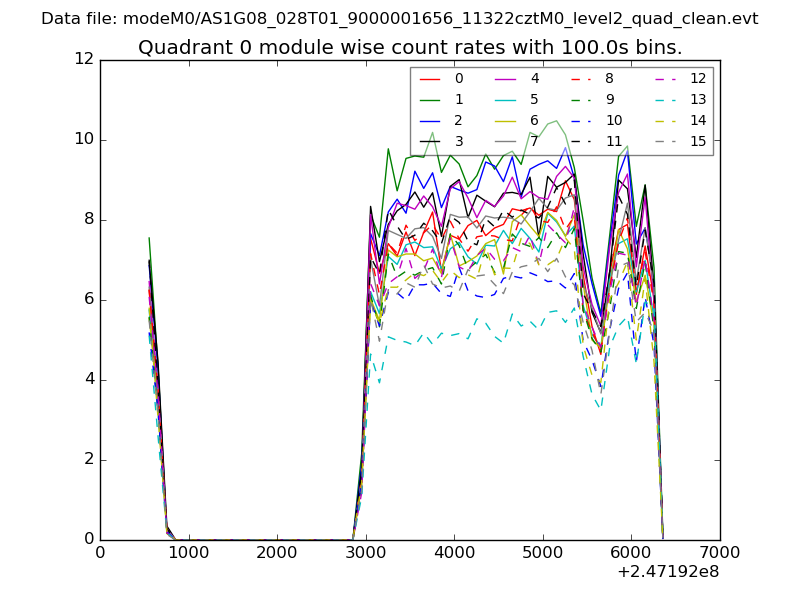 |
 |
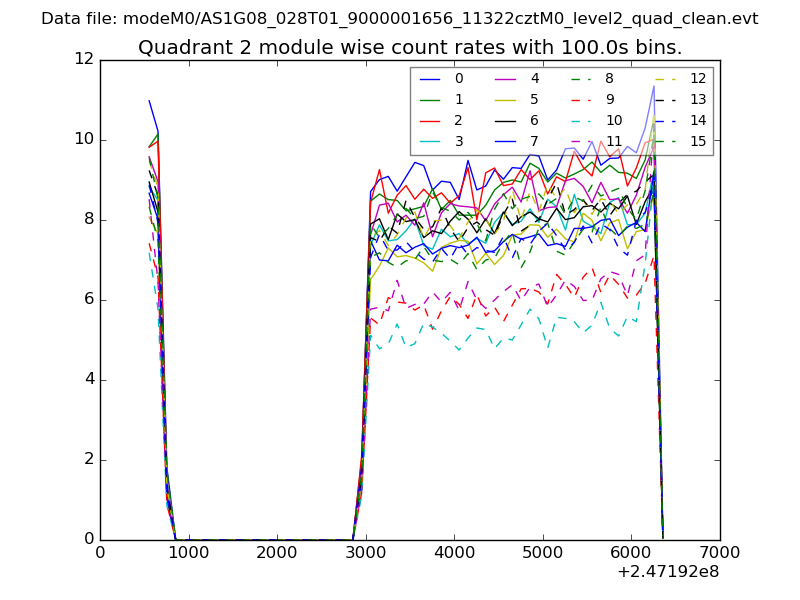
| Module-wise count rates for Quadrant B Data is divided into 100 sec bins |
 |
 |
| Module-wise count rates for Quadrant C Data is divided into 100 sec bins |
 |
 |
| Module-wise count rates for Quadrant D Data is divided into 100 sec bins |
 |
 |
| Parameter | Plot |
|---|---|
| CZT HV Monitor | 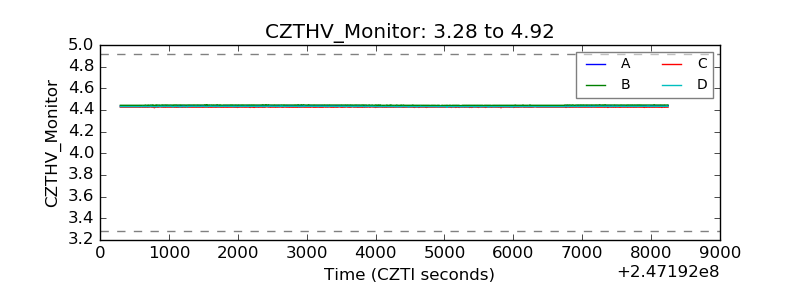 |
| D_VDD | 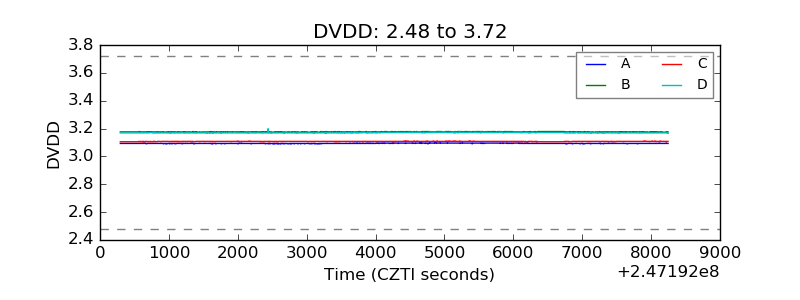 |
| Temperature 1 | 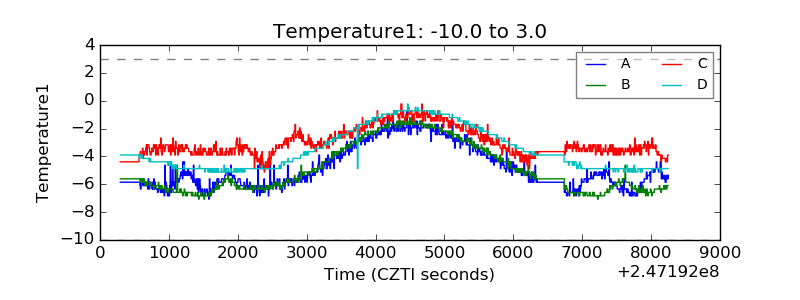 |
| Veto HV Monitor | 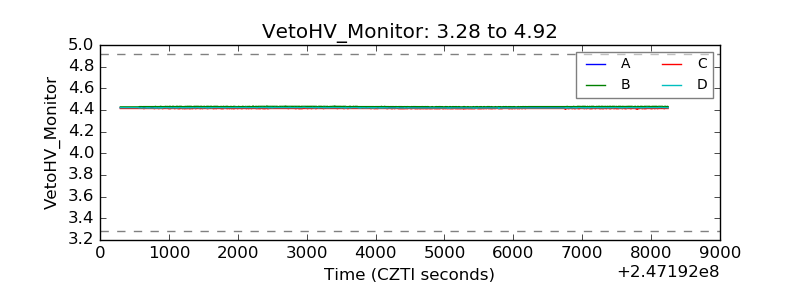 |
| Veto LLD | 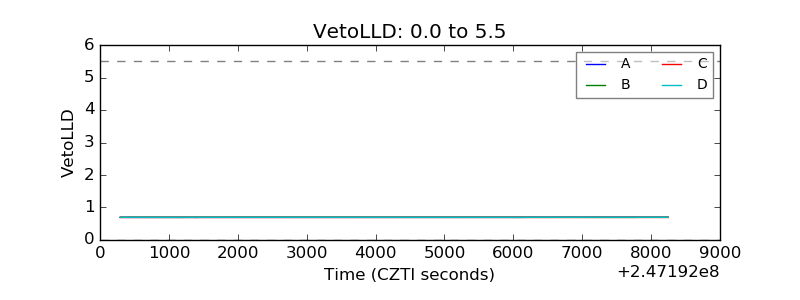 |
| Alpha Counter | 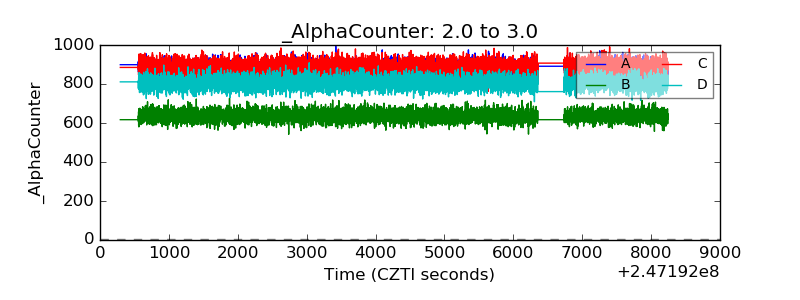 |
| _CPM_Rate | 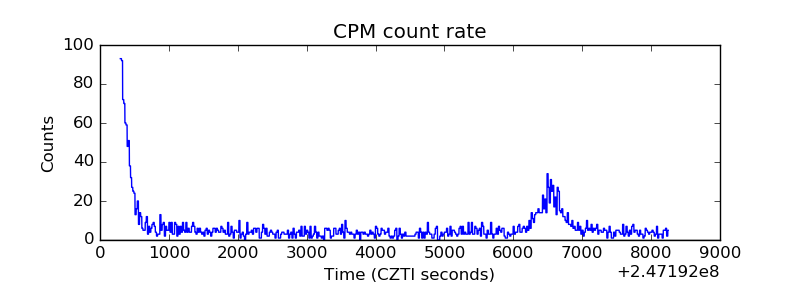 |
| CZT Counter | 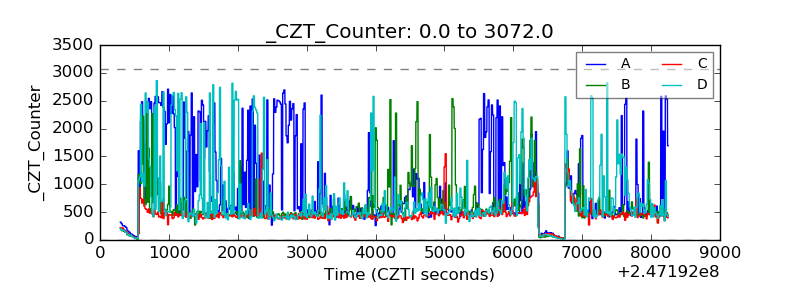 |
| +2.5 Volts monitor | 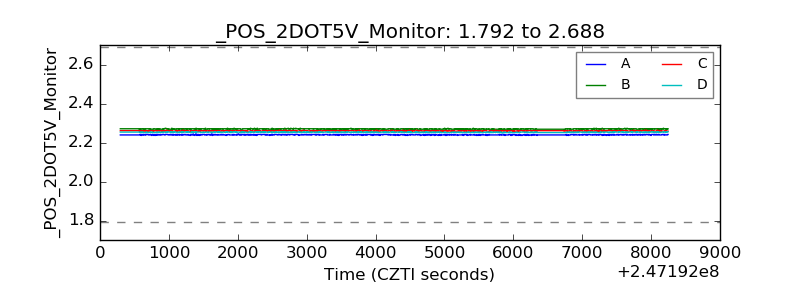 |
| +5 Volts monitor |  |
| _ROLL_ROT | 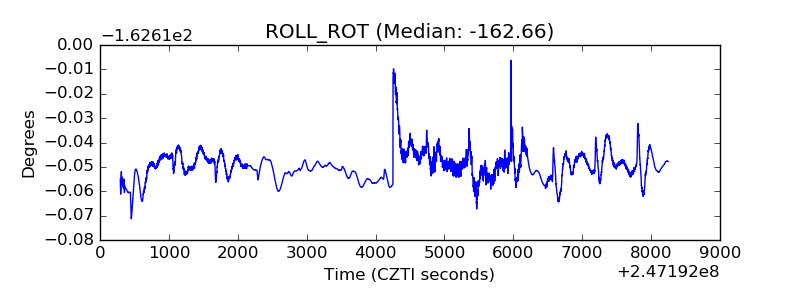 |
| _Roll_DEC | 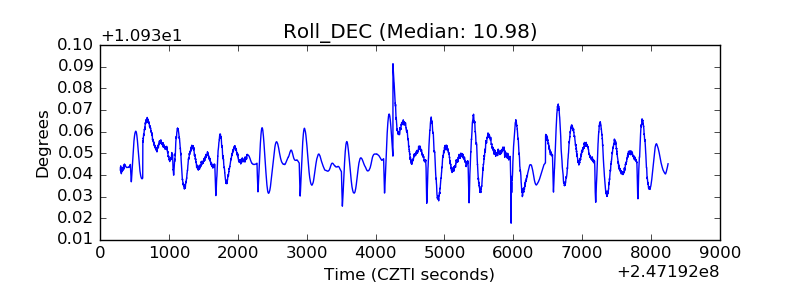 |
| _Roll_RA | 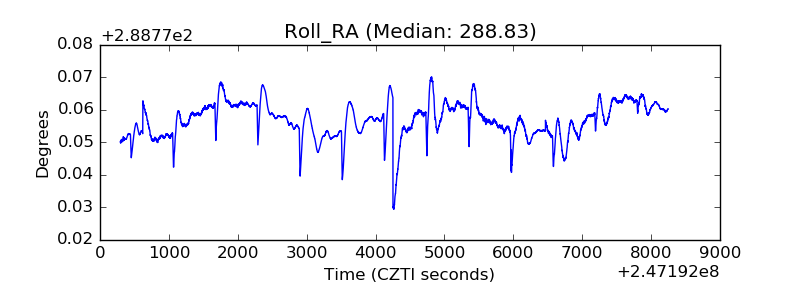 |
| Veto Counter | 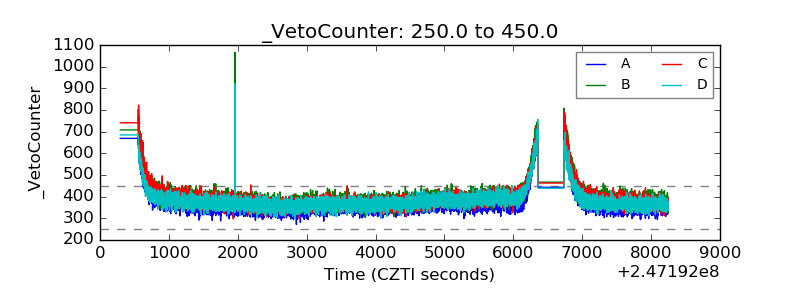 |