| Param | Original file | Final file |
|---|---|---|
| Filename | modeM0/AS1G08_028T01_9000001656_11324cztM0_level2.evt | modeM0/AS1G08_028T01_9000001656_11324cztM0_level2_quad_clean.evt |
| Size (bytes) | 904,495,680 | 73,704,960 |
| Size | 862.6 MB | 70.3 MB |
| Events in quadrant A | 8,152,552 | 393,670 |
| Events in quadrant B | 4,659,364 | 472,135 |
| Events in quadrant C | 8,057,730 | 420,171 |
| Events in quadrant D | 6,025,047 | 431,188 |
| Mode SS | |||
|---|---|---|---|
| Quadrant | BADHDUFLAG | Total packets | Discarded packets |
| A | 0 | 148 | 0 |
| B | 0 | 148 | 0 |
| C | 0 | 148 | 0 |
| D | 0 | 148 | 0 |
| Mode M0 | |||
|---|---|---|---|
| Quadrant | BADHDUFLAG | Total packets | Discarded packets |
| A | 0 | 29019 | 2 |
| B | 0 | 18548 | 1 |
| C | 0 | 28814 | 1 |
| D | 0 | 22791 | 1 |
| Mode M9 | |||
|---|---|---|---|
| Quadrant | BADHDUFLAG | Total packets | Discarded packets |
| A | 0 | 3 | 0 |
| B | 0 | 3 | 0 |
| C | 0 | 3 | 0 |
| D | 0 | 3 | 0 |
| Quadrant | Total seconds | Saturated seconds | Saturation percentage |
|---|---|---|---|
| A | 7383 | 2086 | 28.254097% |
| B | 7383 | 467 | 6.325342% |
| C | 7383 | 1999 | 27.075714% |
| D | 7383 | 820 | 11.106596% |
Noise dominated data is calculated using 1-second bins in cleaned event files. If a bin has >2000 counts, and if more than 50% of those come from <1% of pixels, then it is considered to be noise-dominated and hence unusable.
| Quadrant | # 1 sec bins | Bins with >0 counts | Bins with >2000 counts | High rate bins dominated by noise | Noise dominated (total time) | Noise dominated (detector-on time) | Marked lightcurve |
|---|---|---|---|---|---|---|---|
| A | 7648 | 7384 | 1372 | 1372 | 17.94% | 18.58% | 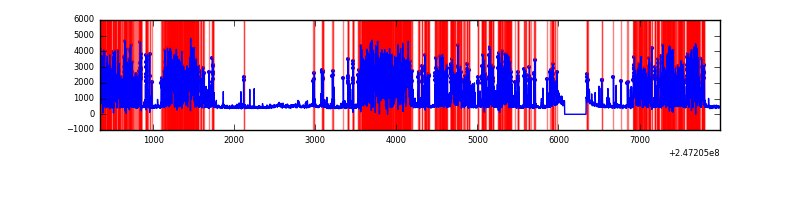 |
| B | 7648 | 7384 | 188 | 188 | 2.46% | 2.55% | 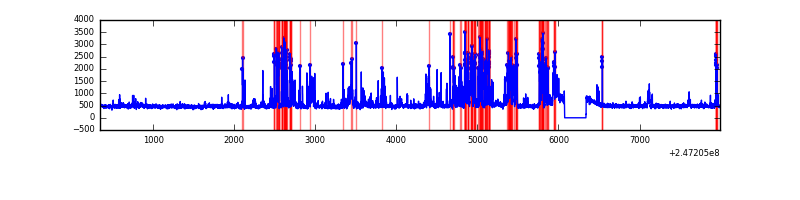 |
| C | 7648 | 7384 | 1707 | 1707 | 22.32% | 23.12% | 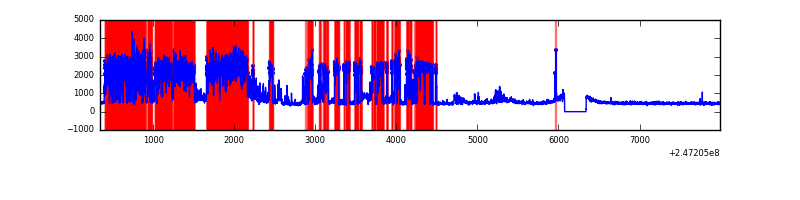 |
| D | 7648 | 7383 | 591 | 591 | 7.73% | 8.00% | 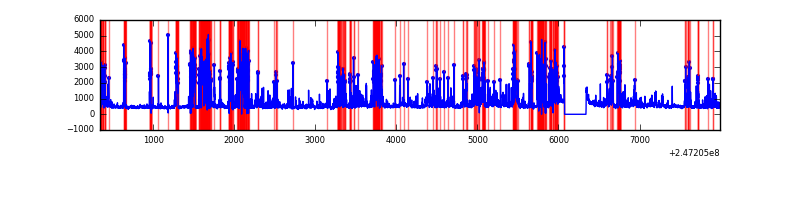 |
Top three noisy pixels from each quadrant. If the there are fewer than three noisy pixels in the level2.evt file, extra rows are filled as -1
| Pixel properties | Quadrant properties | ||||||
|---|---|---|---|---|---|---|---|
| Quadrant | DetID | PixID | Counts | Sigma | Mean | Median | Sigma |
| A | 14 | 238 | 5096029 | 32711.71 | 745 | 728 | 155.8 |
| A | 8 | 15 | 84692 | 539.05 | 745 | 728 | 155.8 |
| A | 15 | 174 | 35861 | 225.55 | 745 | 728 | 155.8 |
| B | 4 | 239 | 902962 | 5377.67 | 866 | 845 | 167.8 |
| B | 3 | 64 | 225449 | 1338.9 | 866 | 845 | 167.8 |
| B | 15 | 204 | 60242 | 354.08 | 866 | 845 | 167.8 |
| C | 9 | 204 | 5036486 | 27973.87 | 771 | 775 | 180.0 |
| C | 8 | 128 | 6353 | 30.99 | 771 | 775 | 180.0 |
| C | 13 | 61 | 5697 | 27.34 | 771 | 775 | 180.0 |
| D | 10 | 253 | 969177 | 4911.36 | 801 | 776 | 197.2 |
| D | 1 | 52 | 958889 | 4859.19 | 801 | 776 | 197.2 |
| D | 2 | 120 | 379283 | 1919.64 | 801 | 776 | 197.2 |
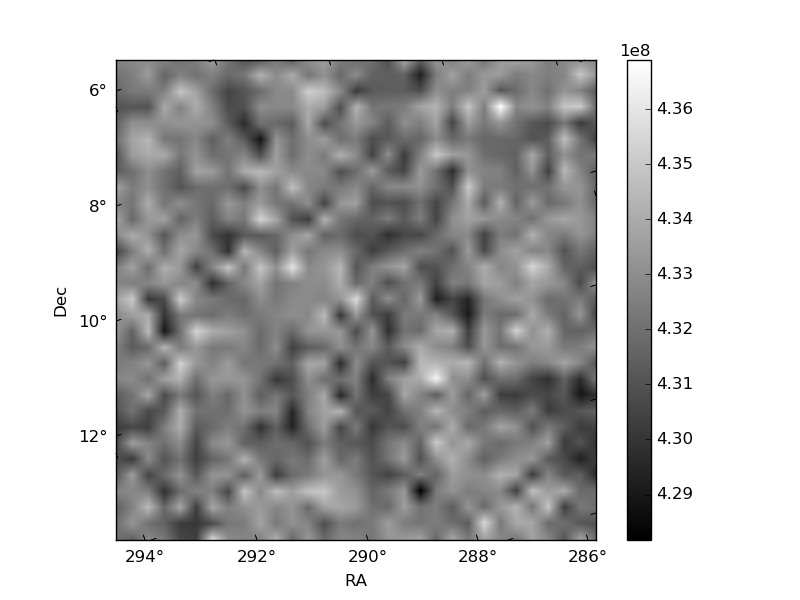
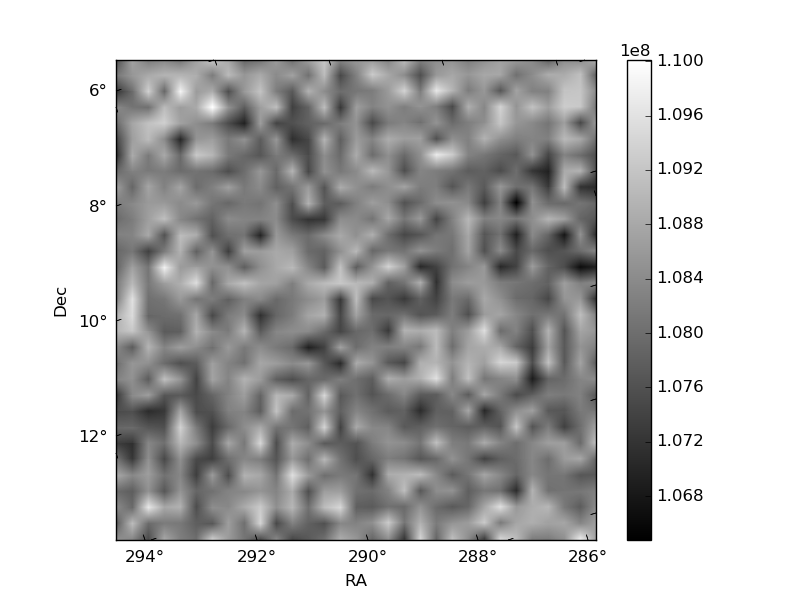
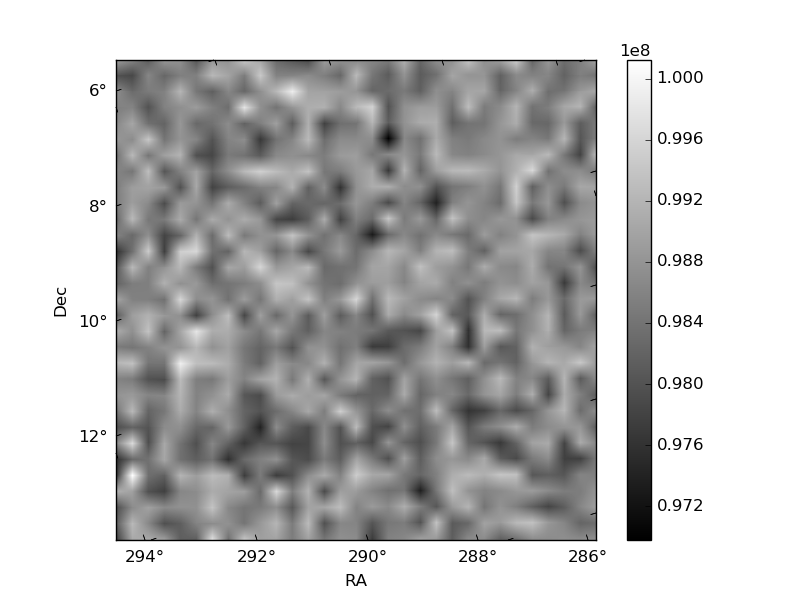
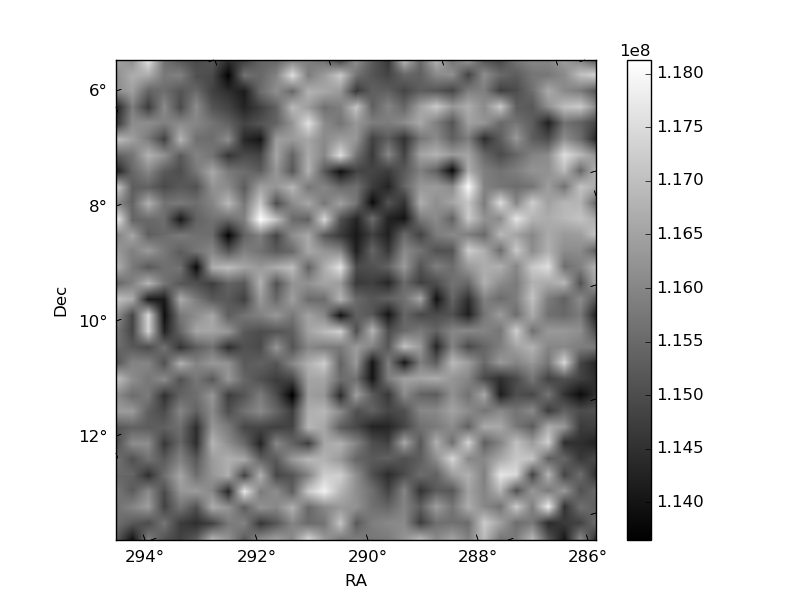
Histogram calculated using DETX and DETY for each event in the final _common_clean file
| Quadrant A | 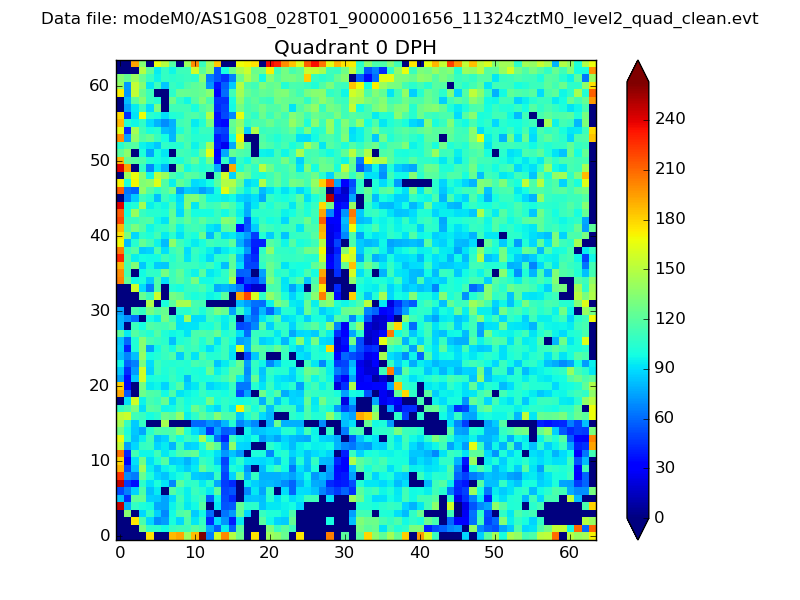 |
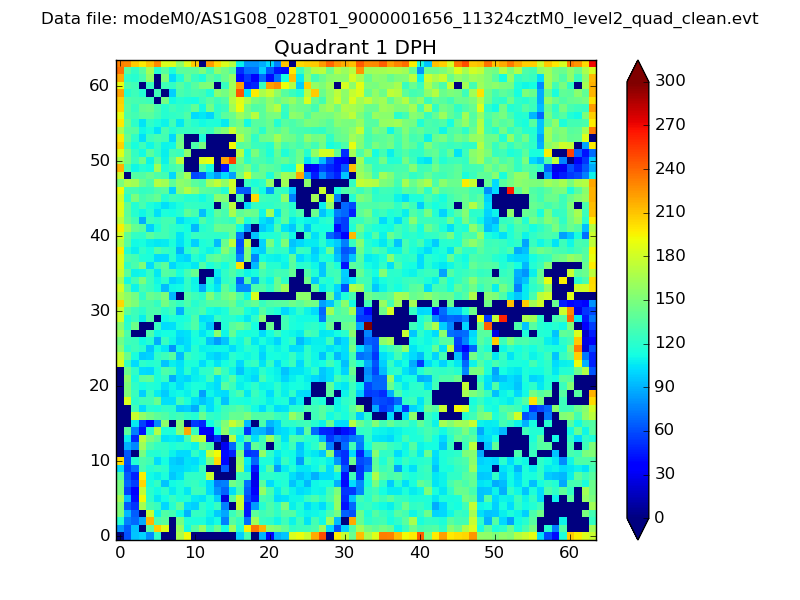 |
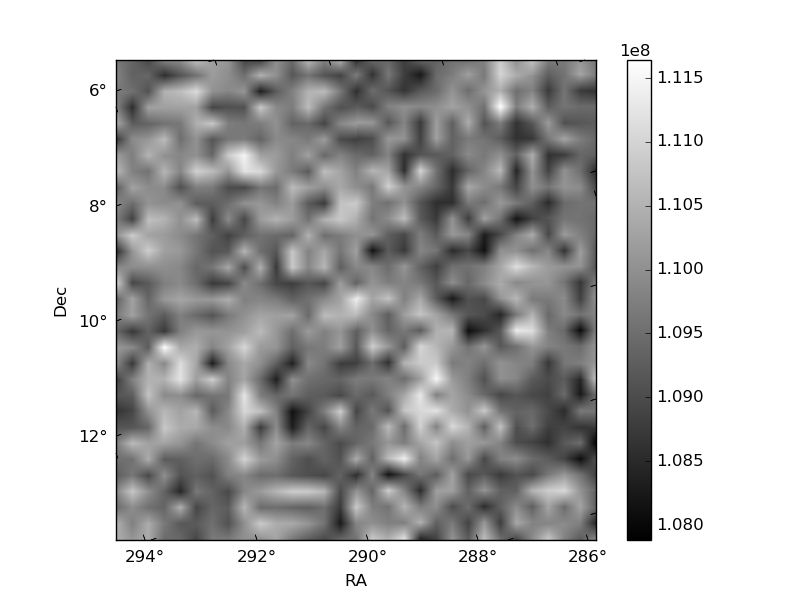
Quadrant B |
|---|---|---|---|
| Quadrant D | 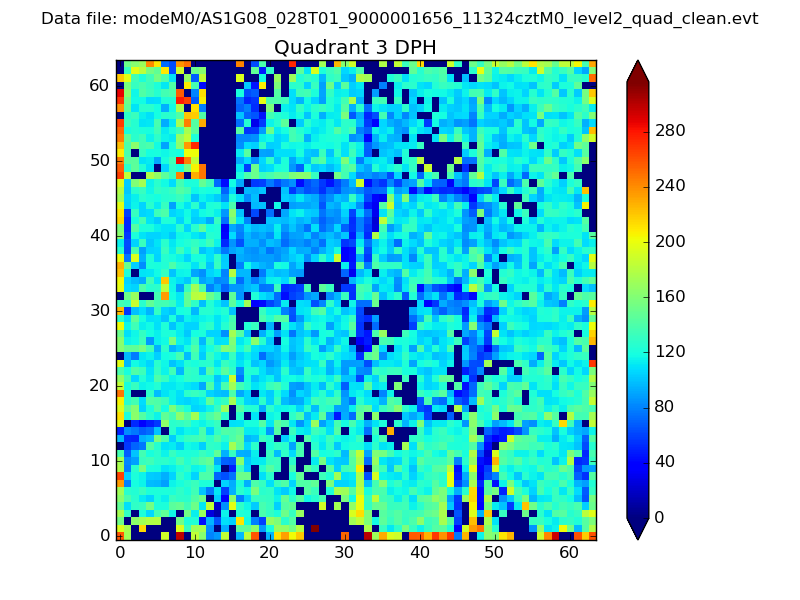 |
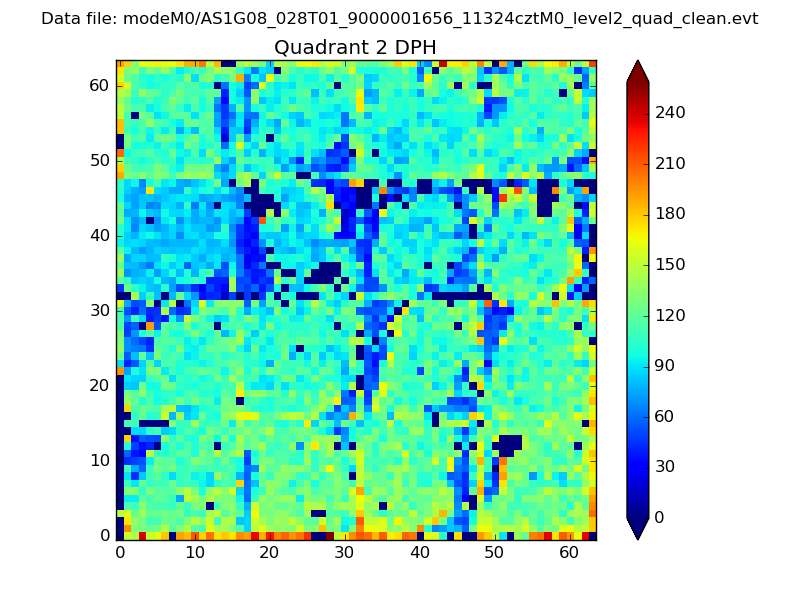 |
Quadrant C |
| Plot type | Count rate plots | Images |
|---|---|---|
| Comparison with Poisson distribution Blue bars denote a histogram of data divided into 1 sec bins. Red curve is a Poisson curve with rate = median count rate of data. |
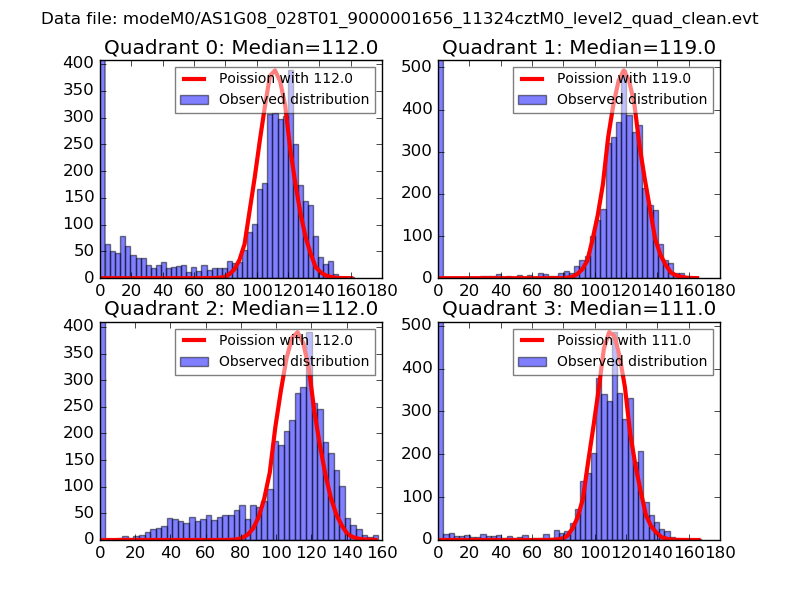 |
 |
| Quadrant-wise count rates Data is divided into 100 sec bins |
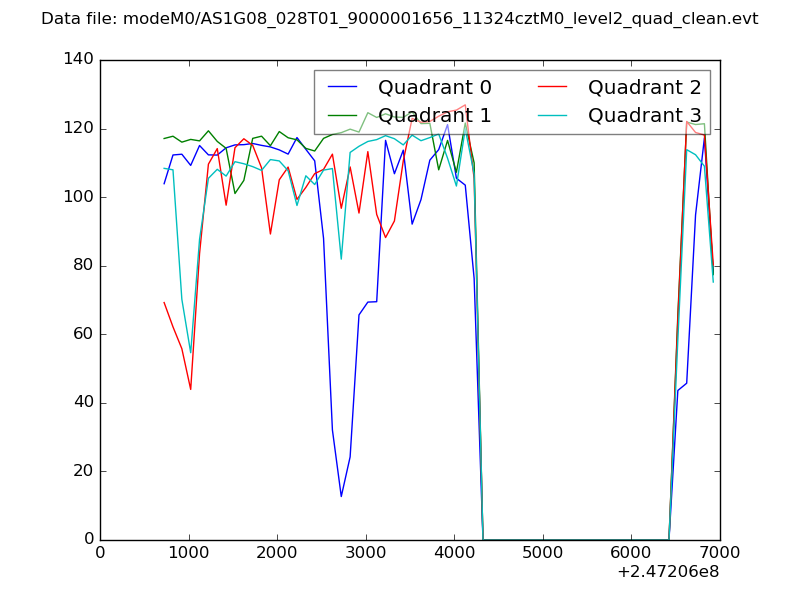 |
|
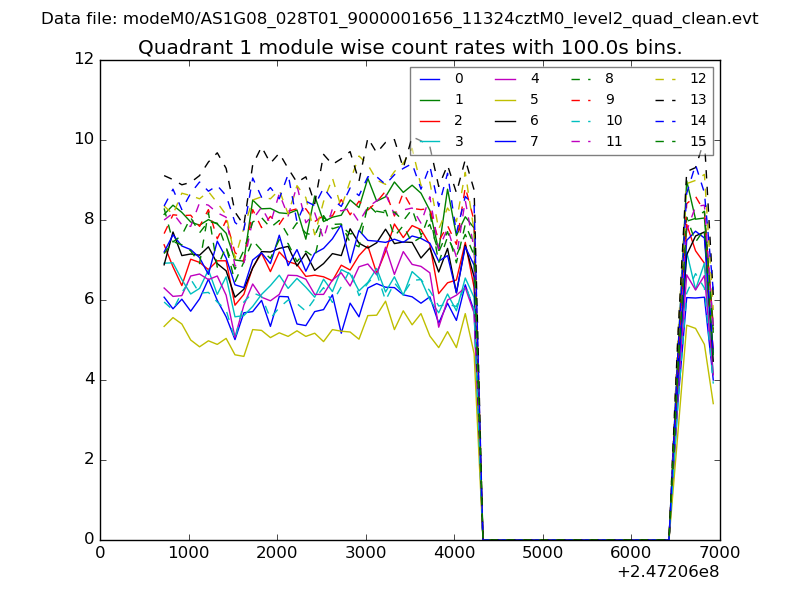
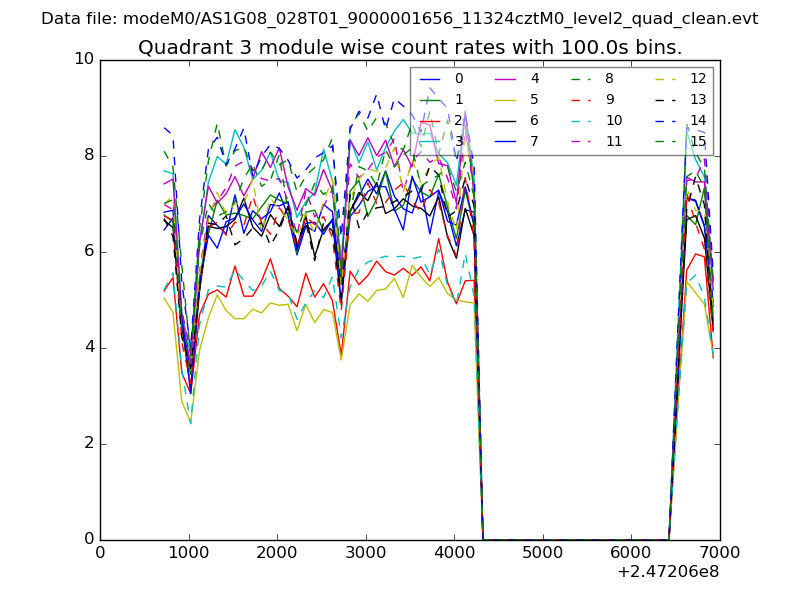
| Module-wise count rates for Quadrant A Data is divided into 100 sec bins |
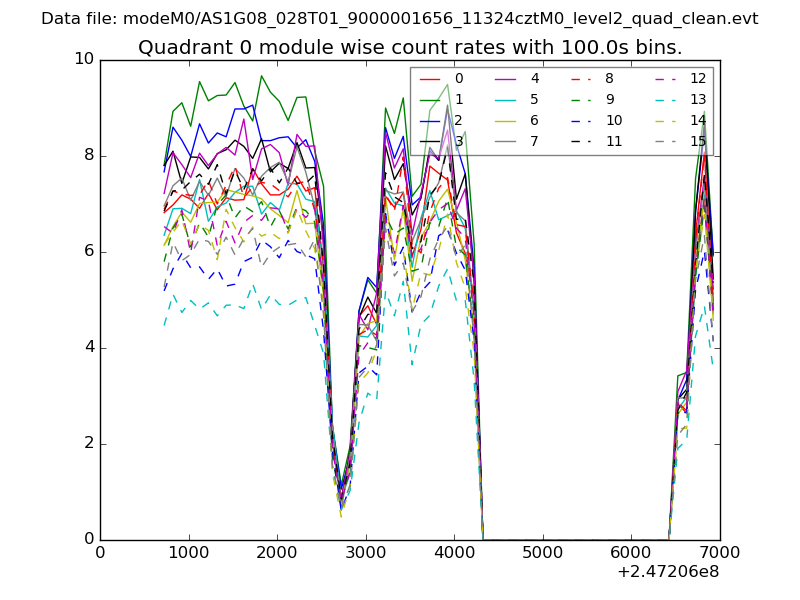 |
 |
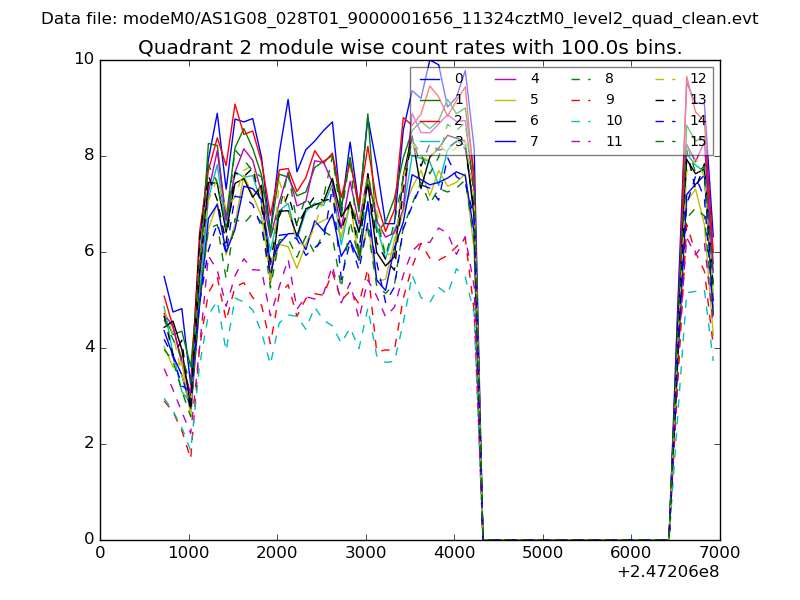
| Module-wise count rates for Quadrant B Data is divided into 100 sec bins |
 |
 |
| Module-wise count rates for Quadrant C Data is divided into 100 sec bins |
 |
 |
| Module-wise count rates for Quadrant D Data is divided into 100 sec bins |
 |
 |
| Parameter | Plot |
|---|---|
| CZT HV Monitor | 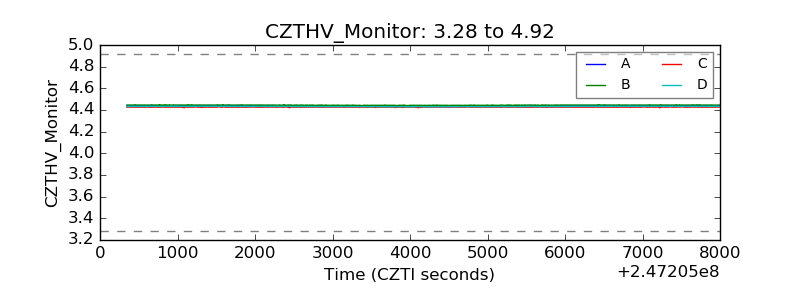 |
| D_VDD | 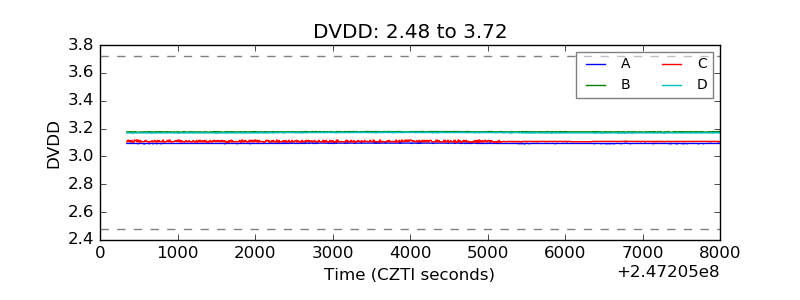 |
| Temperature 1 | 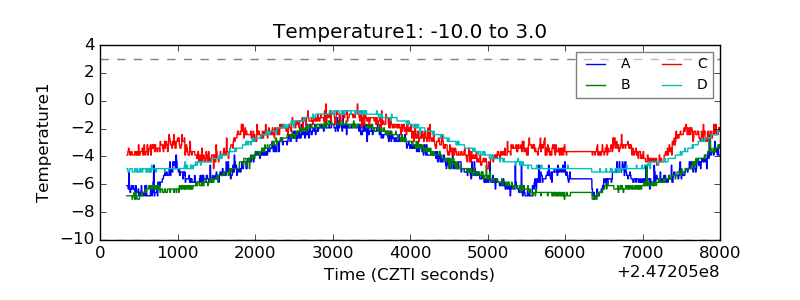 |
| Veto HV Monitor |  |
| Veto LLD | 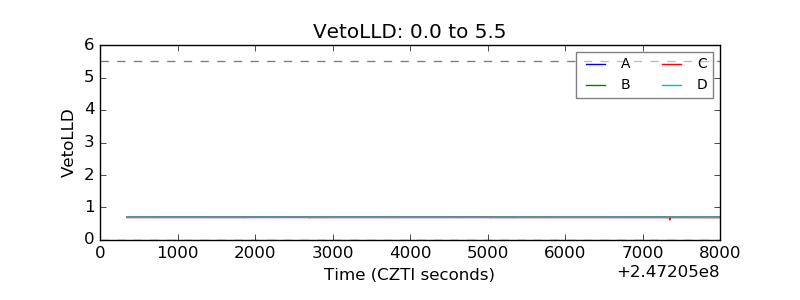 |
| Alpha Counter | 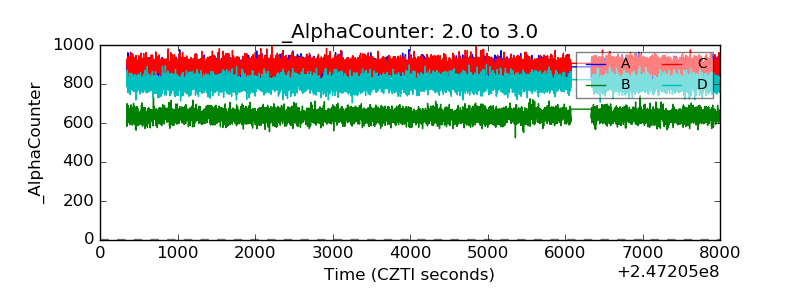 |
| _CPM_Rate | 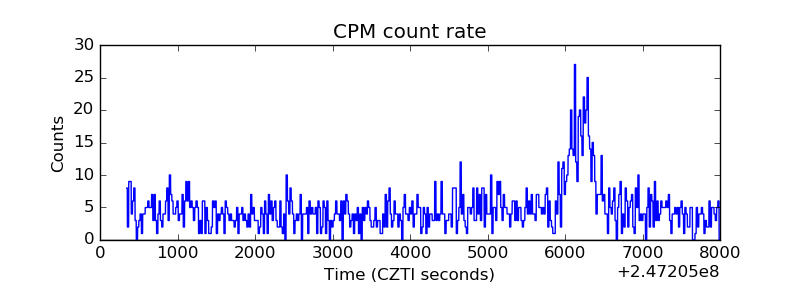 |
| CZT Counter | 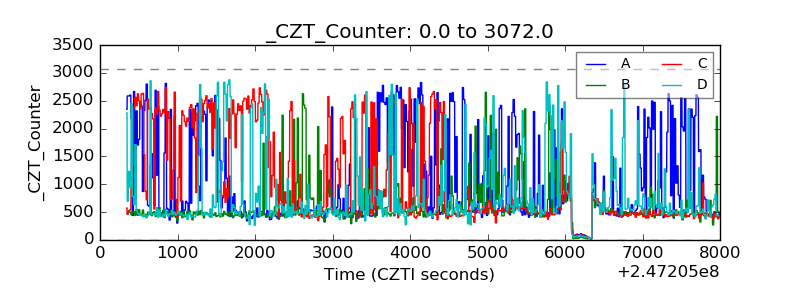 |
| +2.5 Volts monitor |  |
| +5 Volts monitor | 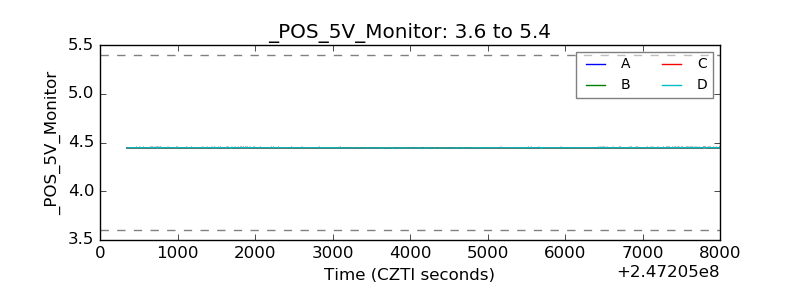 |
| _ROLL_ROT | 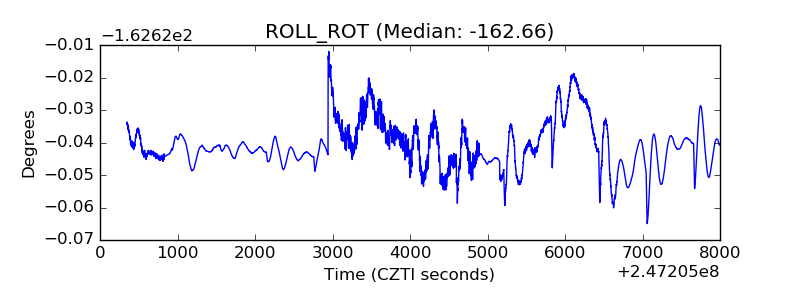 |
| _Roll_DEC | 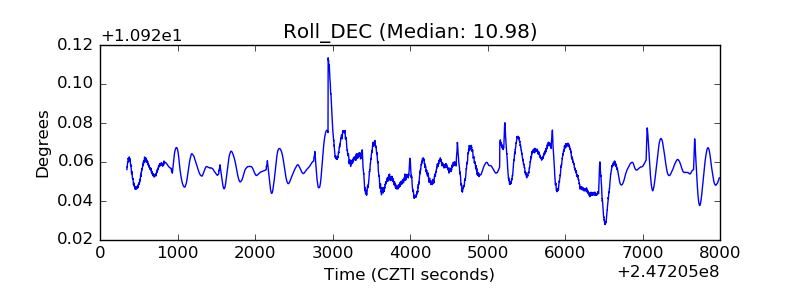 |
| _Roll_RA | 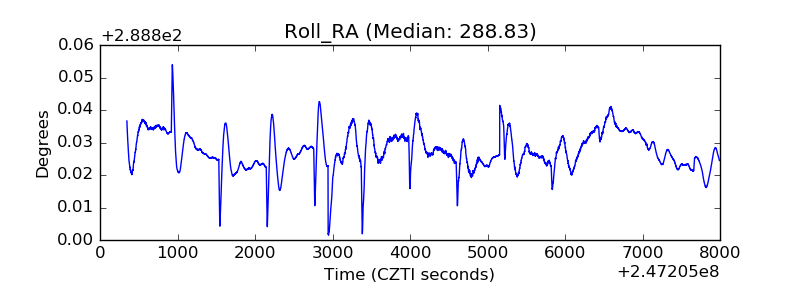 |
| Veto Counter | 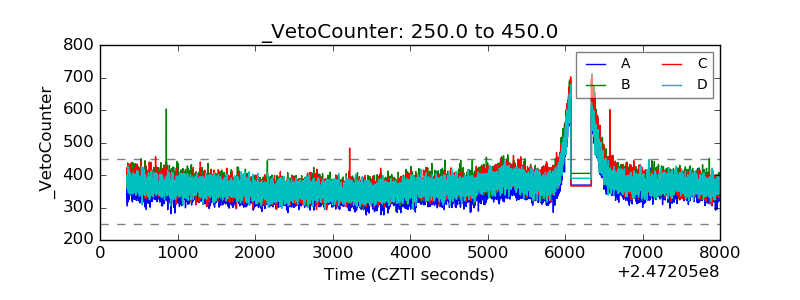 |