| Param | Original file | Final file |
|---|---|---|
| Filename | modeM0/AS1G08_028T01_9000001656_11328cztM0_level2.evt | modeM0/AS1G08_028T01_9000001656_11328cztM0_level2_quad_clean.evt |
| Size (bytes) | 197,136,000 | 20,937,600 |
| Size | 188.0 MB | 20.0 MB |
| Events in quadrant A | 2,004,896 | 114,285 |
| Events in quadrant B | 1,277,278 | 125,197 |
| Events in quadrant C | 925,979 | 127,761 |
| Events in quadrant D | 1,618,945 | 115,576 |
| Mode SS | |||
|---|---|---|---|
| Quadrant | BADHDUFLAG | Total packets | Discarded packets |
| A | 0 | 42 | 0 |
| B | 0 | 42 | 0 |
| C | 0 | 42 | 0 |
| D | 0 | 42 | 0 |
| Mode M0 | |||
|---|---|---|---|
| Quadrant | BADHDUFLAG | Total packets | Discarded packets |
| A | 0 | 7265 | 0 |
| B | 0 | 5065 | 0 |
| C | 0 | 4155 | 0 |
| D | 0 | 6175 | 0 |
| Quadrant | Total seconds | Saturated seconds | Saturation percentage |
|---|---|---|---|
| A | 2074 | 439 | 21.166827% |
| B | 2074 | 90 | 4.339441% |
| C | 2074 | 0 | 0.000000% |
| D | 2074 | 140 | 6.750241% |
Noise dominated data is calculated using 1-second bins in cleaned event files. If a bin has >2000 counts, and if more than 50% of those come from <1% of pixels, then it is considered to be noise-dominated and hence unusable.
| Quadrant | # 1 sec bins | Bins with >0 counts | Bins with >2000 counts | High rate bins dominated by noise | Noise dominated (total time) | Noise dominated (detector-on time) | Marked lightcurve |
|---|---|---|---|---|---|---|---|
| A | 2074 | 2074 | 294 | 294 | 14.18% | 14.18% | 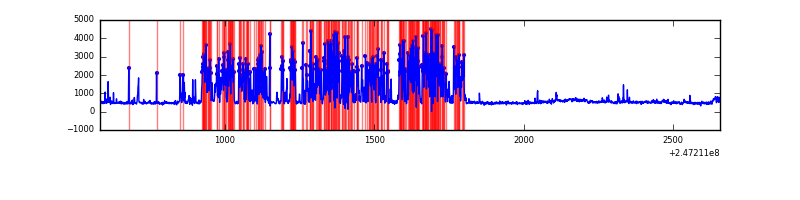 |
| B | 2074 | 2074 | 64 | 64 | 3.09% | 3.09% | 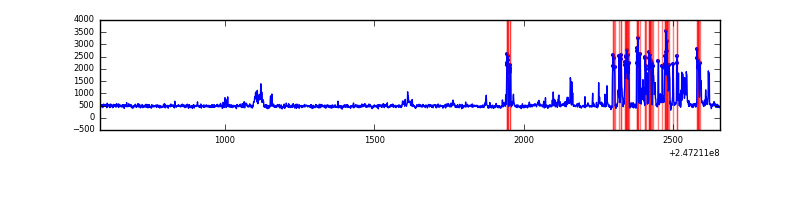 |
| C | 2074 | 2074 | 0 | 0 | 0.00% | 0.00% | 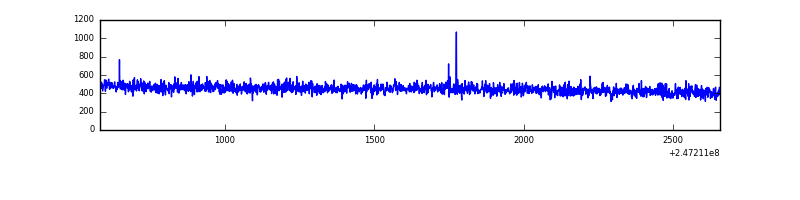 |
| D | 2074 | 2074 | 120 | 120 | 5.79% | 5.79% | 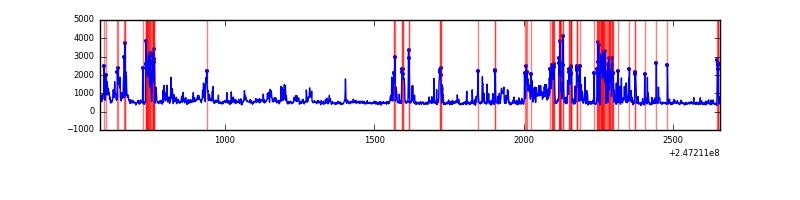 |
Top three noisy pixels from each quadrant. If the there are fewer than three noisy pixels in the level2.evt file, extra rows are filled as -1
| Pixel properties | Quadrant properties | ||||||
|---|---|---|---|---|---|---|---|
| Quadrant | DetID | PixID | Counts | Sigma | Mean | Median | Sigma |
| A | 14 | 238 | 1080091 | 22365.48 | 220 | 215 | 48.3 |
| A | 15 | 174 | 49164 | 1013.79 | 220 | 215 | 48.3 |
| A | 8 | 15 | 12564 | 255.76 | 220 | 215 | 48.3 |
| B | 4 | 239 | 274572 | 5565.96 | 242 | 236 | 49.3 |
| B | 3 | 64 | 15803 | 315.84 | 242 | 236 | 49.3 |
| B | 0 | 219 | 15053 | 300.62 | 242 | 236 | 49.3 |
| C | 13 | 61 | 1758 | 26.84 | 237 | 237 | 56.7 |
| C | 14 | 234 | 1626 | 24.51 | 237 | 237 | 56.7 |
| C | 3 | 202 | 612 | 6.61 | 237 | 237 | 56.7 |
| D | 1 | 52 | 220996 | 3789.46 | 230 | 222 | 58.3 |
| D | 10 | 253 | 211674 | 3629.45 | 230 | 222 | 58.3 |
| D | 2 | 120 | 182568 | 3129.87 | 230 | 222 | 58.3 |
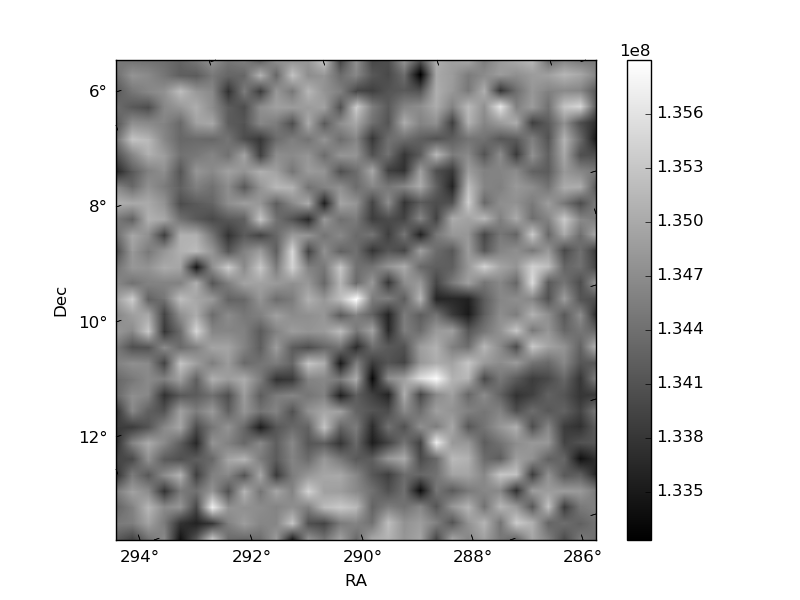
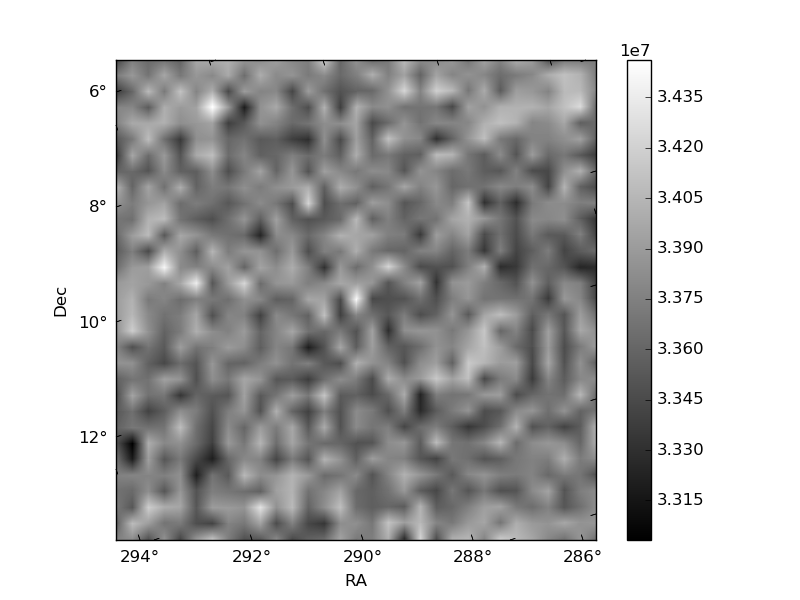
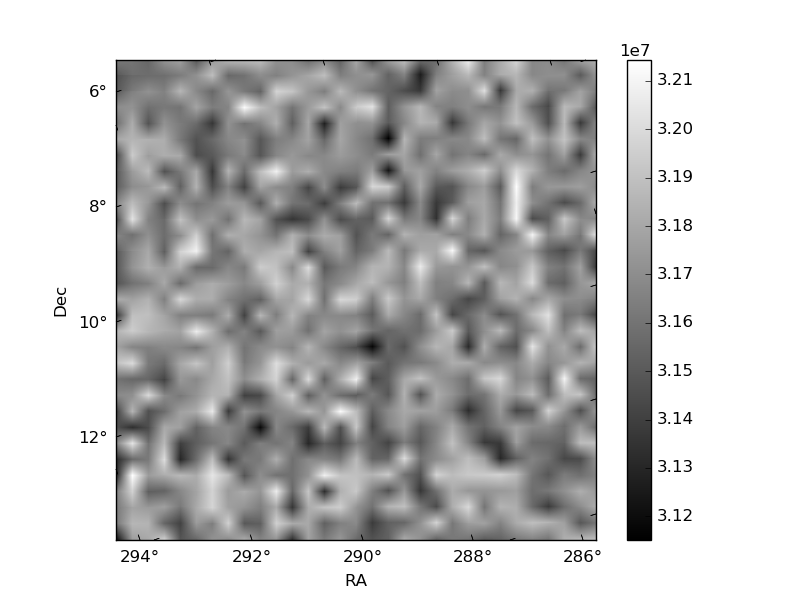
Histogram calculated using DETX and DETY for each event in the final _common_clean file
| Quadrant A | 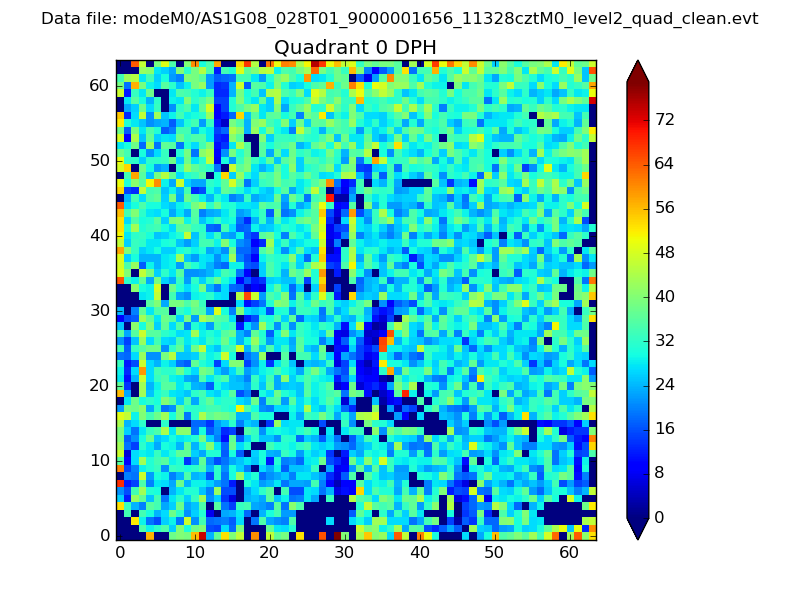 |
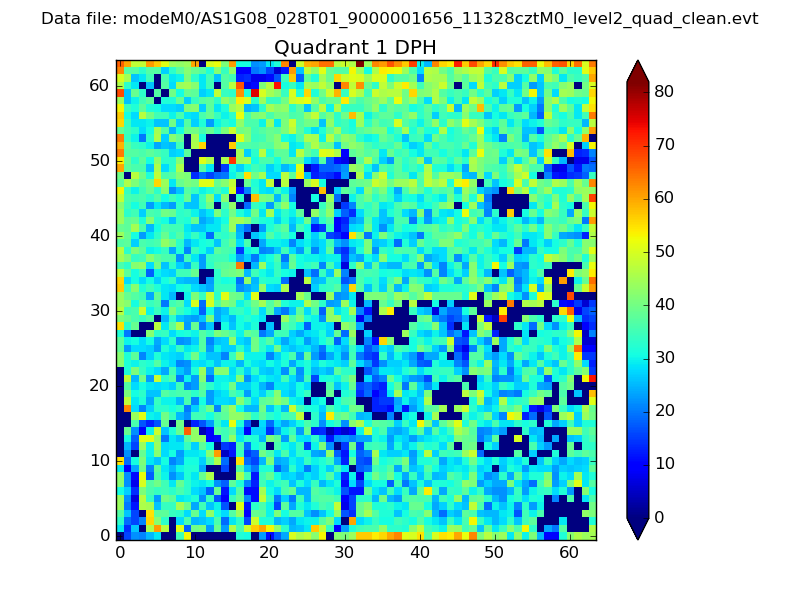 |
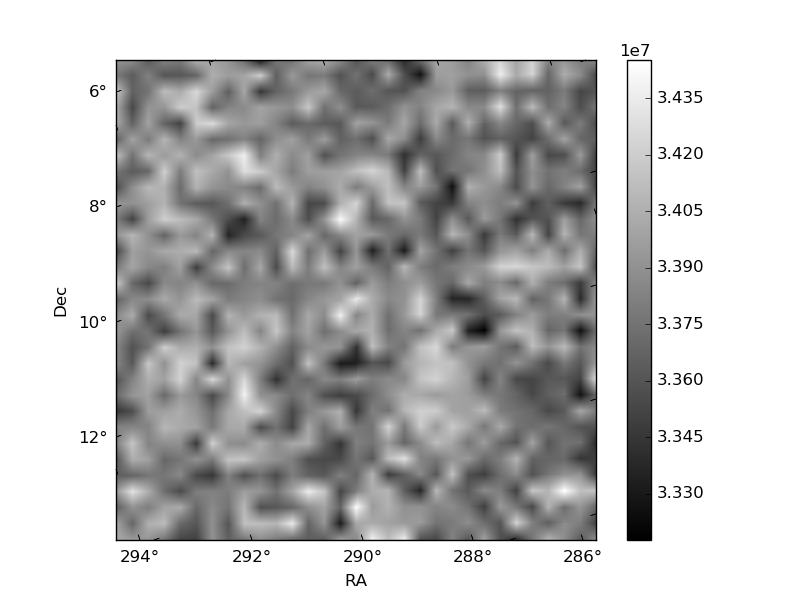
Quadrant B |
|---|---|---|---|
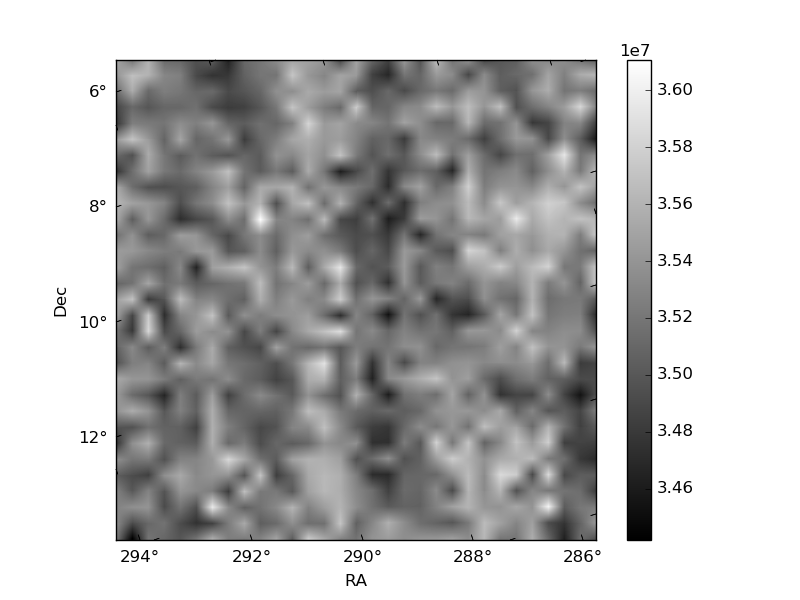
| Quadrant D | 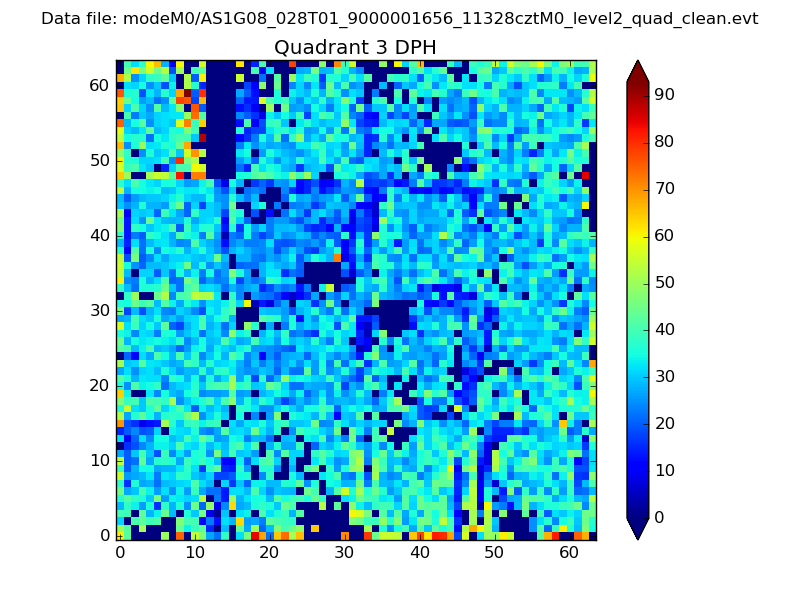 |
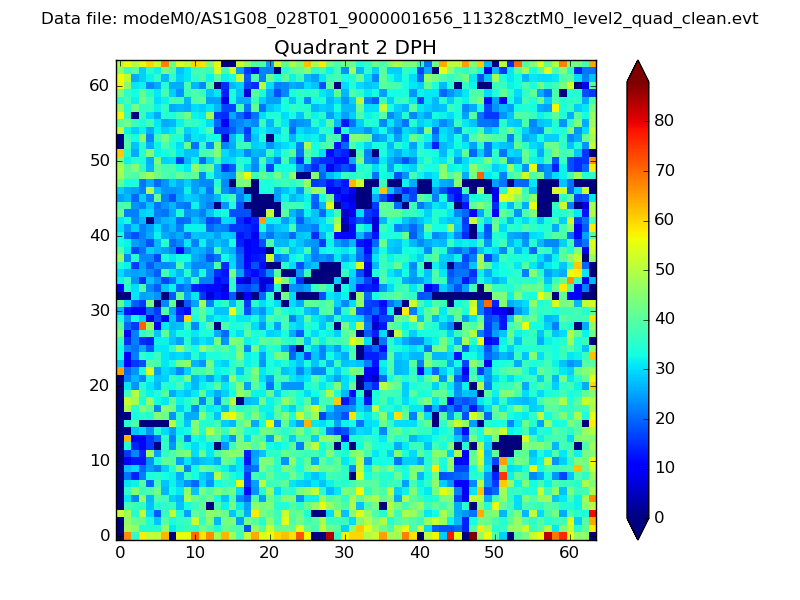 |
Quadrant C |
| Plot type | Count rate plots | Images |
|---|---|---|
| Comparison with Poisson distribution Blue bars denote a histogram of data divided into 1 sec bins. Red curve is a Poisson curve with rate = median count rate of data. |
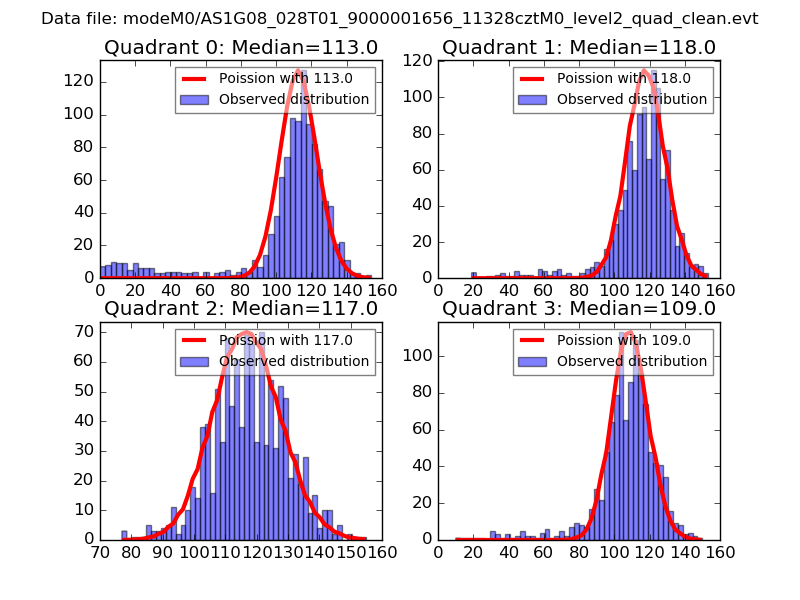 |
 |
| Quadrant-wise count rates Data is divided into 100 sec bins |
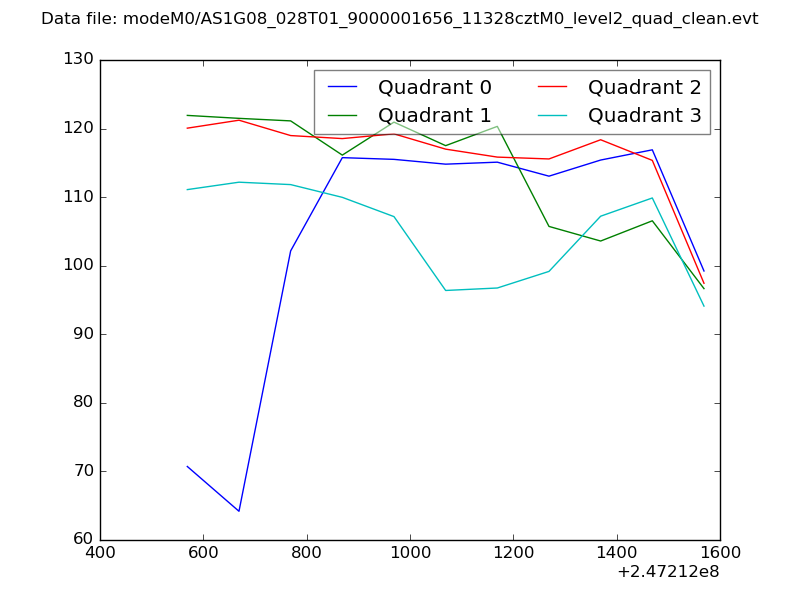 |
|
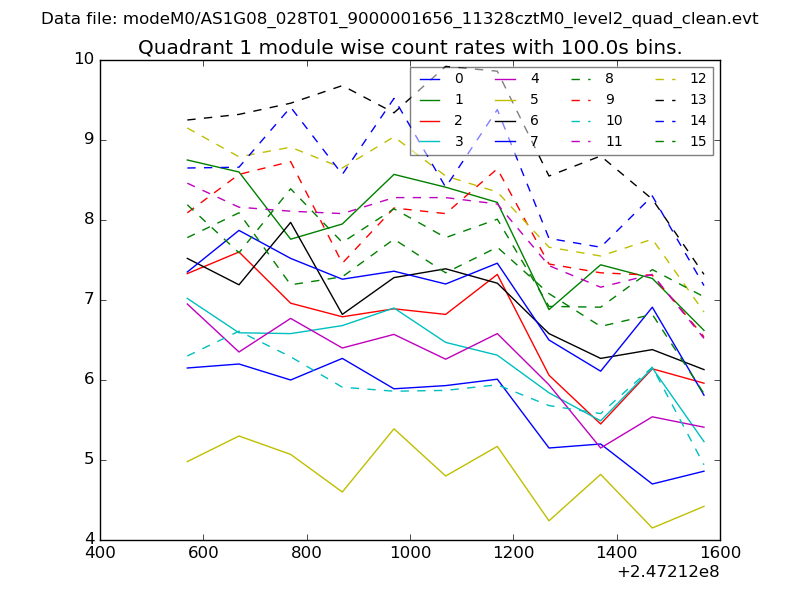
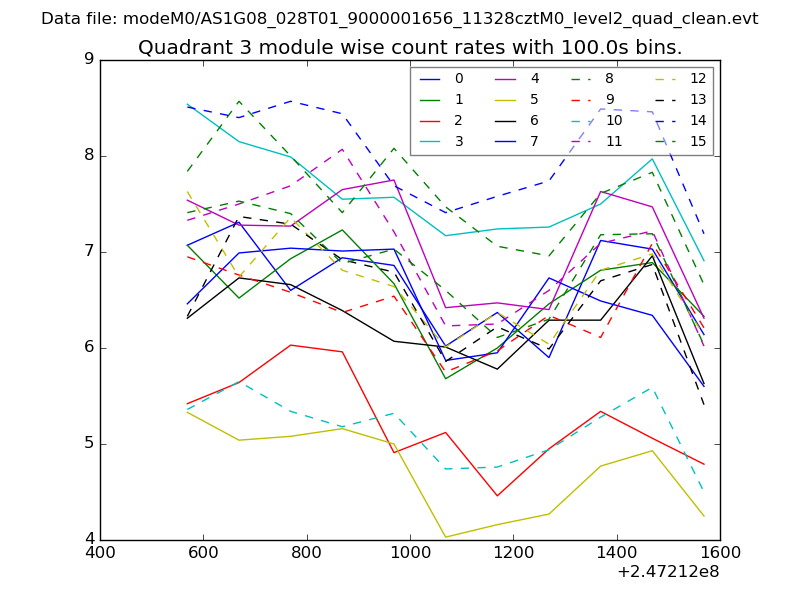
| Module-wise count rates for Quadrant A Data is divided into 100 sec bins |
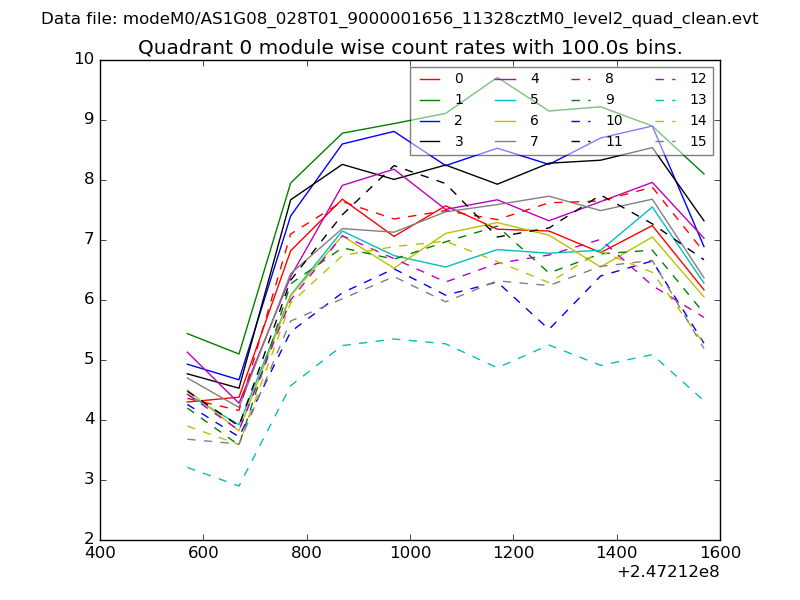 |
 |
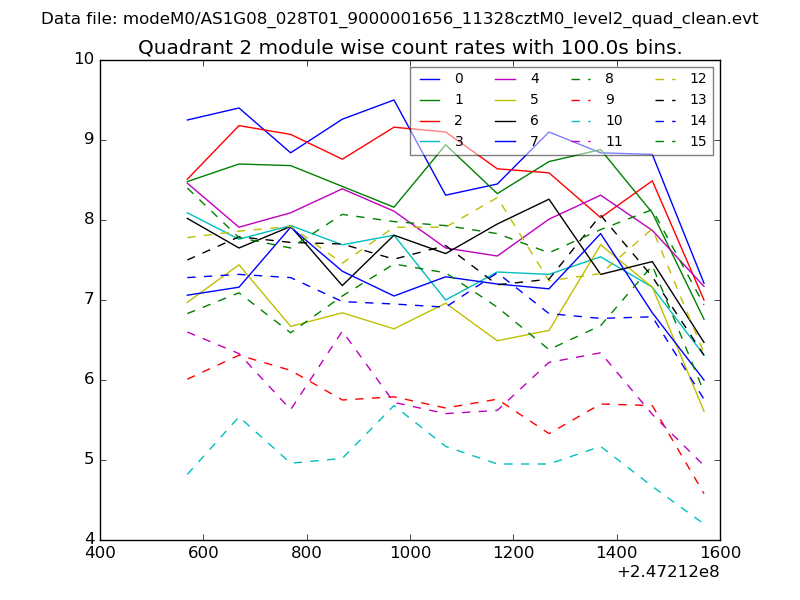
| Module-wise count rates for Quadrant B Data is divided into 100 sec bins |
 |
 |
| Module-wise count rates for Quadrant C Data is divided into 100 sec bins |
 |
 |
| Module-wise count rates for Quadrant D Data is divided into 100 sec bins |
 |
 |
| Parameter | Plot |
|---|---|
| CZT HV Monitor | 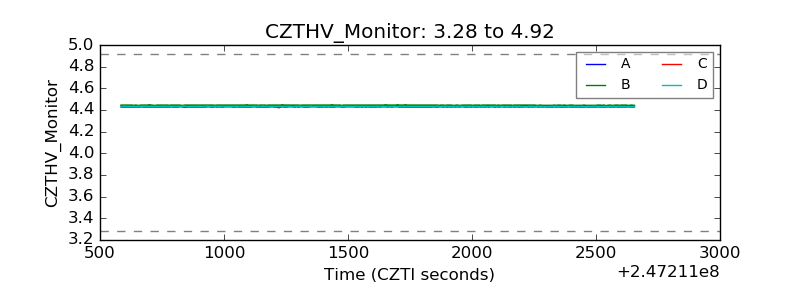 |
| D_VDD | 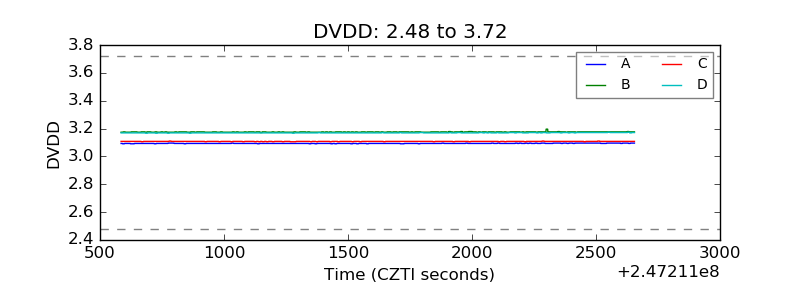 |
| Temperature 1 | 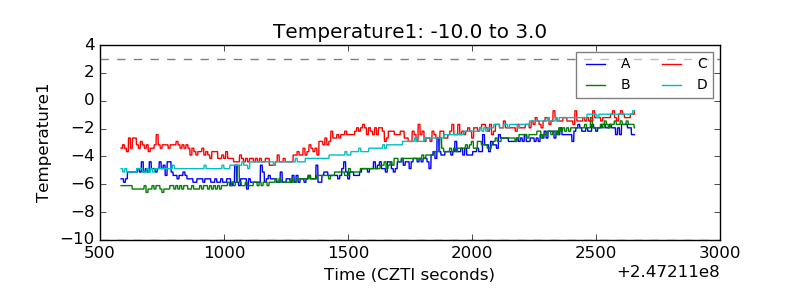 |
| Veto HV Monitor | 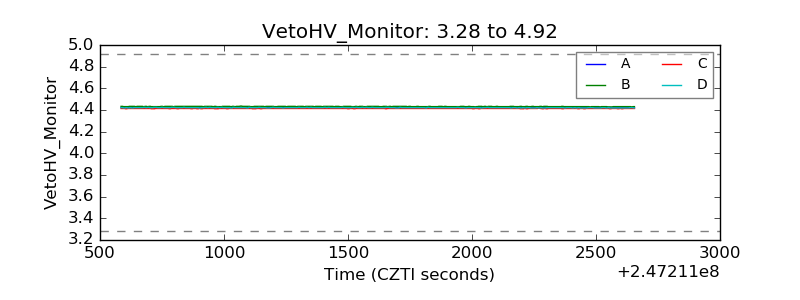 |
| Veto LLD | 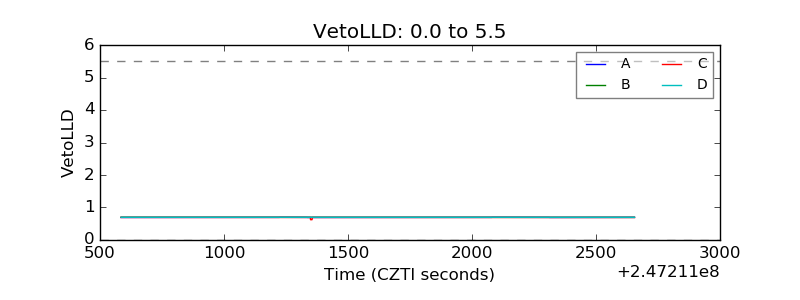 |
| Alpha Counter | 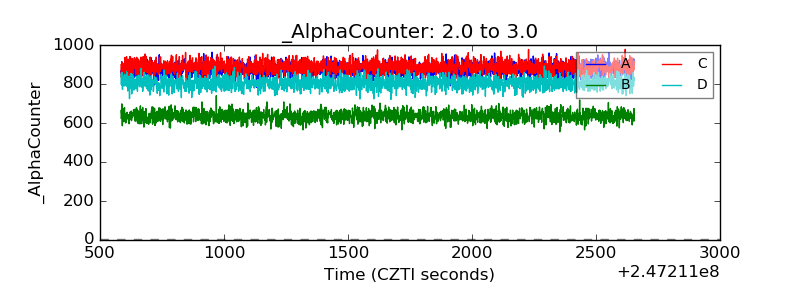 |
| _CPM_Rate | 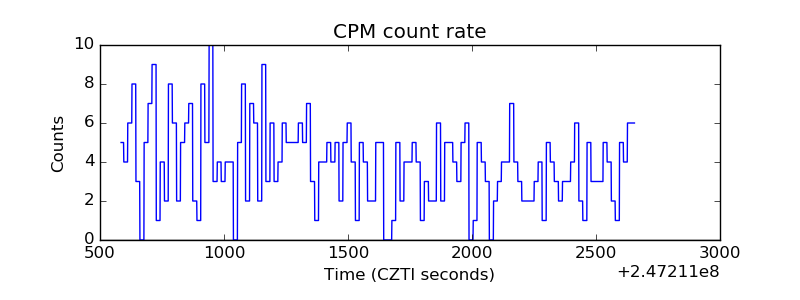 |
| CZT Counter | 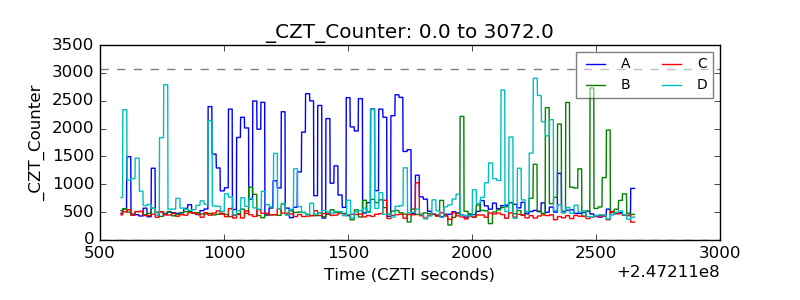 |
| +2.5 Volts monitor |  |
| +5 Volts monitor |  |
| _ROLL_ROT | 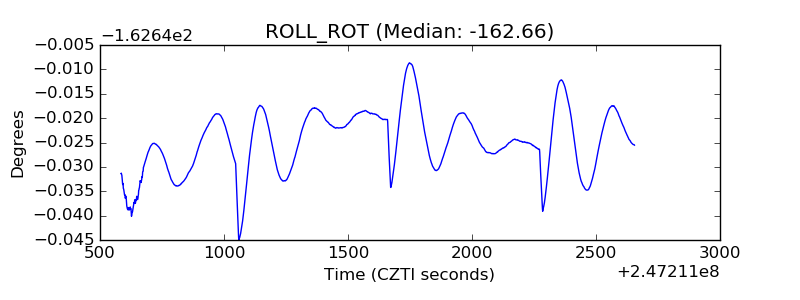 |
| _Roll_DEC | 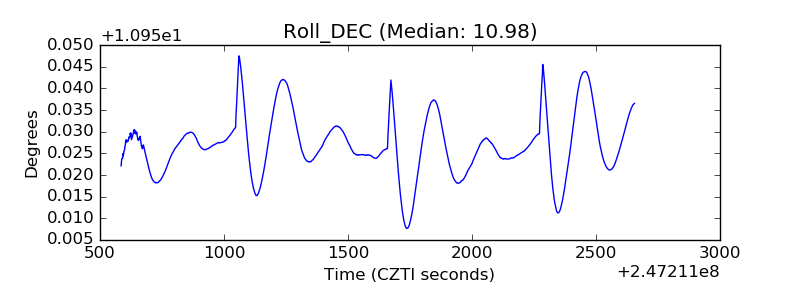 |
| _Roll_RA | 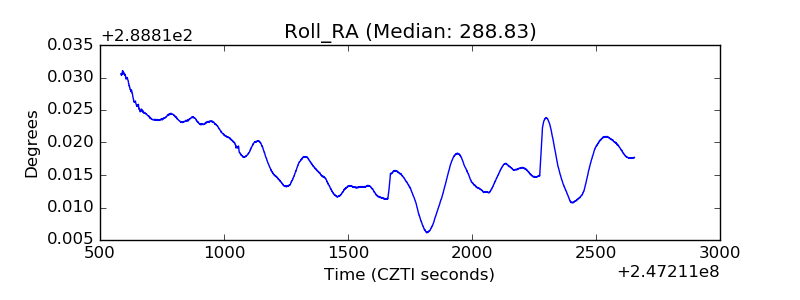 |
| Veto Counter | 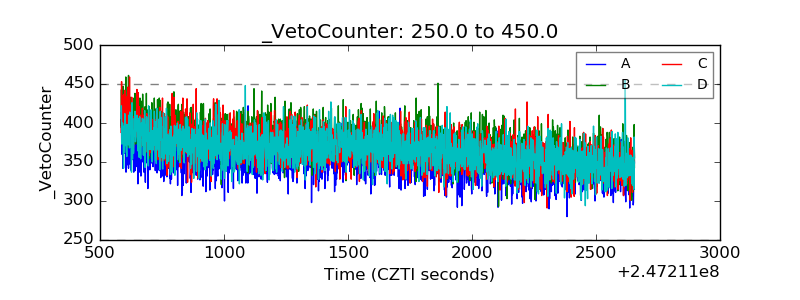 |