| Param | Original file | Final file |
|---|---|---|
| Filename | modeM0/AS1G08_044T01_9000001658cztM0_level2.fits | modeM0/AS1G08_044T01_9000001658cztM0_level2_quad_clean.evt |
| Size (bytes) | 139,829,760 | 125,827,200 |
| Size | 133.4 MB | 120.0 MB |
| Events in quadrant A | 843,568 | 760,581 |
| Events in quadrant B | 794,956 | 705,721 |
| Events in quadrant C | 841,566 | 730,684 |
| Events in quadrant D | 667,230 | 527,010 |
| Mode M0 | |||
|---|---|---|---|
| Quadrant | BADHDUFLAG | Total packets | Discarded packets |
| A | 0 | 35913 | 0 |
| B | 0 | 44863 | 0 |
| C | 0 | 32270 | 0 |
| D | 0 | 56530 | 0 |
| Mode SS | |||
|---|---|---|---|
| Quadrant | BADHDUFLAG | Total packets | Discarded packets |
| A | 0 | 320 | 0 |
| B | 0 | 320 | 0 |
| C | 0 | 320 | 0 |
| D | 0 | 320 | 0 |
| Mode M9 | |||
|---|---|---|---|
| Quadrant | BADHDUFLAG | Total packets | Discarded packets |
| A | 0 | 20 | 0 |
| B | 0 | 20 | 0 |
| C | 0 | 20 | 0 |
| D | 0 | 20 | 0 |
| Quadrant | Total seconds | Saturated seconds | Saturation percentage |
|---|---|---|---|
| A | 15740 | 489 | 3.106734% |
| B | 15740 | 1403 | 8.913596% |
| C | 15740 | 132 | 0.838628% |
| D | 15740 | 2582 | 16.404066% |
Noise dominated data is calculated using 1-second bins in cleaned event files. If a bin has >2000 counts, and if more than 50% of those come from <1% of pixels, then it is considered to be noise-dominated and hence unusable.
| Quadrant | # 1 sec bins | Bins with >0 counts | Bins with >2000 counts | High rate bins dominated by noise | Noise dominated (total time) | Noise dominated (detector-on time) | Marked lightcurve |
|---|---|---|---|---|---|---|---|
| A | 17690 | 15731 | 0 | 0 | 0.00% | 0.00% |  |
| B | 17690 | 15714 | 0 | 0 | 0.00% | 0.00% |  |
| C | 17690 | 15740 | 0 | 0 | 0.00% | 0.00% |  |
| D | 17690 | 15689 | 0 | 0 | 0.00% | 0.00% |  |
Top three noisy pixels from each quadrant. If the there are fewer than three noisy pixels in the level2.evt file, extra rows are filled as -1
| Pixel properties | Quadrant properties | ||||||
|---|---|---|---|---|---|---|---|
| Quadrant | DetID | PixID | Counts | Sigma | Mean | Median | Sigma |
| A | 0 | 29 | 804 | 10.29 | 219 | 204 | 58.3 |
| A | 7 | 110 | 662 | 7.86 | 219 | 204 | 58.3 |
| A | 0 | 30 | 627 | 7.26 | 219 | 204 | 58.3 |
| B | 2 | 9 | 688 | 11.1 | 209 | 199 | 44.1 |
| B | 3 | 17 | 564 | 8.29 | 209 | 199 | 44.1 |
| B | 2 | 8 | 558 | 8.15 | 209 | 199 | 44.1 |
| C | 12 | 241 | 625 | 7.04 | 222 | 205 | 59.6 |
| C | 9 | 233 | 578 | 6.25 | 222 | 205 | 59.6 |
| C | 7 | 111 | 548 | 5.75 | 222 | 205 | 59.6 |
| D | 3 | 31 | 483 | 5.85 | 190 | 172 | 53.1 |
| D | 1 | 31 | 476 | 5.72 | 190 | 172 | 53.1 |
| D | 6 | 67 | 472 | 5.65 | 190 | 172 | 53.1 |
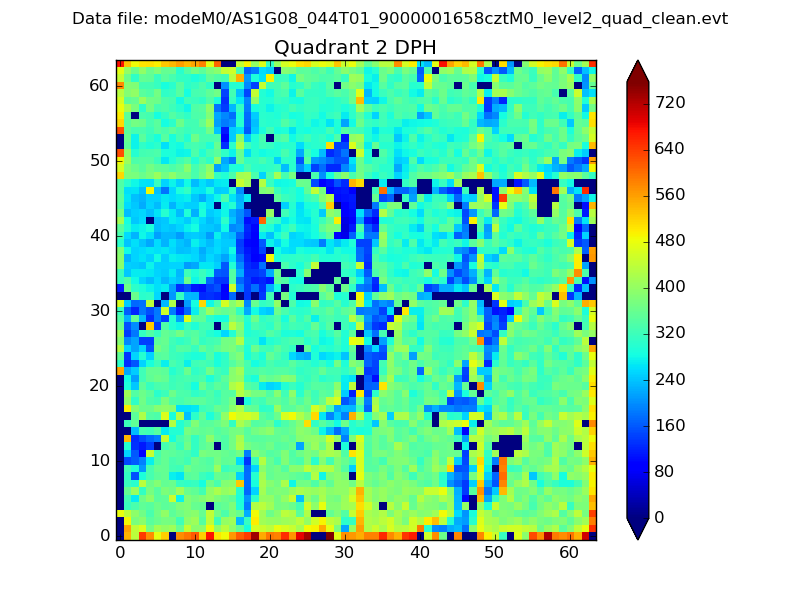
Histogram calculated using DETX and DETY for each event in the final _common_clean file
| Quadrant A |  |
 |
Quadrant B |
|---|---|---|---|
| Quadrant D | 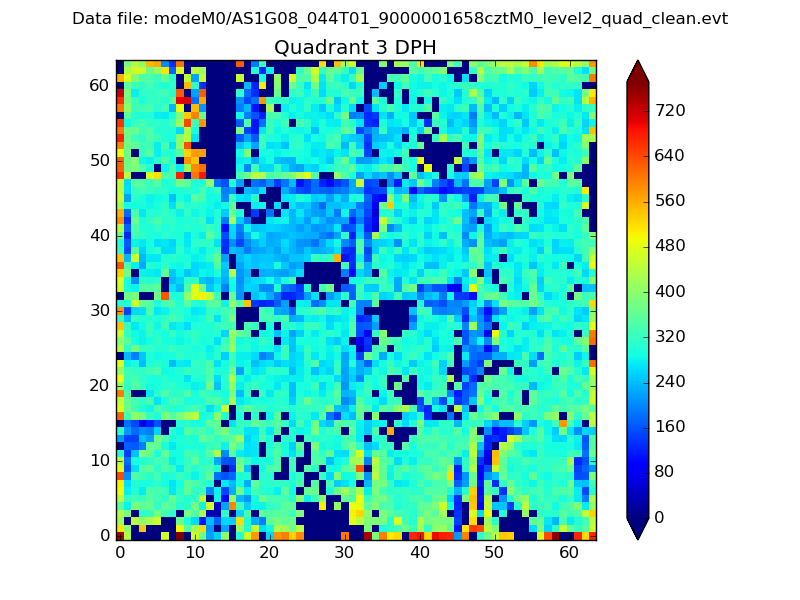 |
 |
Quadrant C |
| Plot type | Count rate plots | Images |
|---|---|---|
| Comparison with Poisson distribution Blue bars denote a histogram of data divided into 1 sec bins. Red curve is a Poisson curve with rate = median count rate of data. |
 |
 |
| Quadrant-wise count rates Data is divided into 100 sec bins |
 |
|
| Module-wise count rates for Quadrant A Data is divided into 100 sec bins |
 |
 |
| Module-wise count rates for Quadrant B Data is divided into 100 sec bins |
 |
 |
| Module-wise count rates for Quadrant C Data is divided into 100 sec bins |
 |
 |
| Module-wise count rates for Quadrant D Data is divided into 100 sec bins |
 |
 |
| Parameter | Plot |
|---|---|
| CZT HV Monitor |  |
| D_VDD | 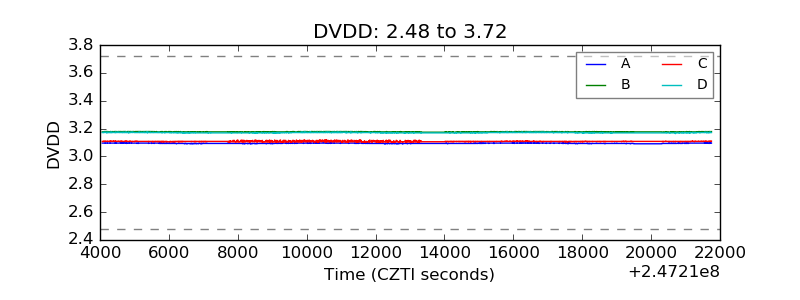 |
| Temperature 1 |  |
| Veto HV Monitor |  |
| Veto LLD |  |
| Alpha Counter |  |
| _CPM_Rate |  |
| CZT Counter |  |
| +2.5 Volts monitor |  |
| +5 Volts monitor |  |
| _ROLL_ROT |  |
| _Roll_DEC |  |
| _Roll_RA |  |
| Veto Counter |  |