| Param | Original file | Final file |
|---|---|---|
| Filename | modeM0/AS1G08_062T01_9000001660cztM0_level2.fits | modeM0/AS1G08_062T01_9000001660cztM0_level2_quad_clean.evt |
| Size (bytes) | 1,991,064,960 | 1,826,778,240 |
| Size | 1.9 GB | 1.7 GB |
| Events in quadrant A | 12,129,630 | 10,879,235 |
| Events in quadrant B | 11,361,116 | 9,972,510 |
| Events in quadrant C | 12,066,146 | 10,487,060 |
| Events in quadrant D | 9,753,466 | 9,012,689 |
| Mode M0 | |||
|---|---|---|---|
| Quadrant | BADHDUFLAG | Total packets | Discarded packets |
| A | 0 | 501293 | 0 |
| B | 0 | 608148 | 0 |
| C | 0 | 447235 | 0 |
| D | 0 | 678835 | 0 |
| Mode SS | |||
|---|---|---|---|
| Quadrant | BADHDUFLAG | Total packets | Discarded packets |
| A | 0 | 4442 | 0 |
| B | 0 | 4442 | 0 |
| C | 0 | 4442 | 0 |
| D | 0 | 4442 | 0 |
| Mode M9 | |||
|---|---|---|---|
| Quadrant | BADHDUFLAG | Total packets | Discarded packets |
| A | 0 | 336 | 0 |
| B | 0 | 336 | 0 |
| C | 0 | 336 | 0 |
| D | 0 | 336 | 0 |
| Quadrant | Total seconds | Saturated seconds | Saturation percentage |
|---|---|---|---|
| A | 218579 | 3538 | 1.618637% |
| B | 218579 | 17705 | 8.100046% |
| C | 218579 | 1453 | 0.664748% |
| D | 218579 | 24573 | 11.242160% |
Noise dominated data is calculated using 1-second bins in cleaned event files. If a bin has >2000 counts, and if more than 50% of those come from <1% of pixels, then it is considered to be noise-dominated and hence unusable.
| Quadrant | # 1 sec bins | Bins with >0 counts | Bins with >2000 counts | High rate bins dominated by noise | Noise dominated (total time) | Noise dominated (detector-on time) | Marked lightcurve |
|---|---|---|---|---|---|---|---|
| A | 251913 | 218581 | 0 | 0 | 0.00% | 0.00% |  |
| B | 251912 | 218460 | 0 | 0 | 0.00% | 0.00% |  |
| C | 251913 | 218581 | 0 | 0 | 0.00% | 0.00% |  |
| D | 251913 | 217094 | 0 | 0 | 0.00% | 0.00% |  |
Top three noisy pixels from each quadrant. If the there are fewer than three noisy pixels in the level2.evt file, extra rows are filled as -1
| Pixel properties | Quadrant properties | ||||||
|---|---|---|---|---|---|---|---|
| Quadrant | DetID | PixID | Counts | Sigma | Mean | Median | Sigma |
| A | 0 | 29 | 11808 | 11.24 | 3155 | 2943 | 788.7 |
| A | 7 | 110 | 10080 | 9.05 | 3155 | 2943 | 788.7 |
| A | 0 | 30 | 9069 | 7.77 | 3155 | 2943 | 788.7 |
| B | 2 | 9 | 9728 | 11.55 | 3001 | 2852 | 595.3 |
| B | 3 | 17 | 7656 | 8.07 | 3001 | 2852 | 595.3 |
| B | 14 | 254 | 7567 | 7.92 | 3001 | 2852 | 595.3 |
| C | 12 | 241 | 8579 | 6.78 | 3191 | 2961 | 828.5 |
| C | 2 | 191 | 8070 | 6.17 | 3191 | 2961 | 828.5 |
| C | 3 | 126 | 7956 | 6.03 | 3191 | 2961 | 828.5 |
| D | 3 | 14 | 7335 | 6.44 | 2784 | 2529 | 746.5 |
| D | 6 | 231 | 7205 | 6.26 | 2784 | 2529 | 746.5 |
| D | 7 | 5 | 6851 | 5.79 | 2784 | 2529 | 746.5 |
Histogram calculated using DETX and DETY for each event in the final _common_clean file
| Quadrant A |  |
 |
Quadrant B |
|---|---|---|---|
| Quadrant D |  |
 |
Quadrant C |
| Plot type | Count rate plots | Images |
|---|---|---|
| Comparison with Poisson distribution Blue bars denote a histogram of data divided into 1 sec bins. Red curve is a Poisson curve with rate = median count rate of data. |
 |
 |
| Quadrant-wise count rates Data is divided into 100 sec bins |
 |
|
| Module-wise count rates for Quadrant A Data is divided into 100 sec bins |
 |
 |
| Module-wise count rates for Quadrant B Data is divided into 100 sec bins |
 |
 |
| Module-wise count rates for Quadrant C Data is divided into 100 sec bins |
 |
 |
| Module-wise count rates for Quadrant D Data is divided into 100 sec bins |
 |
 |
| Parameter | Plot |
|---|---|
| CZT HV Monitor |  |
| D_VDD |  |
| Temperature 1 |  |
| Veto HV Monitor |  |
| Veto LLD |  |
| Alpha Counter |  |
| _CPM_Rate |  |
| CZT Counter |  |
| +2.5 Volts monitor |  |
| +5 Volts monitor |  |
| _ROLL_ROT | 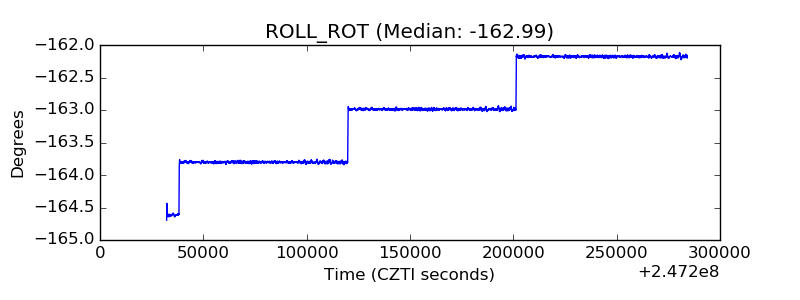 |
| _Roll_DEC |  |
| _Roll_RA |  |
| Veto Counter |  |