| Param | Original file | Final file |
|---|---|---|
| Filename | modeM0/AS1G08_062T01_9000001660_11330cztM0_level2.evt | modeM0/AS1G08_062T01_9000001660_11330cztM0_level2_quad_clean.evt |
| Size (bytes) | 526,190,400 | 89,251,200 |
| Size | 501.8 MB | 85.1 MB |
| Events in quadrant A | 3,164,256 | 582,664 |
| Events in quadrant B | 5,345,961 | 548,813 |
| Events in quadrant C | 2,878,039 | 578,940 |
| Events in quadrant D | 4,116,192 | 548,613 |
| Mode M0 | |||
|---|---|---|---|
| Quadrant | BADHDUFLAG | Total packets | Discarded packets |
| A | 0 | 13521 | 2 |
| B | 0 | 20204 | 1 |
| C | 0 | 12957 | 1 |
| D | 0 | 16571 | 1 |
| Mode SS | |||
|---|---|---|---|
| Quadrant | BADHDUFLAG | Total packets | Discarded packets |
| A | 0 | 128 | 0 |
| B | 0 | 128 | 0 |
| C | 0 | 128 | 0 |
| D | 0 | 128 | 0 |
| Mode M9 | |||
|---|---|---|---|
| Quadrant | BADHDUFLAG | Total packets | Discarded packets |
| A | 0 | 12 | 0 |
| B | 0 | 12 | 0 |
| C | 0 | 12 | 0 |
| D | 0 | 12 | 0 |
| Quadrant | Total seconds | Saturated seconds | Saturation percentage |
|---|---|---|---|
| A | 6360 | 57 | 0.896226% |
| B | 6360 | 684 | 10.754717% |
| C | 6360 | 14 | 0.220126% |
| D | 6360 | 172 | 2.704403% |
Noise dominated data is calculated using 1-second bins in cleaned event files. If a bin has >2000 counts, and if more than 50% of those come from <1% of pixels, then it is considered to be noise-dominated and hence unusable.
| Quadrant | # 1 sec bins | Bins with >0 counts | Bins with >2000 counts | High rate bins dominated by noise | Noise dominated (total time) | Noise dominated (detector-on time) | Marked lightcurve |
|---|---|---|---|---|---|---|---|
| A | 7500 | 6361 | 27 | 27 | 0.36% | 0.42% | 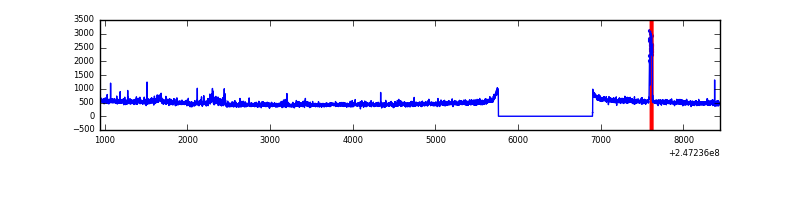 |
| B | 7500 | 6361 | 459 | 459 | 6.12% | 7.22% | 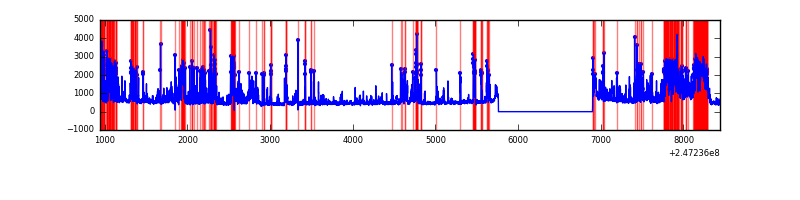 |
| C | 7500 | 6361 | 0 | 0 | 0.00% | 0.00% | 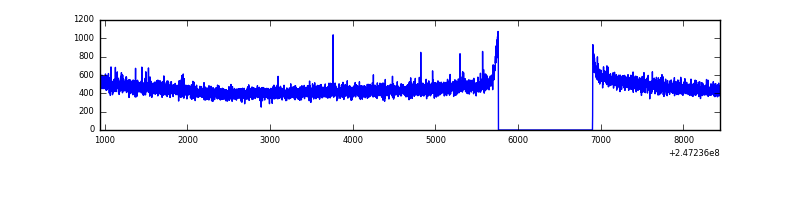 |
| D | 7500 | 6361 | 149 | 149 | 1.99% | 2.34% | 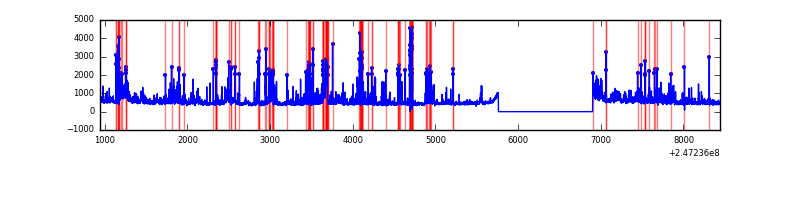 |
Top three noisy pixels from each quadrant. If the there are fewer than three noisy pixels in the level2.evt file, extra rows are filled as -1
| Pixel properties | Quadrant properties | ||||||
|---|---|---|---|---|---|---|---|
| Quadrant | DetID | PixID | Counts | Sigma | Mean | Median | Sigma |
| A | 8 | 15 | 98442 | 635.54 | 758 | 740 | 153.7 |
| A | 15 | 174 | 91194 | 588.39 | 758 | 740 | 153.7 |
| A | 1 | 162 | 19345 | 121.02 | 758 | 740 | 153.7 |
| B | 4 | 239 | 1459943 | 10589.48 | 730 | 712 | 137.8 |
| B | 3 | 64 | 899770 | 6524.37 | 730 | 712 | 137.8 |
| B | 15 | 204 | 36101 | 256.81 | 730 | 712 | 137.8 |
| C | 13 | 61 | 5451 | 27.6 | 736 | 741 | 170.6 |
| C | 9 | 54 | 3891 | 18.46 | 736 | 741 | 170.6 |
| C | 14 | 234 | 2011 | 7.44 | 736 | 741 | 170.6 |
| D | 1 | 52 | 451009 | 2604.87 | 730 | 711 | 172.9 |
| D | 2 | 120 | 292506 | 1687.97 | 730 | 711 | 172.9 |
| D | 10 | 253 | 153443 | 883.52 | 730 | 711 | 172.9 |
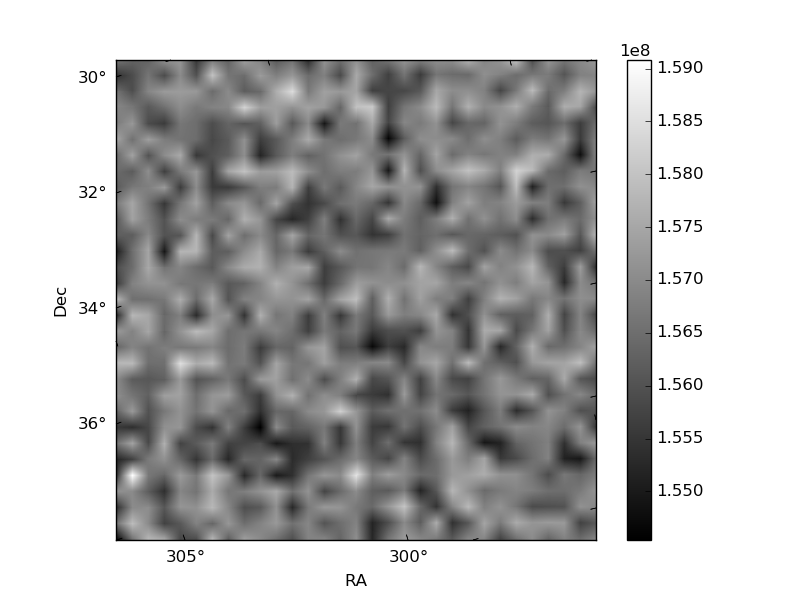
Histogram calculated using DETX and DETY for each event in the final _common_clean file
| Quadrant A |  |
 |
Quadrant B |
|---|---|---|---|
| Quadrant D |  |
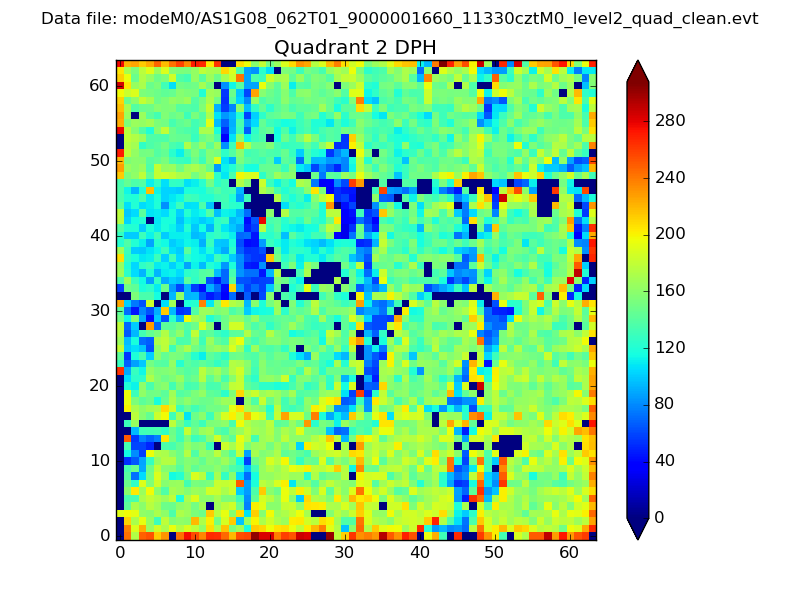 |
Quadrant C |
| Plot type | Count rate plots | Images |
|---|---|---|
| Comparison with Poisson distribution Blue bars denote a histogram of data divided into 1 sec bins. Red curve is a Poisson curve with rate = median count rate of data. |
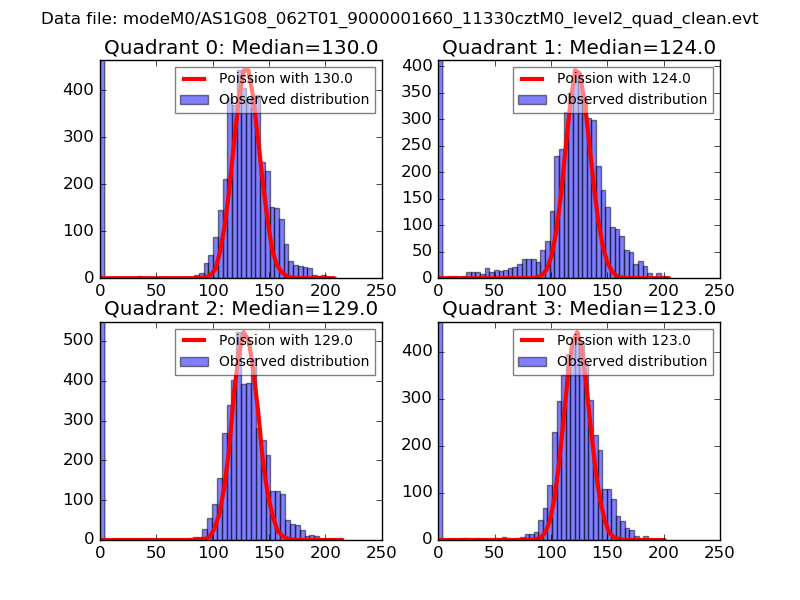 |
 |
| Quadrant-wise count rates Data is divided into 100 sec bins |
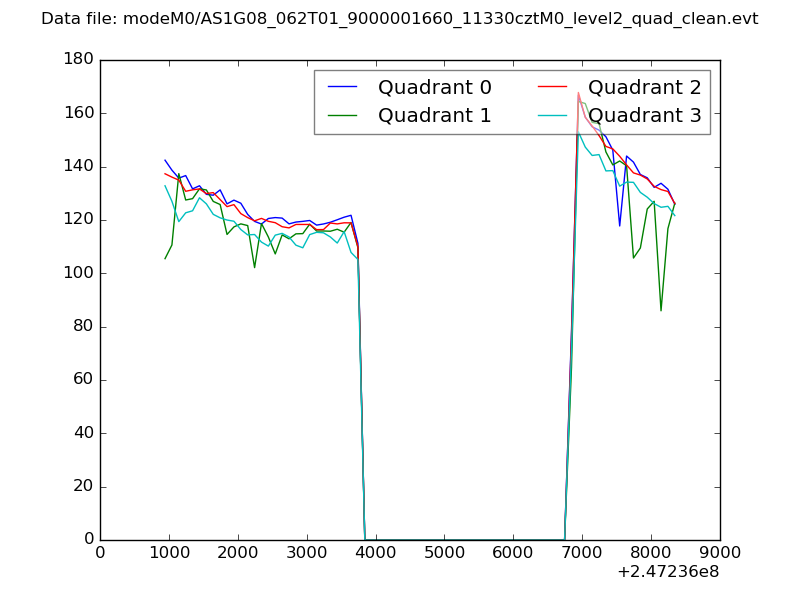 |
|
| Module-wise count rates for Quadrant A Data is divided into 100 sec bins |
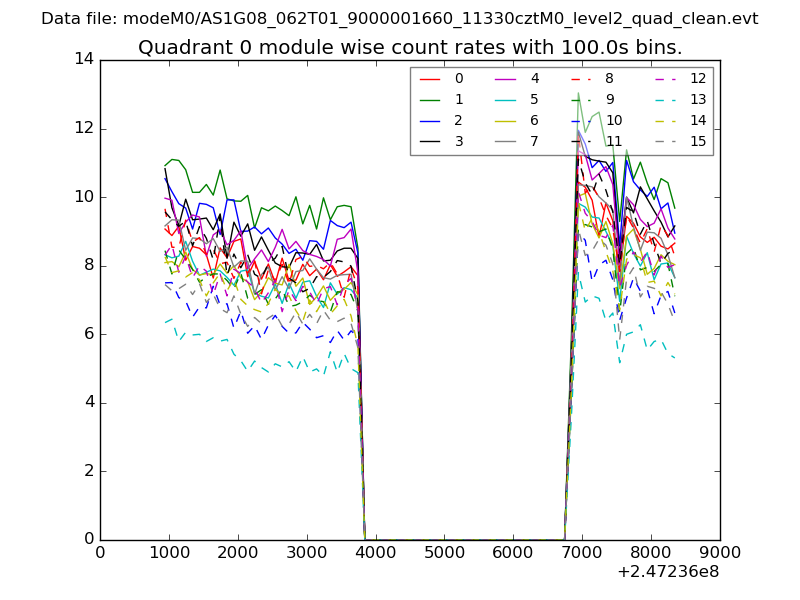 |
 |
| Module-wise count rates for Quadrant B Data is divided into 100 sec bins |
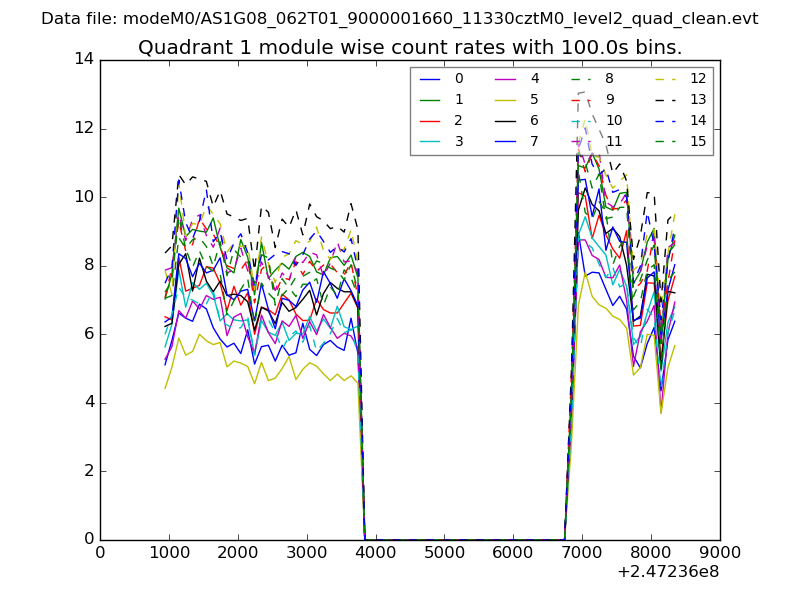 |
 |
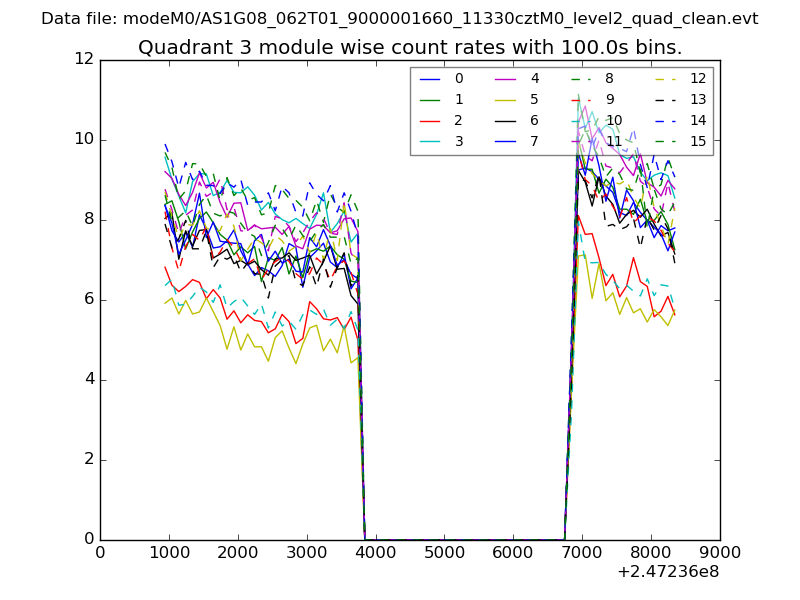
| Module-wise count rates for Quadrant C Data is divided into 100 sec bins |
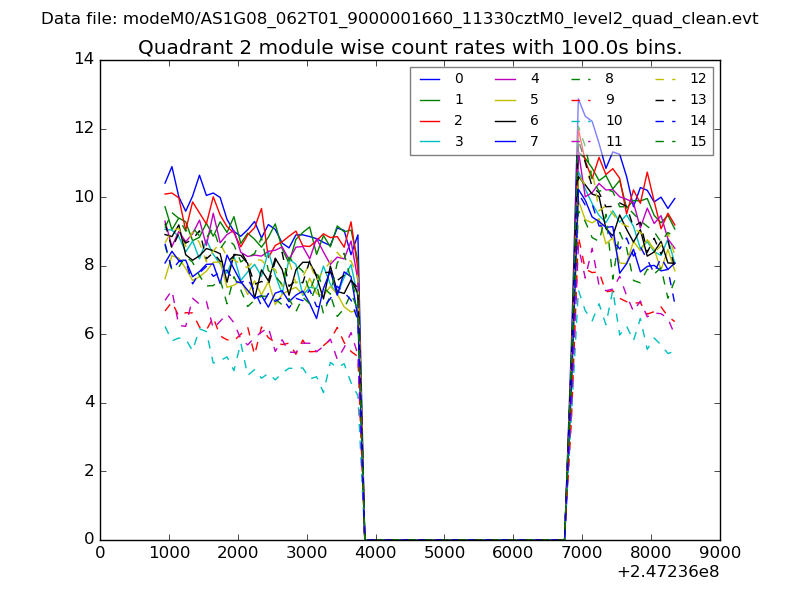 |
 |
| Module-wise count rates for Quadrant D Data is divided into 100 sec bins |
 |
 |
| Parameter | Plot |
|---|---|
| CZT HV Monitor | 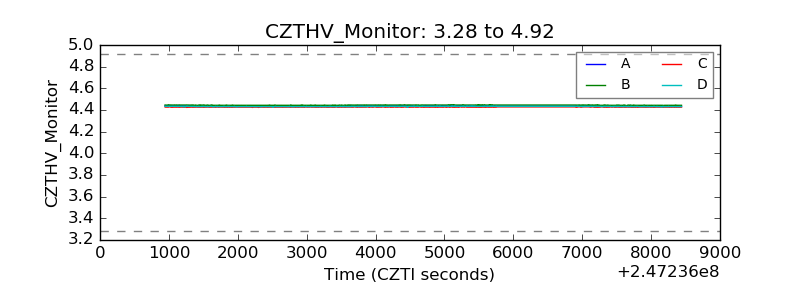 |
| D_VDD | 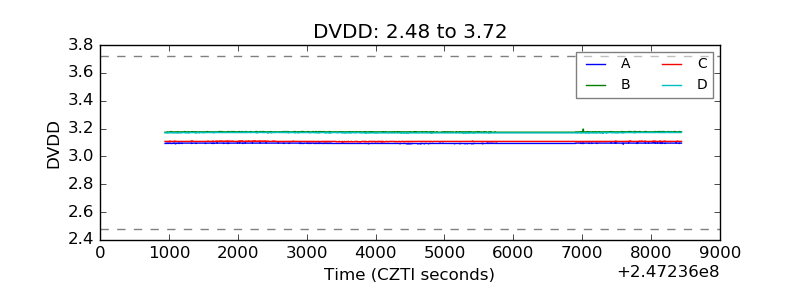 |
| Temperature 1 | 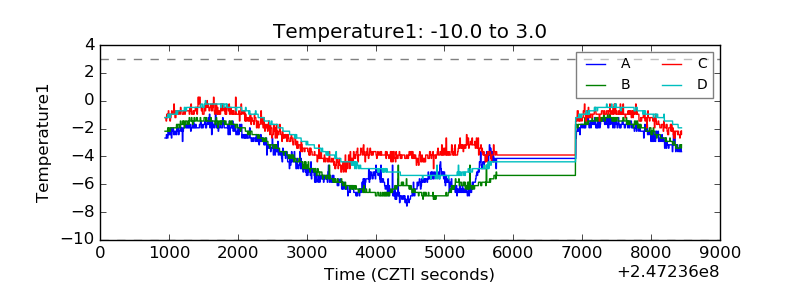 |
| Veto HV Monitor | 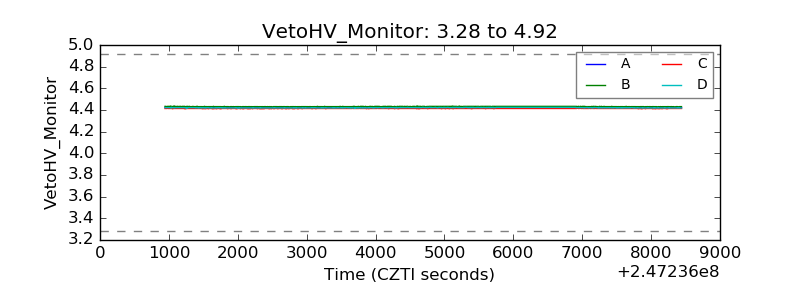 |
| Veto LLD | 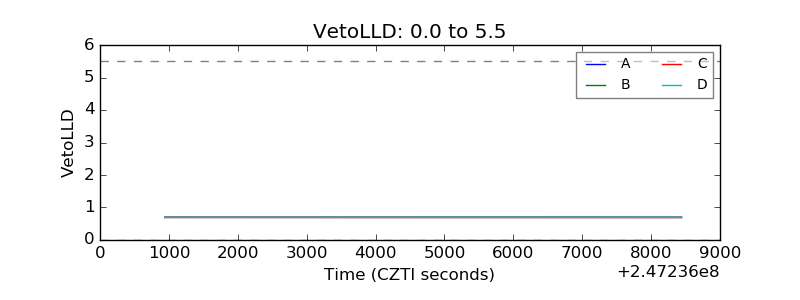 |
| Alpha Counter | 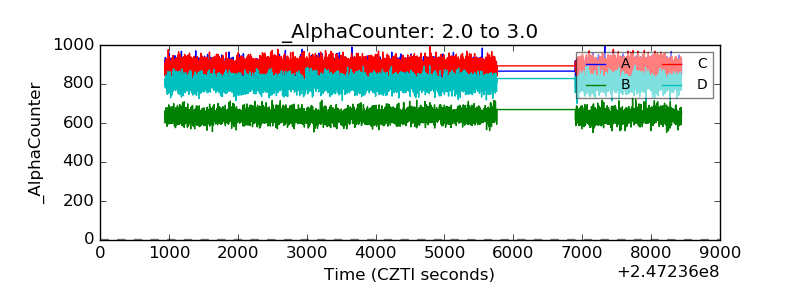 |
| _CPM_Rate | 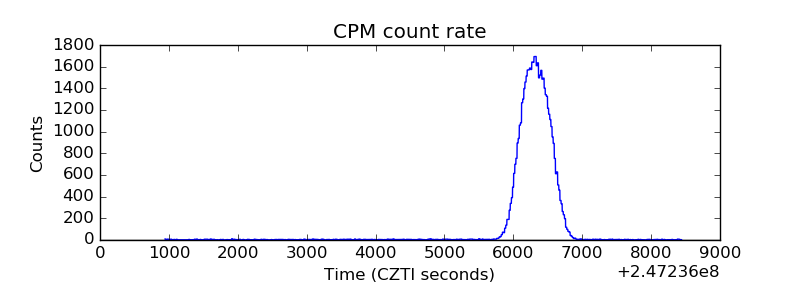 |
| CZT Counter |  |
| +2.5 Volts monitor |  |
| +5 Volts monitor |  |
| _ROLL_ROT | 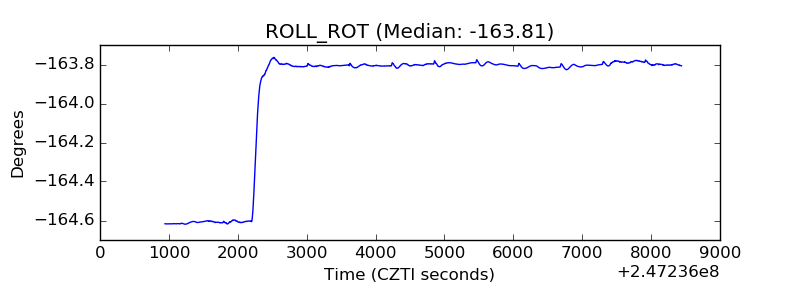 |
| _Roll_DEC | 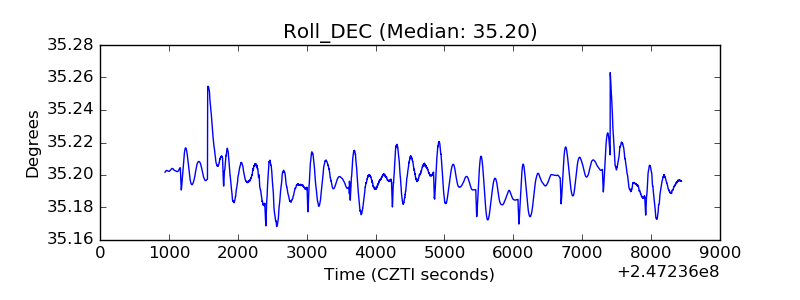 |
| _Roll_RA | 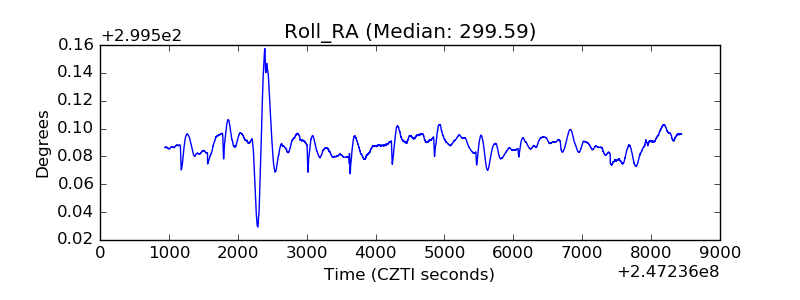 |
| Veto Counter | 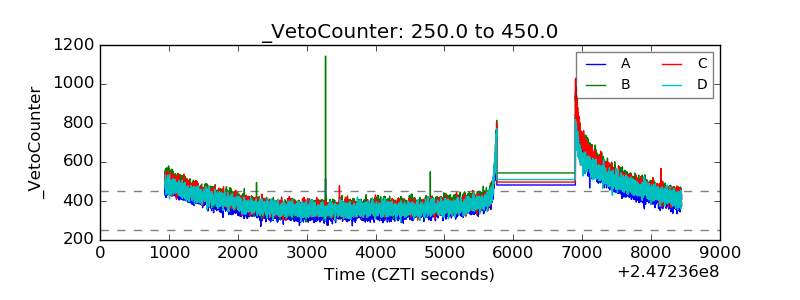 |