| Param | Original file | Final file |
|---|---|---|
| Filename | modeM0/AS1G08_062T01_9000001660_11331cztM0_level2.evt | modeM0/AS1G08_062T01_9000001660_11331cztM0_level2_quad_clean.evt |
| Size (bytes) | 517,665,600 | 90,498,240 |
| Size | 493.7 MB | 86.3 MB |
| Events in quadrant A | 3,181,880 | 592,914 |
| Events in quadrant B | 4,776,951 | 565,846 |
| Events in quadrant C | 2,959,665 | 591,465 |
| Events in quadrant D | 4,331,795 | 550,704 |
| Mode M0 | |||
|---|---|---|---|
| Quadrant | BADHDUFLAG | Total packets | Discarded packets |
| A | 0 | 13429 | 2 |
| B | 0 | 18363 | 1 |
| C | 0 | 12951 | 1 |
| D | 0 | 17200 | 1 |
| Mode SS | |||
|---|---|---|---|
| Quadrant | BADHDUFLAG | Total packets | Discarded packets |
| A | 0 | 128 | 0 |
| B | 0 | 128 | 0 |
| C | 0 | 128 | 0 |
| D | 0 | 128 | 0 |
| Mode M9 | |||
|---|---|---|---|
| Quadrant | BADHDUFLAG | Total packets | Discarded packets |
| A | 0 | 12 | 0 |
| B | 0 | 12 | 0 |
| C | 0 | 12 | 0 |
| D | 0 | 12 | 0 |
| Quadrant | Total seconds | Saturated seconds | Saturation percentage |
|---|---|---|---|
| A | 6296 | 60 | 0.952986% |
| B | 6296 | 514 | 8.163914% |
| C | 6296 | 20 | 0.317662% |
| D | 6296 | 333 | 5.289072% |
Noise dominated data is calculated using 1-second bins in cleaned event files. If a bin has >2000 counts, and if more than 50% of those come from <1% of pixels, then it is considered to be noise-dominated and hence unusable.
| Quadrant | # 1 sec bins | Bins with >0 counts | Bins with >2000 counts | High rate bins dominated by noise | Noise dominated (total time) | Noise dominated (detector-on time) | Marked lightcurve |
|---|---|---|---|---|---|---|---|
| A | 7541 | 6297 | 27 | 27 | 0.36% | 0.43% | 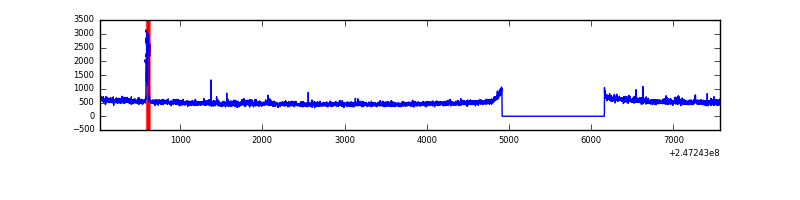 |
| B | 7541 | 6297 | 367 | 367 | 4.87% | 5.83% | 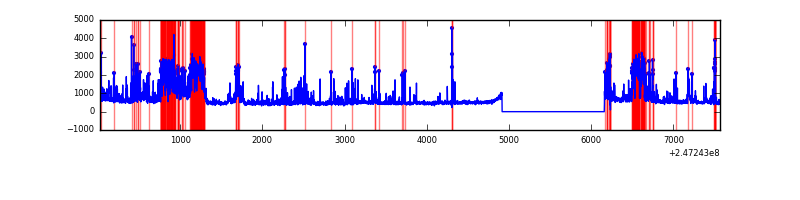 |
| C | 7541 | 6297 | 1 | 1 | 0.01% | 0.02% | 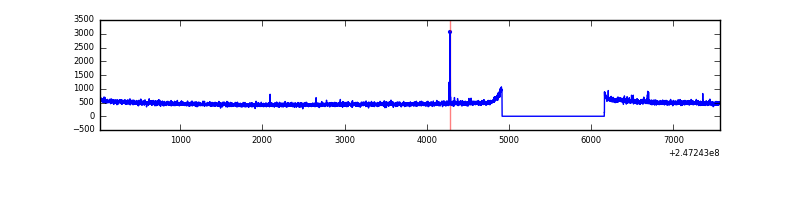 |
| D | 7541 | 6297 | 255 | 255 | 3.38% | 4.05% | 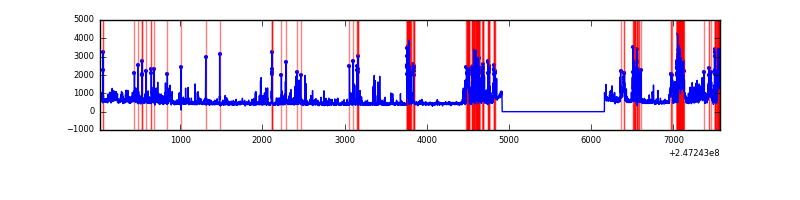 |
Top three noisy pixels from each quadrant. If the there are fewer than three noisy pixels in the level2.evt file, extra rows are filled as -1
| Pixel properties | Quadrant properties | ||||||
|---|---|---|---|---|---|---|---|
| Quadrant | DetID | PixID | Counts | Sigma | Mean | Median | Sigma |
| A | 15 | 174 | 81049 | 514.35 | 772 | 756 | 156.1 |
| A | 8 | 15 | 71308 | 451.95 | 772 | 756 | 156.1 |
| A | 1 | 162 | 22741 | 140.83 | 772 | 756 | 156.1 |
| B | 4 | 239 | 1326048 | 9473.95 | 750 | 734 | 139.9 |
| B | 3 | 64 | 406587 | 2901.22 | 750 | 734 | 139.9 |
| B | 15 | 204 | 58553 | 413.32 | 750 | 734 | 139.9 |
| C | 9 | 54 | 17428 | 95.97 | 754 | 757 | 173.7 |
| C | 13 | 61 | 5551 | 27.6 | 754 | 757 | 173.7 |
| C | 0 | 207 | 2693 | 11.15 | 754 | 757 | 173.7 |
| D | 13 | 152 | 560019 | 3187.58 | 739 | 720 | 175.5 |
| D | 13 | 104 | 395650 | 2250.8 | 739 | 720 | 175.5 |
| D | 2 | 120 | 275226 | 1564.47 | 739 | 720 | 175.5 |
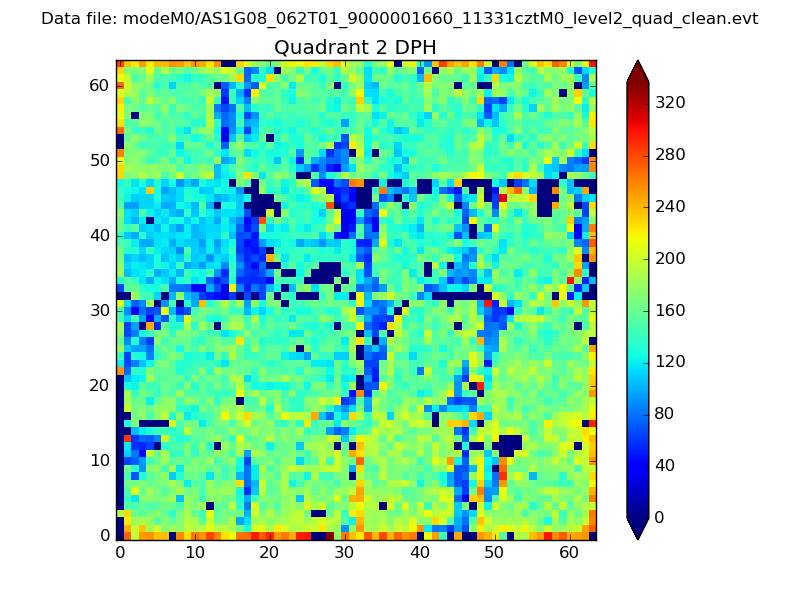
Histogram calculated using DETX and DETY for each event in the final _common_clean file
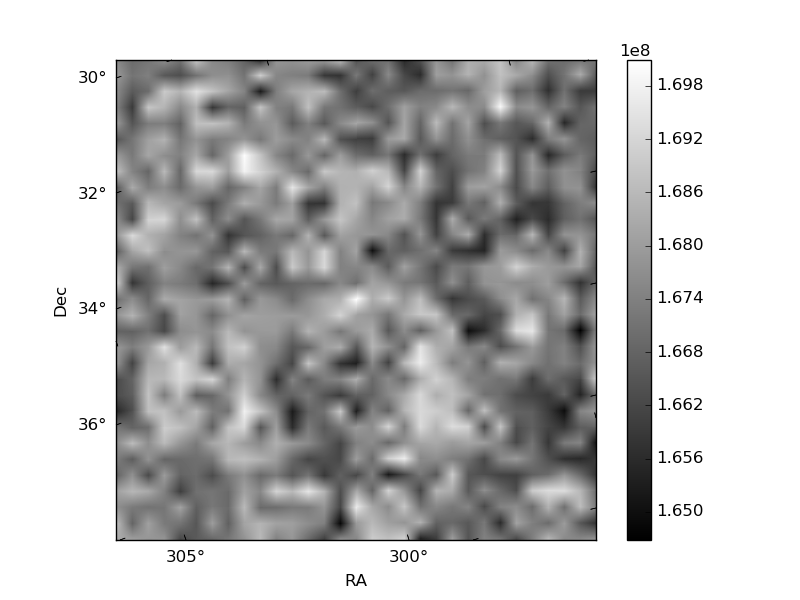
| Quadrant A | 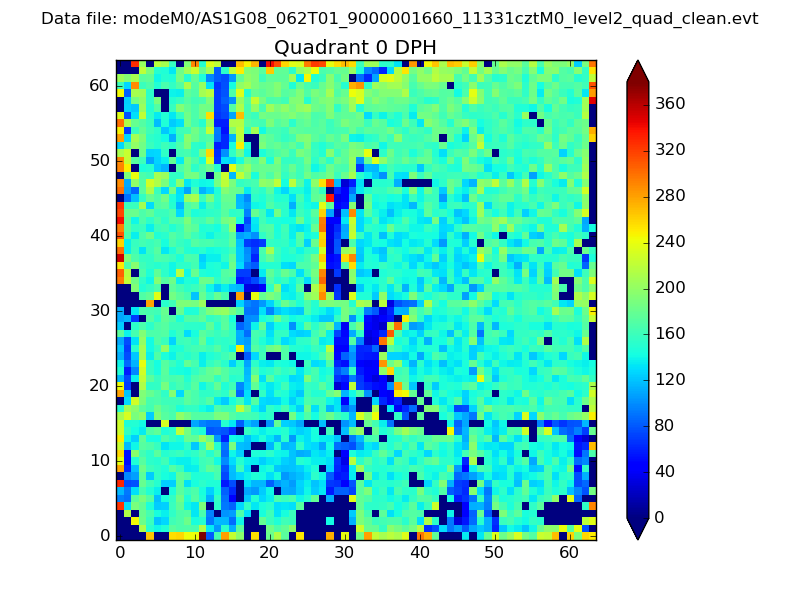 |
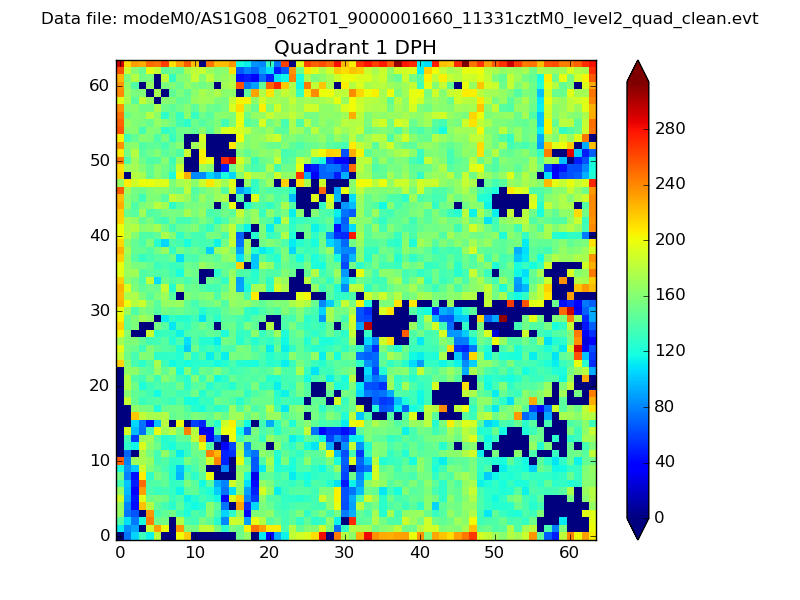 |
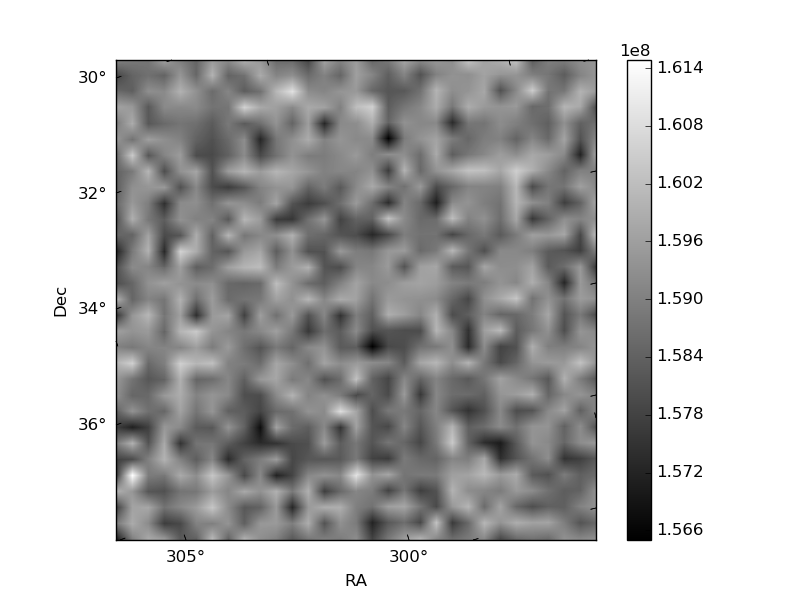
Quadrant B |
|---|---|---|---|
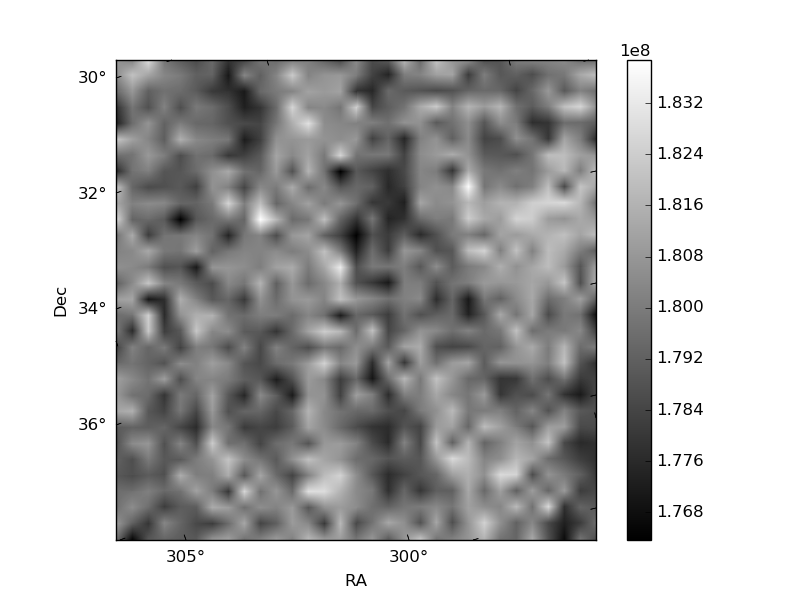
| Quadrant D | 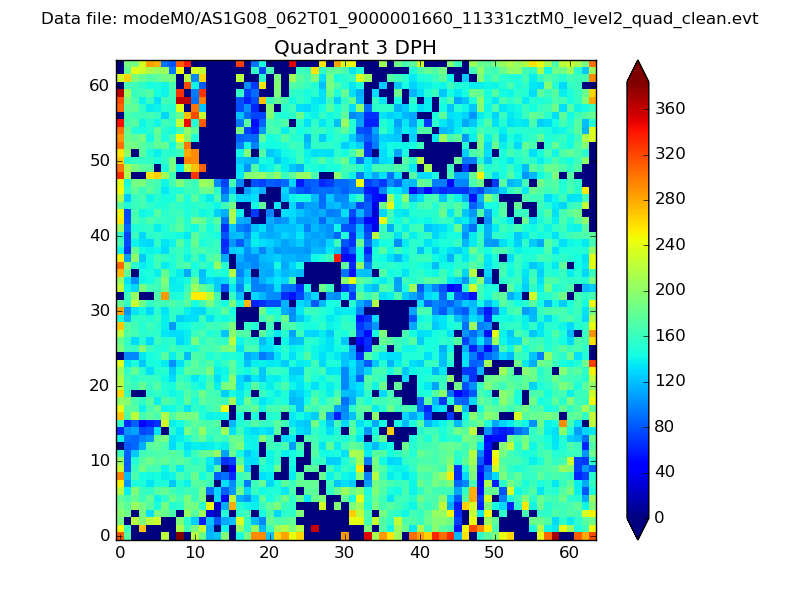 |
 |
Quadrant C |
| Plot type | Count rate plots | Images |
|---|---|---|
| Comparison with Poisson distribution Blue bars denote a histogram of data divided into 1 sec bins. Red curve is a Poisson curve with rate = median count rate of data. |
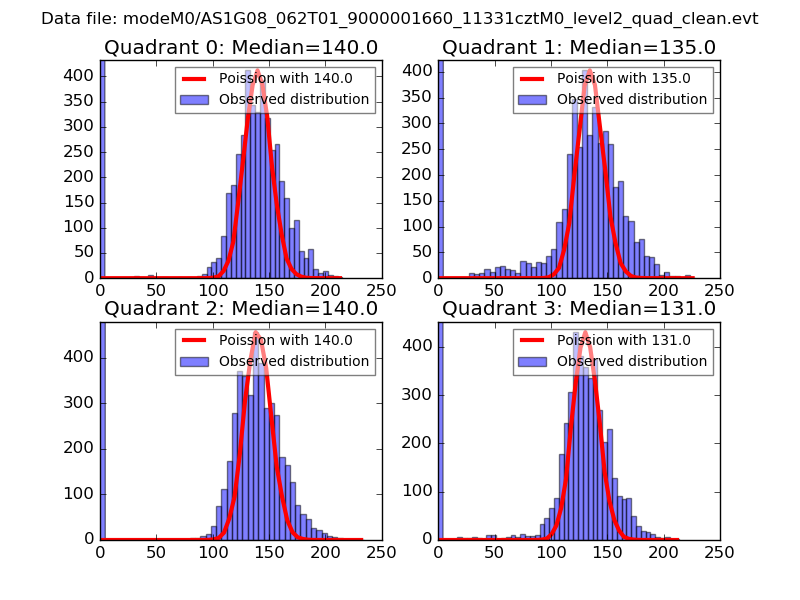 |
 |
| Quadrant-wise count rates Data is divided into 100 sec bins |
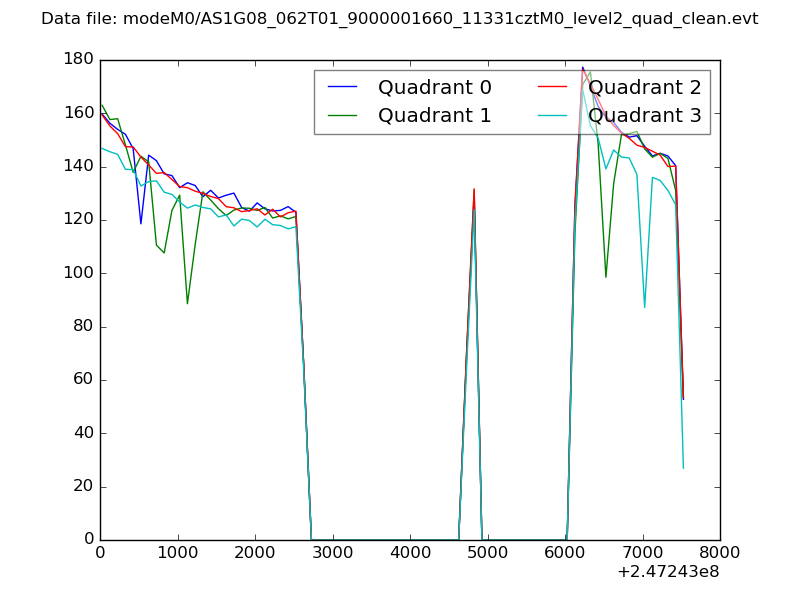 |
|
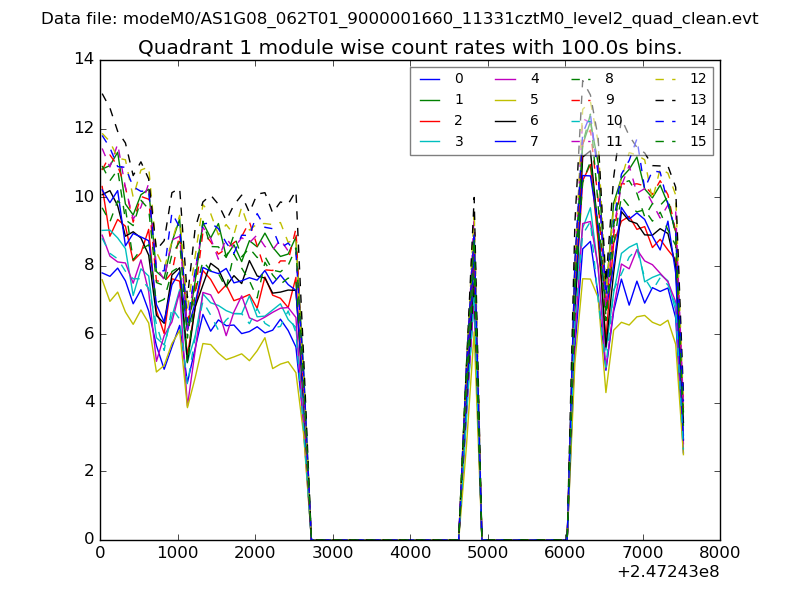
| Module-wise count rates for Quadrant A Data is divided into 100 sec bins |
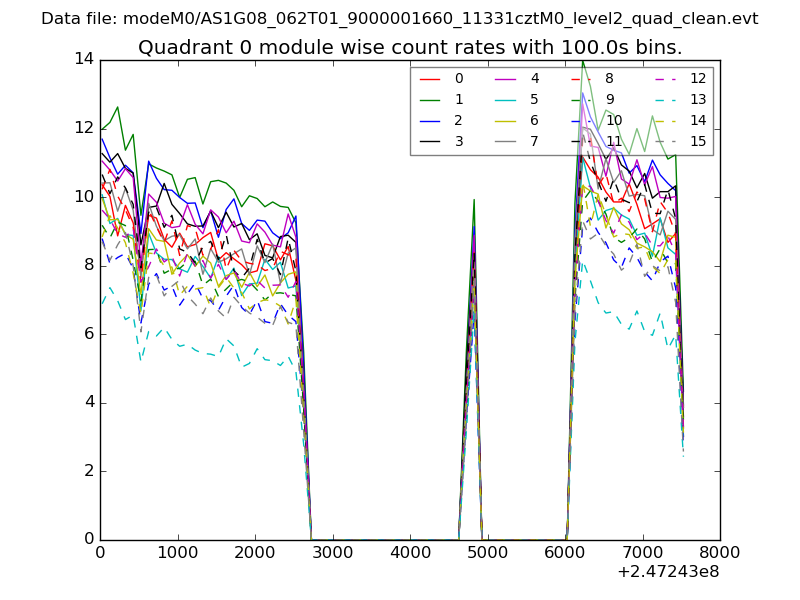 |
 |
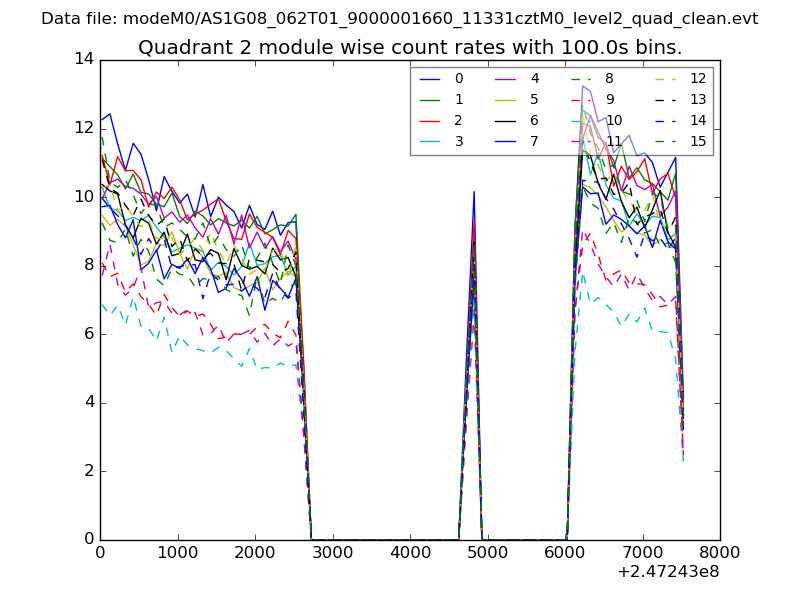
| Module-wise count rates for Quadrant B Data is divided into 100 sec bins |
 |
 |
| Module-wise count rates for Quadrant C Data is divided into 100 sec bins |
 |
 |
| Module-wise count rates for Quadrant D Data is divided into 100 sec bins |
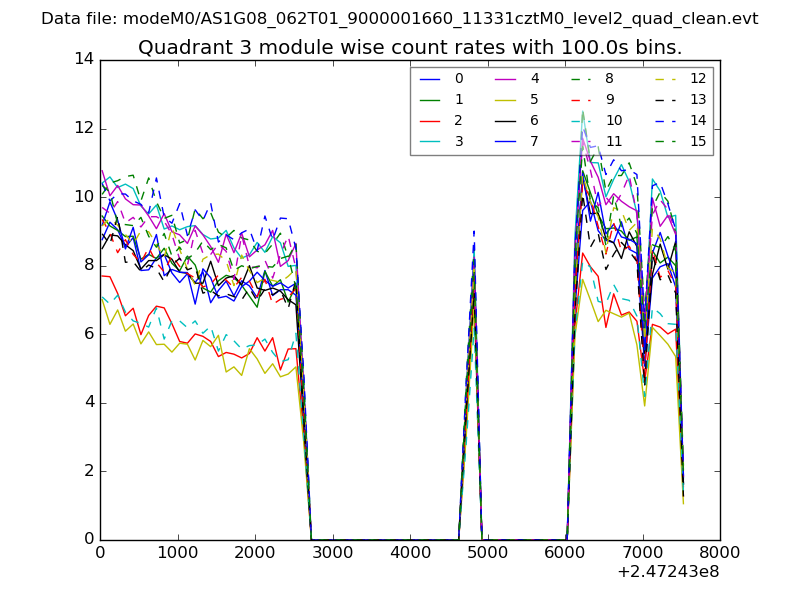 |
 |
| Parameter | Plot |
|---|---|
| CZT HV Monitor | 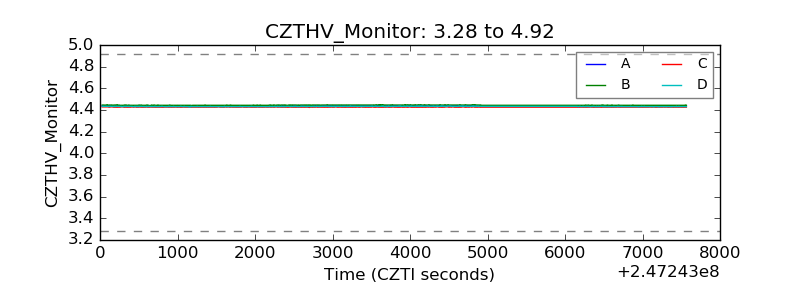 |
| D_VDD |  |
| Temperature 1 | 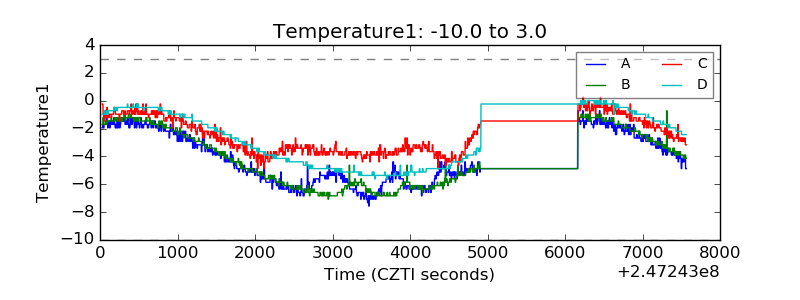 |
| Veto HV Monitor | 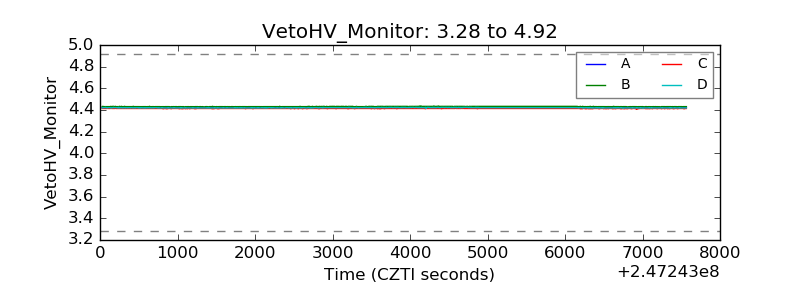 |
| Veto LLD | 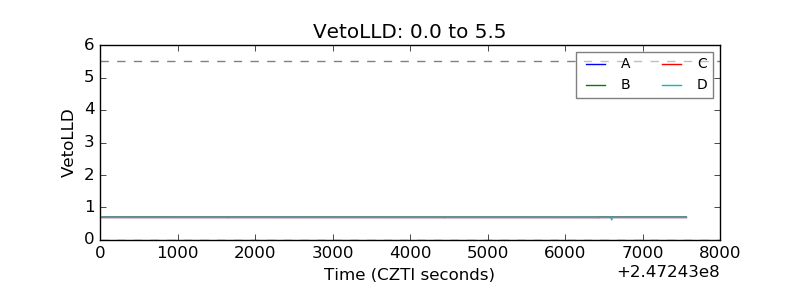 |
| Alpha Counter | 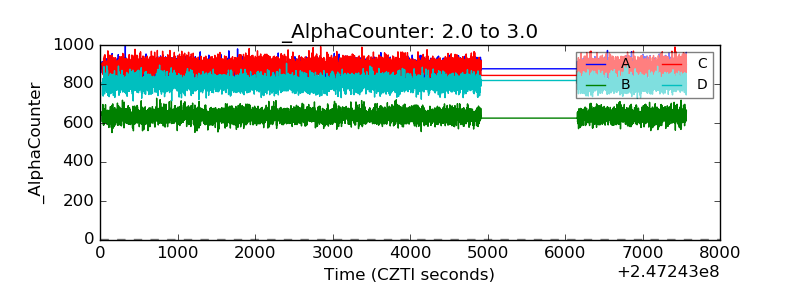 |
| _CPM_Rate | 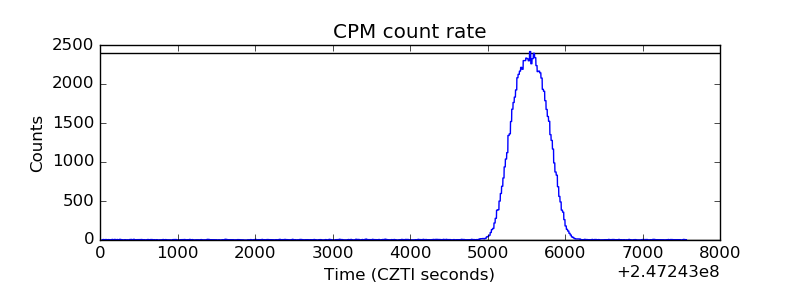 |
| CZT Counter | 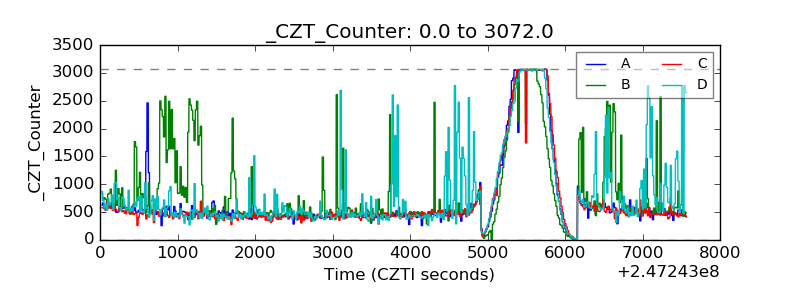 |
| +2.5 Volts monitor |  |
| +5 Volts monitor | 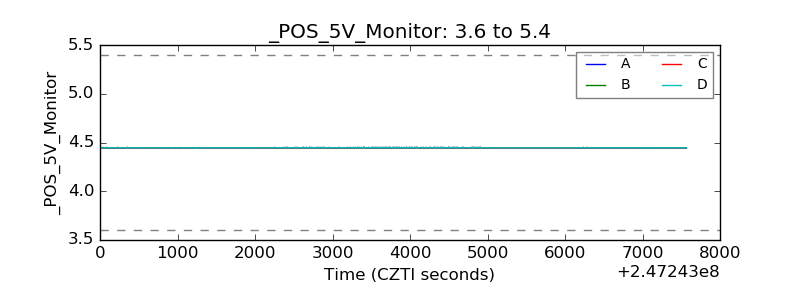 |
| _ROLL_ROT | 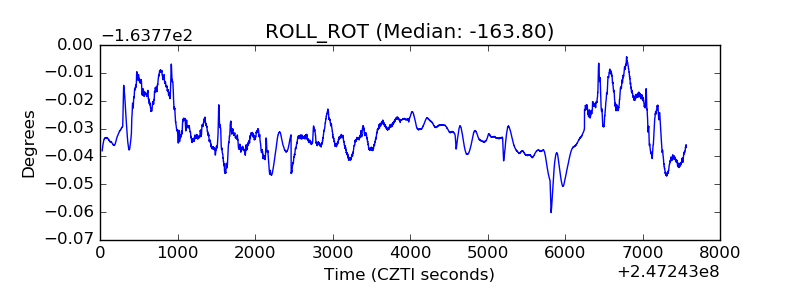 |
| _Roll_DEC | 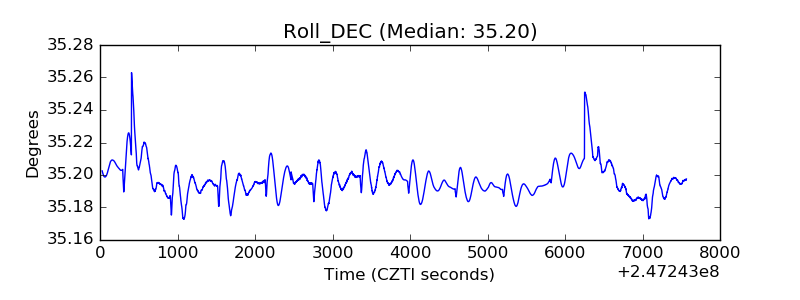 |
| _Roll_RA |  |
| Veto Counter | 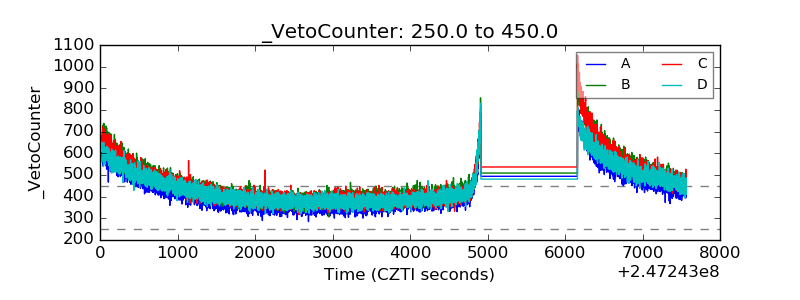 |