| Param | Original file | Final file |
|---|---|---|
| Filename | modeM0/AS1G08_062T01_9000001660_11332cztM0_level2.evt | modeM0/AS1G08_062T01_9000001660_11332cztM0_level2_quad_clean.evt |
| Size (bytes) | 577,883,520 | 88,787,520 |
| Size | 551.1 MB | 84.7 MB |
| Events in quadrant A | 3,166,530 | 595,469 |
| Events in quadrant B | 5,552,256 | 532,336 |
| Events in quadrant C | 2,964,175 | 597,005 |
| Events in quadrant D | 5,400,952 | 533,502 |
| Mode M0 | |||
|---|---|---|---|
| Quadrant | BADHDUFLAG | Total packets | Discarded packets |
| A | 0 | 13268 | 2 |
| B | 0 | 20475 | 1 |
| C | 0 | 12736 | 1 |
| D | 0 | 20056 | 1 |
| Mode SS | |||
|---|---|---|---|
| Quadrant | BADHDUFLAG | Total packets | Discarded packets |
| A | 0 | 126 | 0 |
| B | 0 | 126 | 0 |
| C | 0 | 126 | 0 |
| D | 0 | 126 | 0 |
| Mode M9 | |||
|---|---|---|---|
| Quadrant | BADHDUFLAG | Total packets | Discarded packets |
| A | 0 | 13 | 0 |
| B | 0 | 13 | 0 |
| C | 0 | 13 | 0 |
| D | 0 | 13 | 0 |
| Quadrant | Total seconds | Saturated seconds | Saturation percentage |
|---|---|---|---|
| A | 6155 | 61 | 0.991064% |
| B | 6155 | 999 | 16.230707% |
| C | 6155 | 40 | 0.649878% |
| D | 6155 | 712 | 11.567831% |
Noise dominated data is calculated using 1-second bins in cleaned event files. If a bin has >2000 counts, and if more than 50% of those come from <1% of pixels, then it is considered to be noise-dominated and hence unusable.
| Quadrant | # 1 sec bins | Bins with >0 counts | Bins with >2000 counts | High rate bins dominated by noise | Noise dominated (total time) | Noise dominated (detector-on time) | Marked lightcurve |
|---|---|---|---|---|---|---|---|
| A | 7455 | 6156 | 1 | 1 | 0.01% | 0.02% | 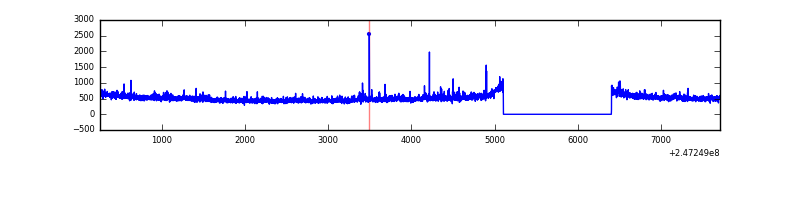 |
| B | 7455 | 6156 | 744 | 744 | 9.98% | 12.09% | 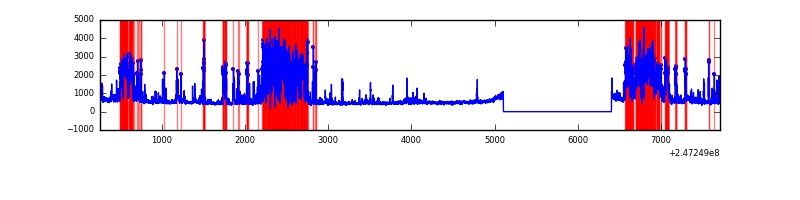 |
| C | 7455 | 6156 | 0 | 0 | 0.00% | 0.00% | 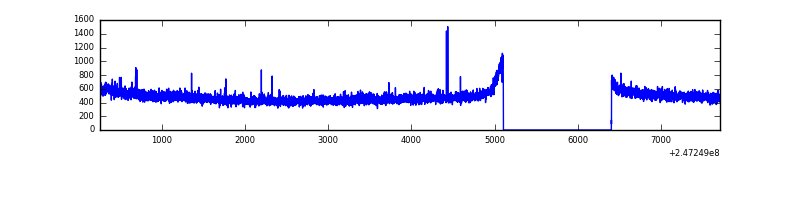 |
| D | 7455 | 6156 | 583 | 583 | 7.82% | 9.47% | 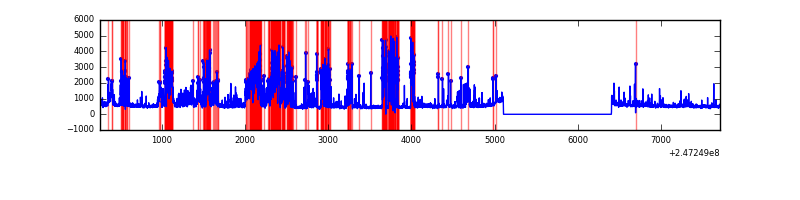 |
Top three noisy pixels from each quadrant. If the there are fewer than three noisy pixels in the level2.evt file, extra rows are filled as -1
| Pixel properties | Quadrant properties | ||||||
|---|---|---|---|---|---|---|---|
| Quadrant | DetID | PixID | Counts | Sigma | Mean | Median | Sigma |
| A | 13 | 251 | 73308 | 468.61 | 769 | 754 | 154.8 |
| A | 8 | 15 | 50644 | 322.23 | 769 | 754 | 154.8 |
| A | 1 | 162 | 30951 | 195.03 | 769 | 754 | 154.8 |
| B | 3 | 64 | 1922526 | 14334.47 | 715 | 697 | 134.1 |
| B | 4 | 239 | 672954 | 5014.21 | 715 | 697 | 134.1 |
| B | 3 | 189 | 68205 | 503.53 | 715 | 697 | 134.1 |
| C | 13 | 61 | 5623 | 27.88 | 757 | 762 | 174.3 |
| C | 9 | 54 | 5313 | 26.1 | 757 | 762 | 174.3 |
| C | 14 | 234 | 3814 | 17.51 | 757 | 762 | 174.3 |
| D | 5 | 222 | 781937 | 4600.76 | 710 | 692 | 169.8 |
| D | 13 | 104 | 536944 | 3158.0 | 710 | 692 | 169.8 |
| D | 10 | 253 | 512492 | 3014.0 | 710 | 692 | 169.8 |
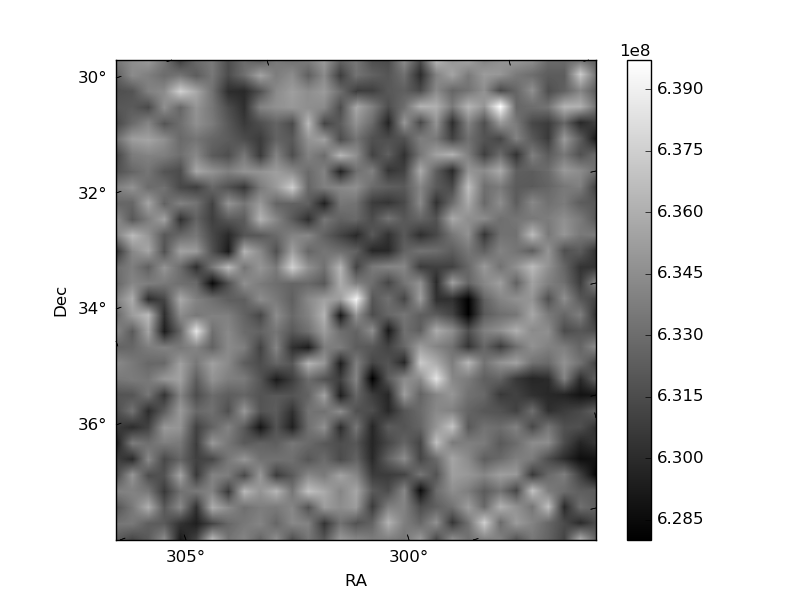
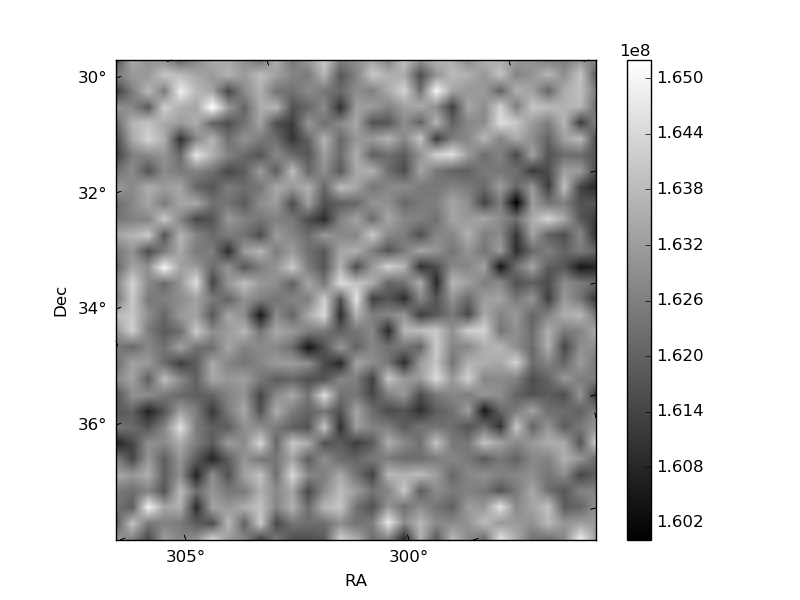
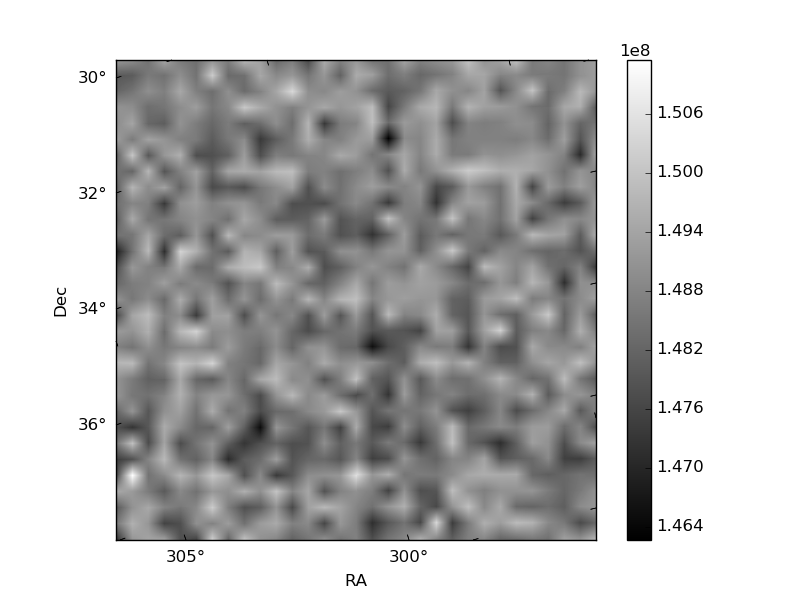
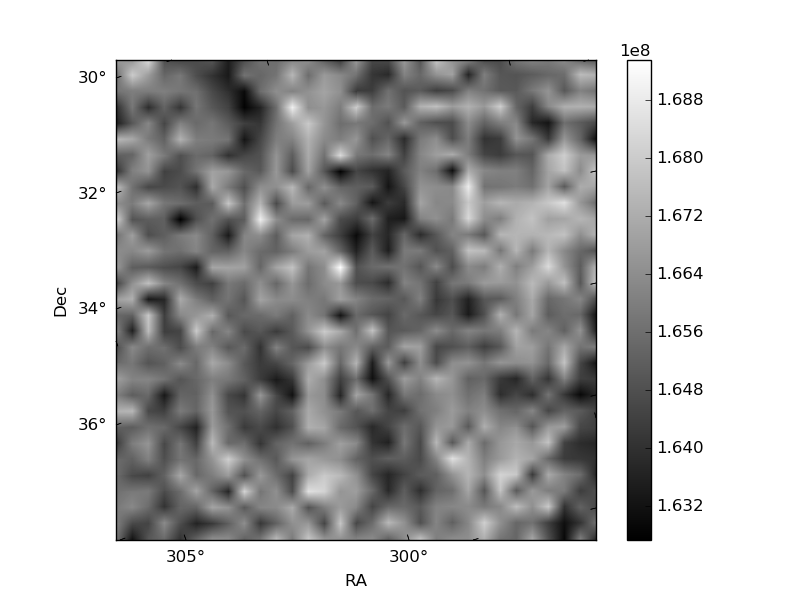
Histogram calculated using DETX and DETY for each event in the final _common_clean file
| Quadrant A | 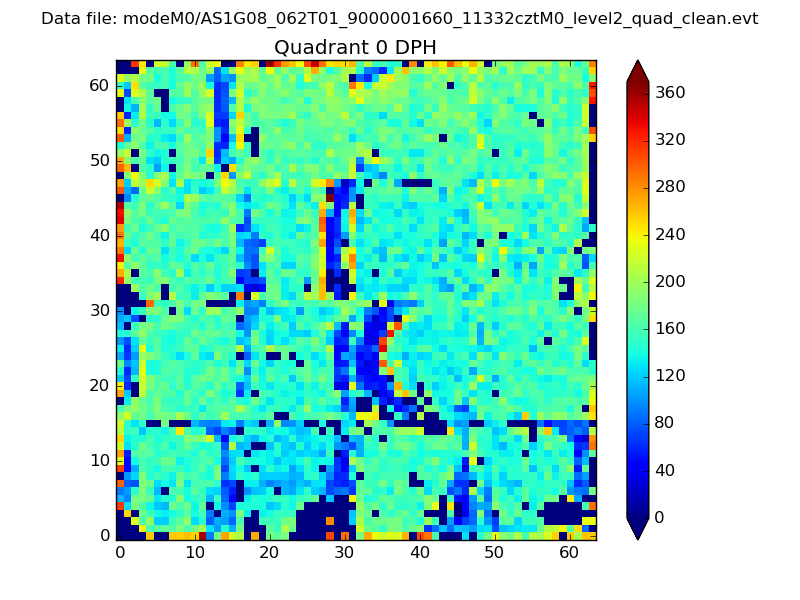 |
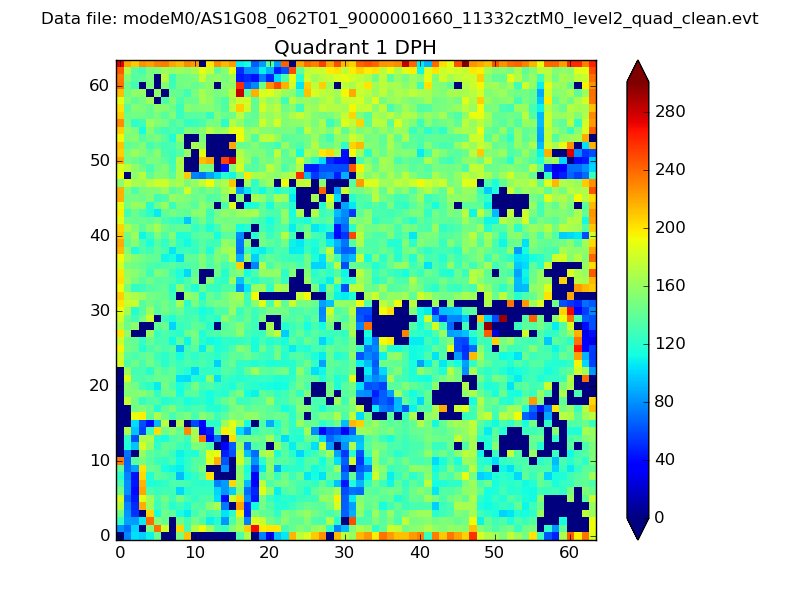 |
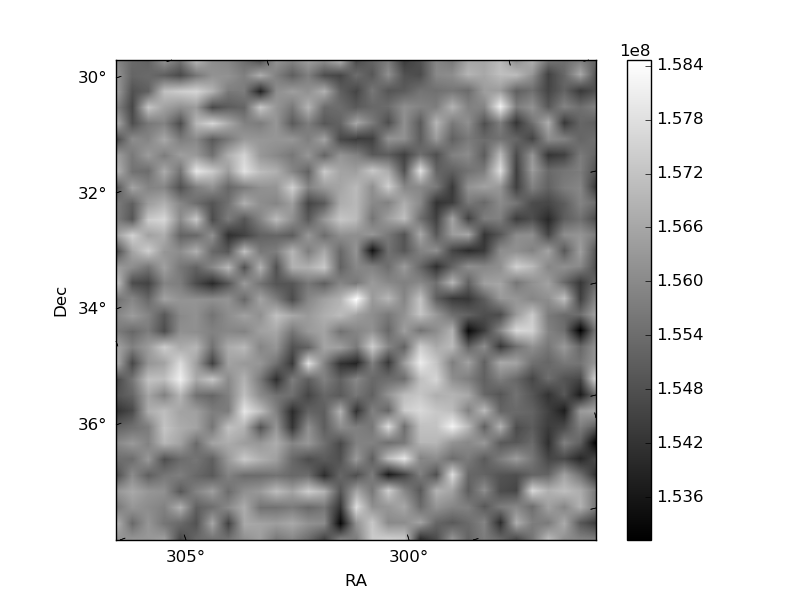
Quadrant B |
|---|---|---|---|
| Quadrant D | 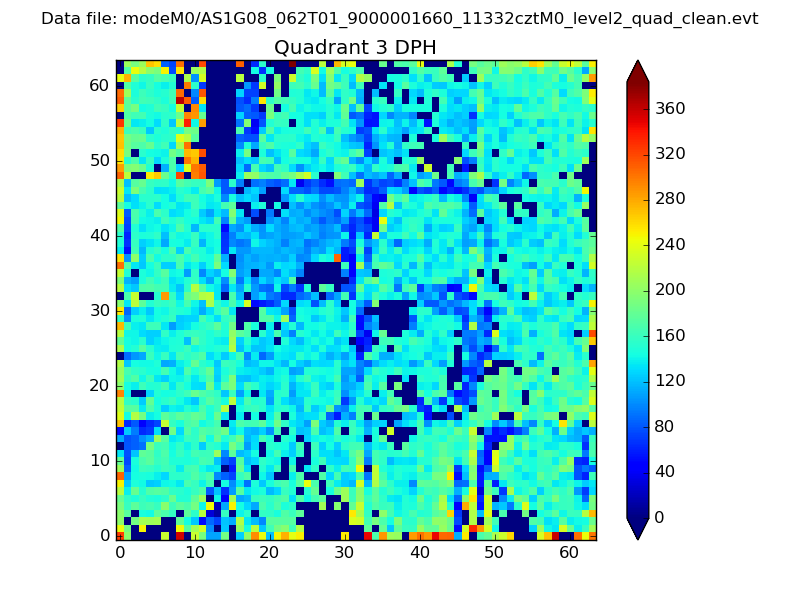 |
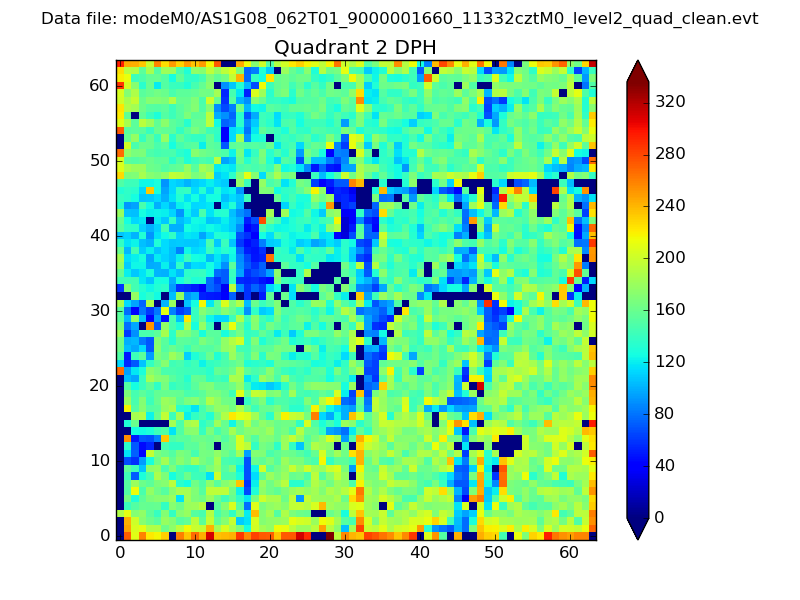 |
Quadrant C |
| Plot type | Count rate plots | Images |
|---|---|---|
| Comparison with Poisson distribution Blue bars denote a histogram of data divided into 1 sec bins. Red curve is a Poisson curve with rate = median count rate of data. |
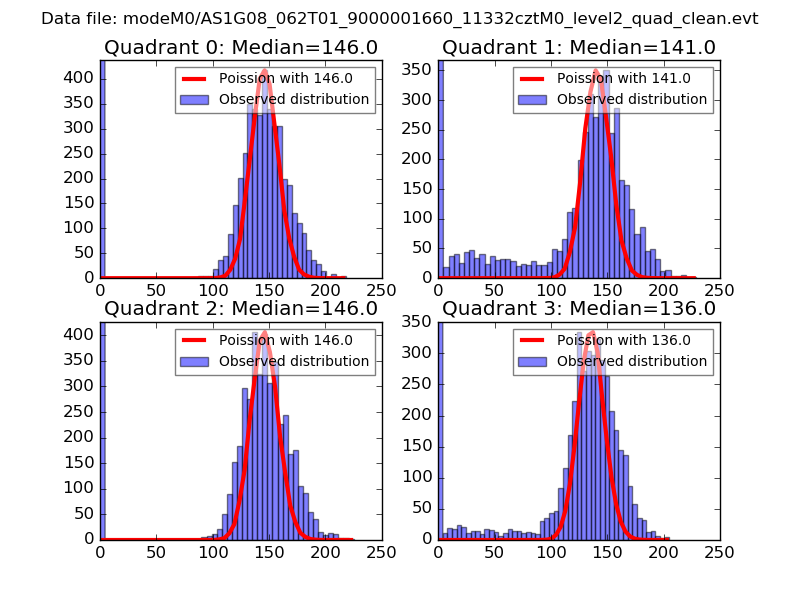 |
 |
| Quadrant-wise count rates Data is divided into 100 sec bins |
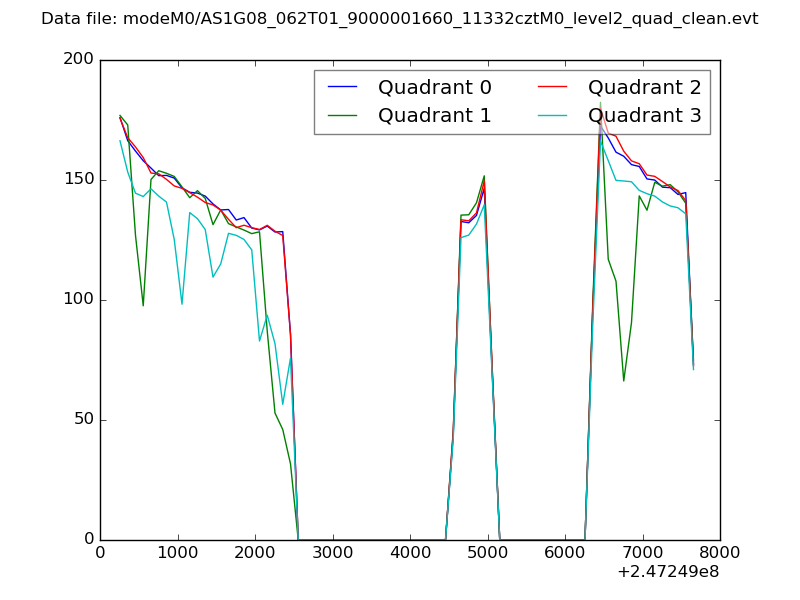 |
|
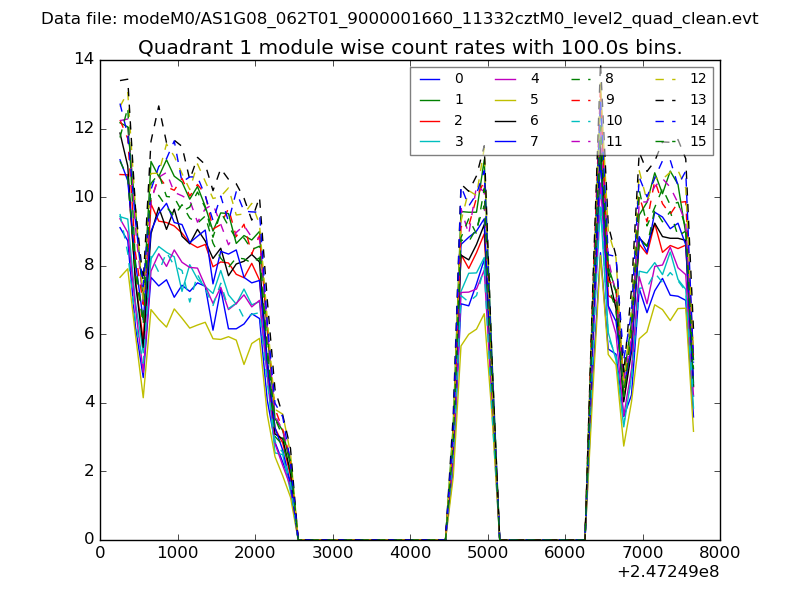
| Module-wise count rates for Quadrant A Data is divided into 100 sec bins |
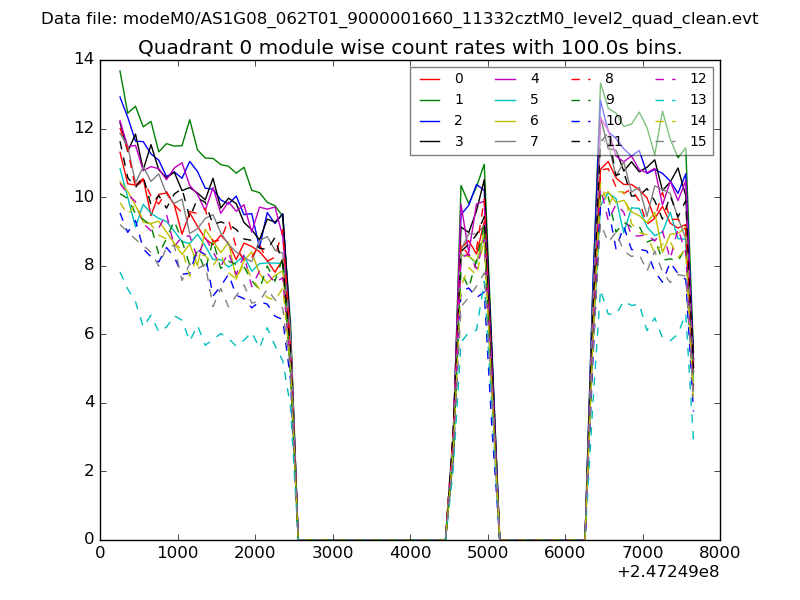 |
 |
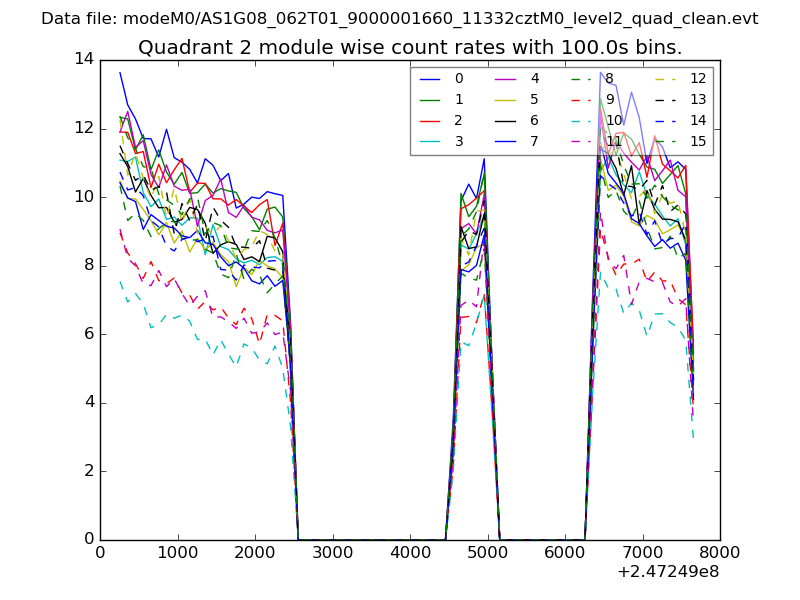
| Module-wise count rates for Quadrant B Data is divided into 100 sec bins |
 |
 |
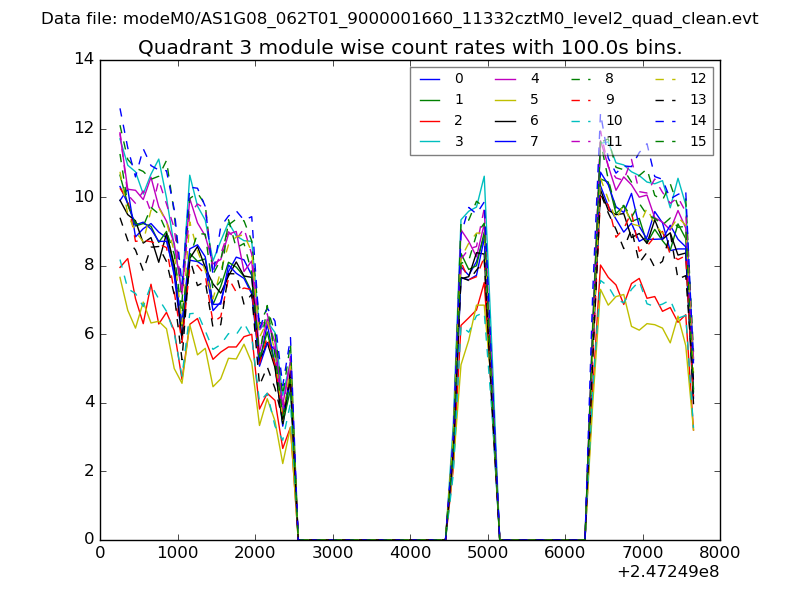
| Module-wise count rates for Quadrant C Data is divided into 100 sec bins |
 |
 |
| Module-wise count rates for Quadrant D Data is divided into 100 sec bins |
 |
 |
| Parameter | Plot |
|---|---|
| CZT HV Monitor | 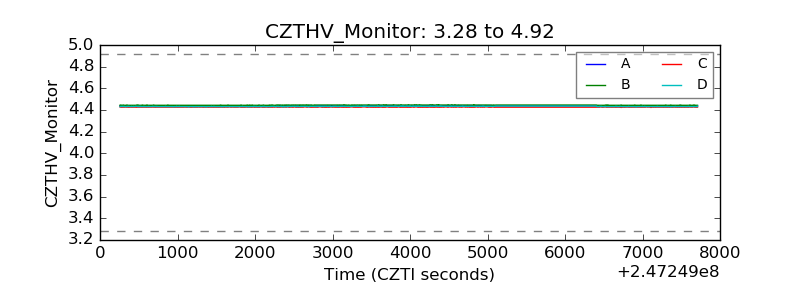 |
| D_VDD | 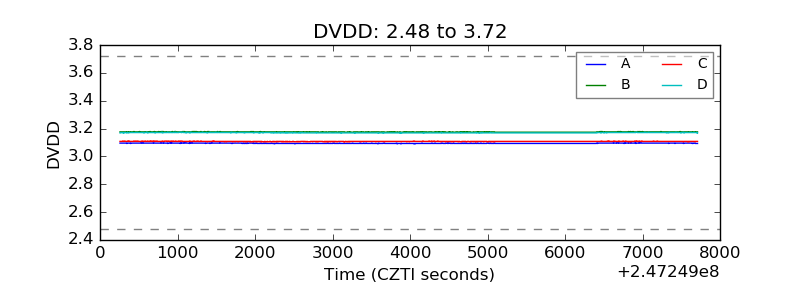 |
| Temperature 1 | 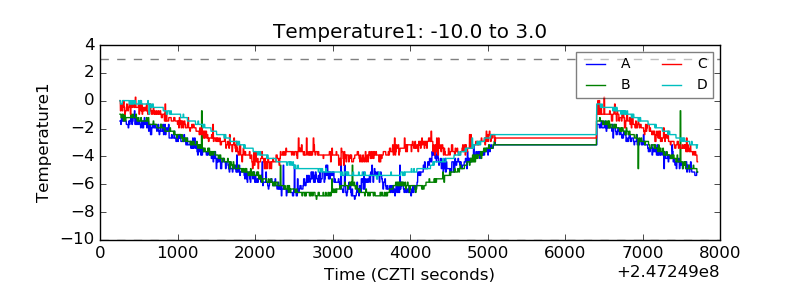 |
| Veto HV Monitor | 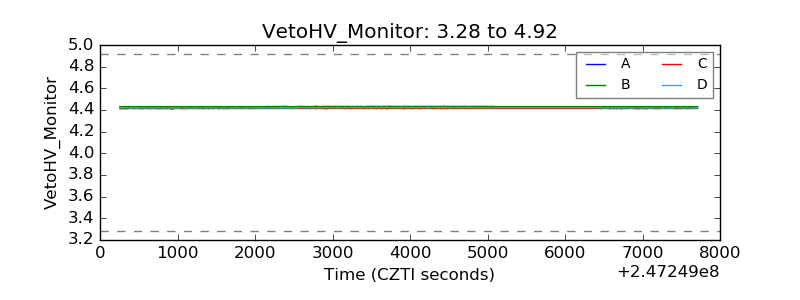 |
| Veto LLD | 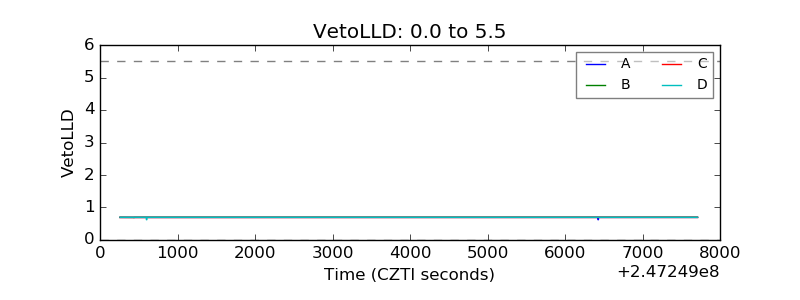 |
| Alpha Counter | 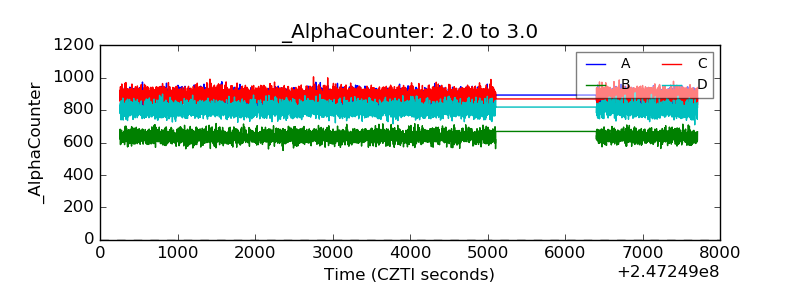 |
| _CPM_Rate | 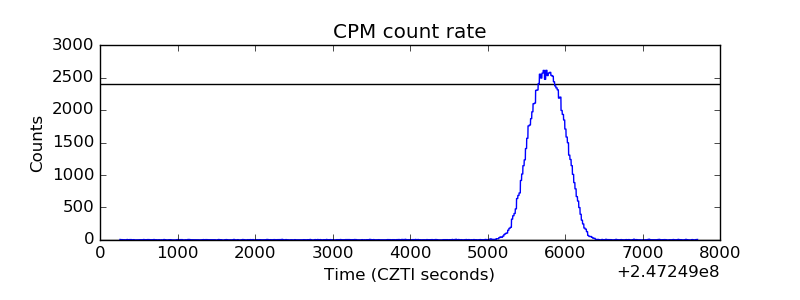 |
| CZT Counter | 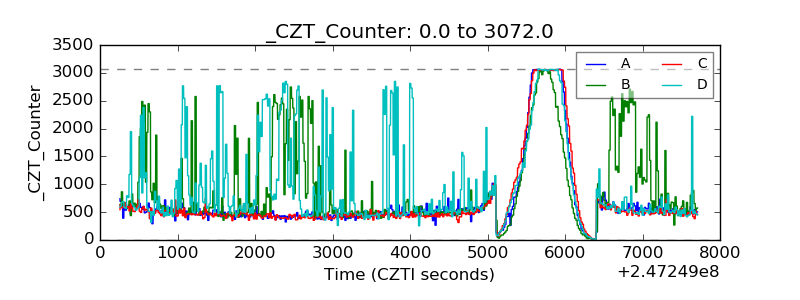 |
| +2.5 Volts monitor |  |
| +5 Volts monitor | 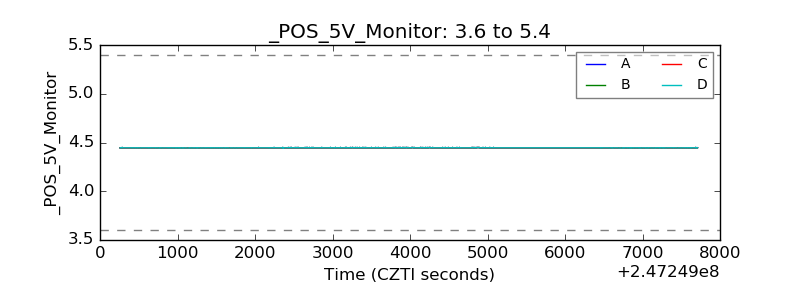 |
| _ROLL_ROT | 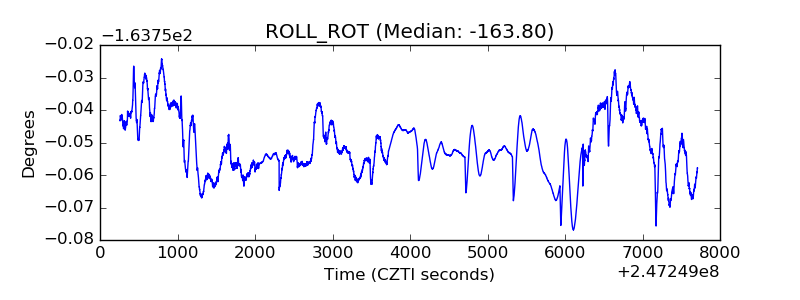 |
| _Roll_DEC | 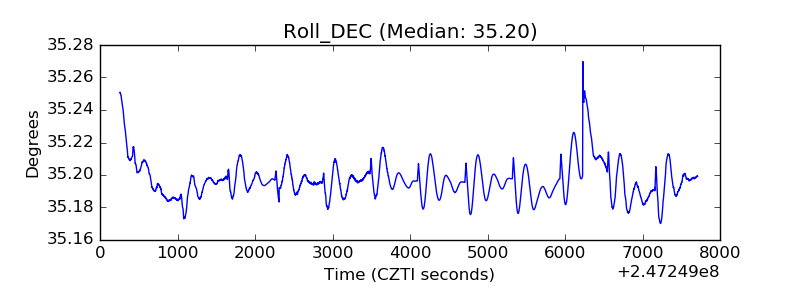 |
| _Roll_RA | 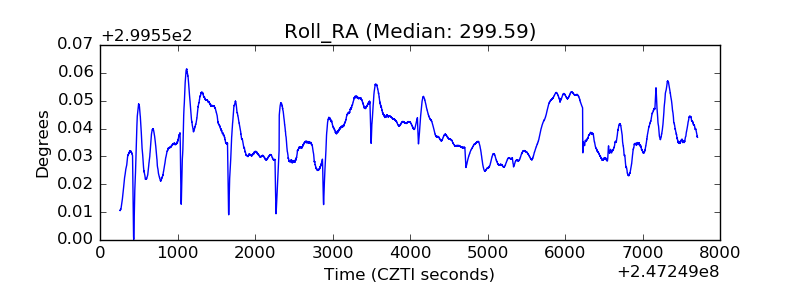 |
| Veto Counter | 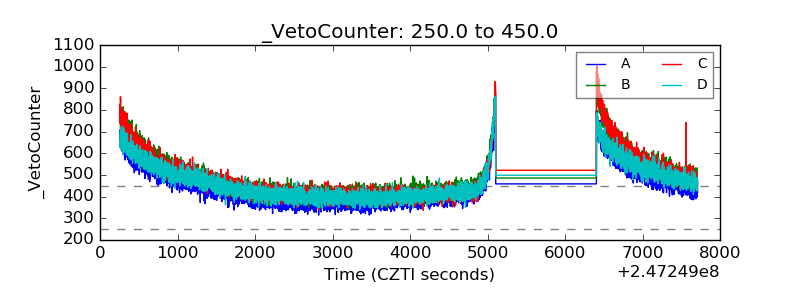 |