| Param | Original file | Final file |
|---|---|---|
| Filename | modeM0/AS1G08_062T01_9000001660_11333cztM0_level2.evt | modeM0/AS1G08_062T01_9000001660_11333cztM0_level2_quad_clean.evt |
| Size (bytes) | 536,587,200 | 91,681,920 |
| Size | 511.7 MB | 87.4 MB |
| Events in quadrant A | 3,145,087 | 603,109 |
| Events in quadrant B | 5,546,687 | 566,306 |
| Events in quadrant C | 2,978,046 | 608,286 |
| Events in quadrant D | 4,158,925 | 564,317 |
| Mode M0 | |||
|---|---|---|---|
| Quadrant | BADHDUFLAG | Total packets | Discarded packets |
| A | 0 | 13277 | 3 |
| B | 0 | 20579 | 2 |
| C | 0 | 12812 | 2 |
| D | 0 | 16424 | 2 |
| Mode SS | |||
|---|---|---|---|
| Quadrant | BADHDUFLAG | Total packets | Discarded packets |
| A | 0 | 124 | 0 |
| B | 0 | 124 | 0 |
| C | 0 | 124 | 0 |
| D | 0 | 124 | 0 |
| Mode M9 | |||
|---|---|---|---|
| Quadrant | BADHDUFLAG | Total packets | Discarded packets |
| A | 0 | 17 | 0 |
| B | 0 | 17 | 0 |
| C | 0 | 17 | 0 |
| D | 0 | 18 | 0 |
| Quadrant | Total seconds | Saturated seconds | Saturation percentage |
|---|---|---|---|
| A | 6230 | 19 | 0.304976% |
| B | 6230 | 768 | 12.327448% |
| C | 6230 | 10 | 0.160514% |
| D | 6230 | 257 | 4.125201% |
Noise dominated data is calculated using 1-second bins in cleaned event files. If a bin has >2000 counts, and if more than 50% of those come from <1% of pixels, then it is considered to be noise-dominated and hence unusable.
| Quadrant | # 1 sec bins | Bins with >0 counts | Bins with >2000 counts | High rate bins dominated by noise | Noise dominated (total time) | Noise dominated (detector-on time) | Marked lightcurve |
|---|---|---|---|---|---|---|---|
| A | 7576 | 6231 | 0 | 0 | 0.00% | 0.00% | 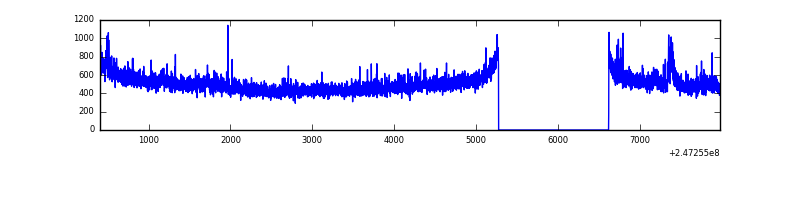 |
| B | 7576 | 6231 | 571 | 571 | 7.54% | 9.16% | 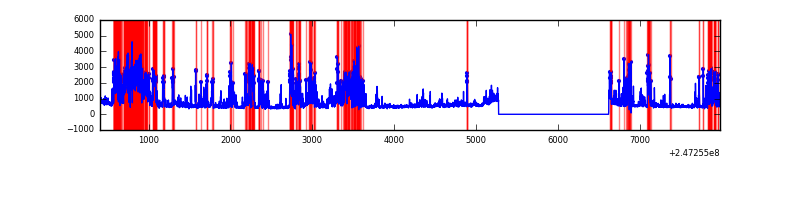 |
| C | 7576 | 6231 | 0 | 0 | 0.00% | 0.00% | 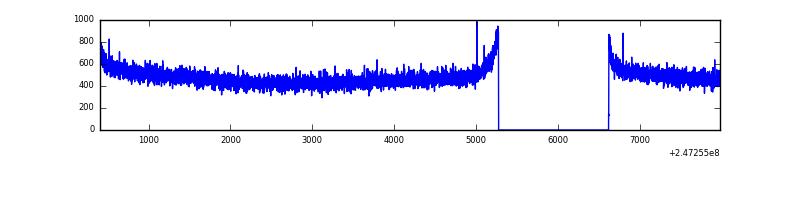 |
| D | 7576 | 6231 | 225 | 225 | 2.97% | 3.61% | 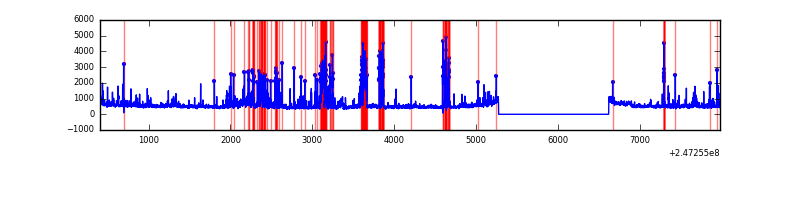 |
Top three noisy pixels from each quadrant. If the there are fewer than three noisy pixels in the level2.evt file, extra rows are filled as -1
| Pixel properties | Quadrant properties | ||||||
|---|---|---|---|---|---|---|---|
| Quadrant | DetID | PixID | Counts | Sigma | Mean | Median | Sigma |
| A | 8 | 15 | 71992 | 458.67 | 774 | 759 | 155.3 |
| A | 1 | 162 | 24999 | 156.08 | 774 | 759 | 155.3 |
| A | 13 | 251 | 22872 | 142.38 | 774 | 759 | 155.3 |
| B | 3 | 64 | 1602509 | 11585.9 | 737 | 720 | 138.3 |
| B | 4 | 239 | 742037 | 5362.02 | 737 | 720 | 138.3 |
| B | 0 | 85 | 153109 | 1102.25 | 737 | 720 | 138.3 |
| C | 13 | 61 | 5615 | 27.44 | 763 | 768 | 176.6 |
| C | 3 | 202 | 1870 | 6.24 | 763 | 768 | 176.6 |
| C | 8 | 222 | 1809 | 5.89 | 763 | 768 | 176.6 |
| D | 10 | 253 | 549679 | 3067.92 | 740 | 720 | 178.9 |
| D | 1 | 52 | 413915 | 2309.19 | 740 | 720 | 178.9 |
| D | 2 | 120 | 151132 | 840.59 | 740 | 720 | 178.9 |
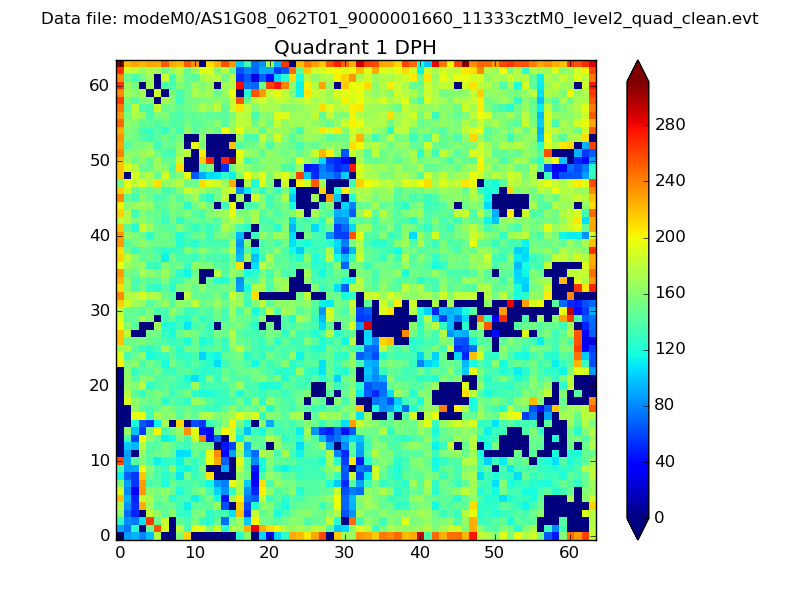
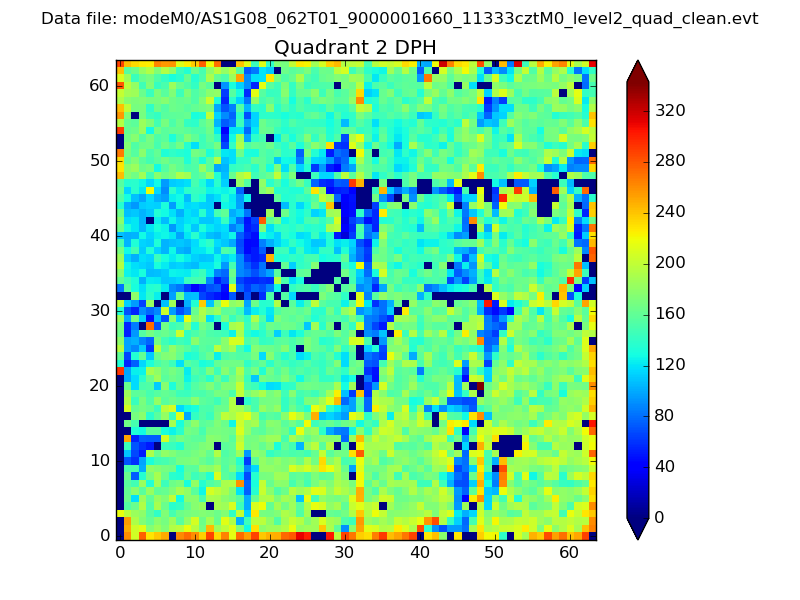
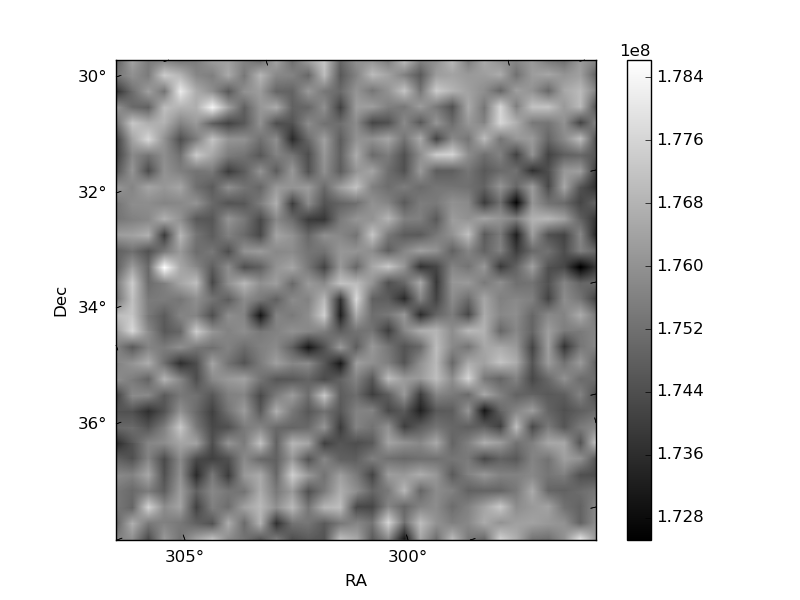
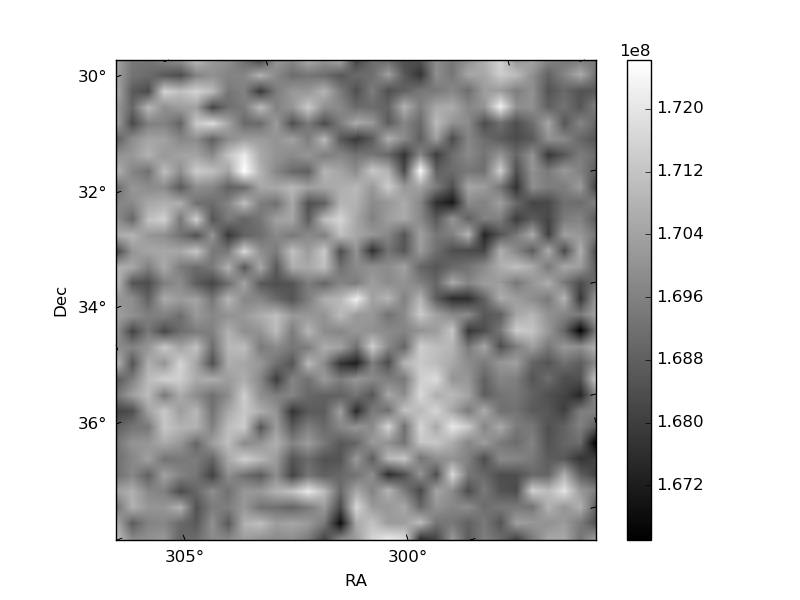
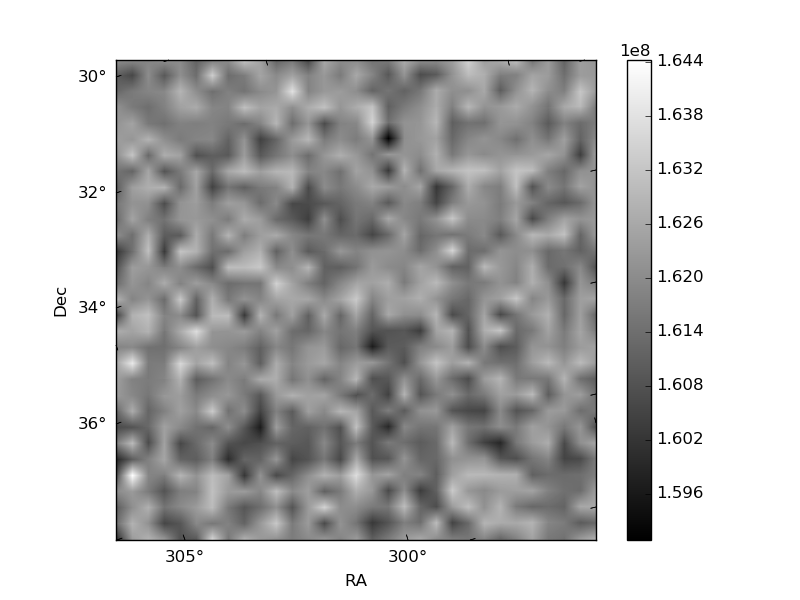
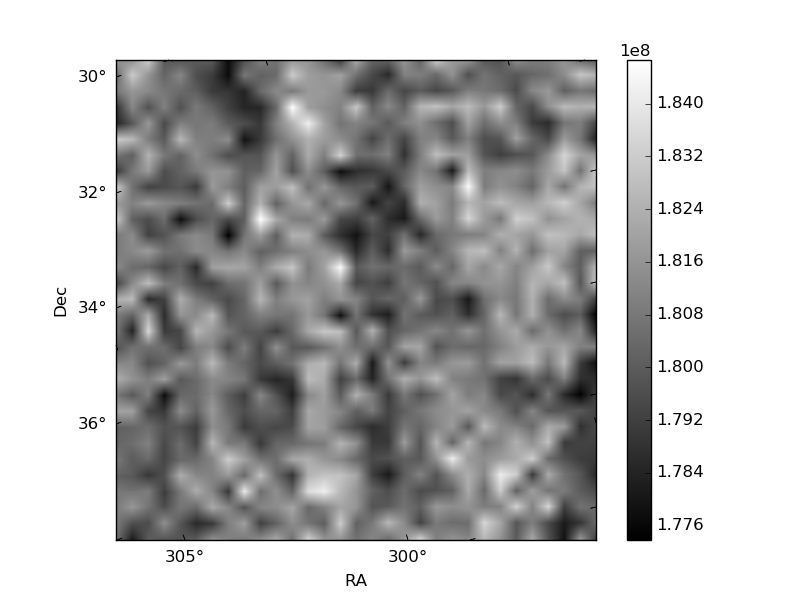
Histogram calculated using DETX and DETY for each event in the final _common_clean file
| Quadrant A |  |
 |
Quadrant B |
|---|---|---|---|
| Quadrant D |  |
 |
Quadrant C |
| Plot type | Count rate plots | Images |
|---|---|---|
| Comparison with Poisson distribution Blue bars denote a histogram of data divided into 1 sec bins. Red curve is a Poisson curve with rate = median count rate of data. |
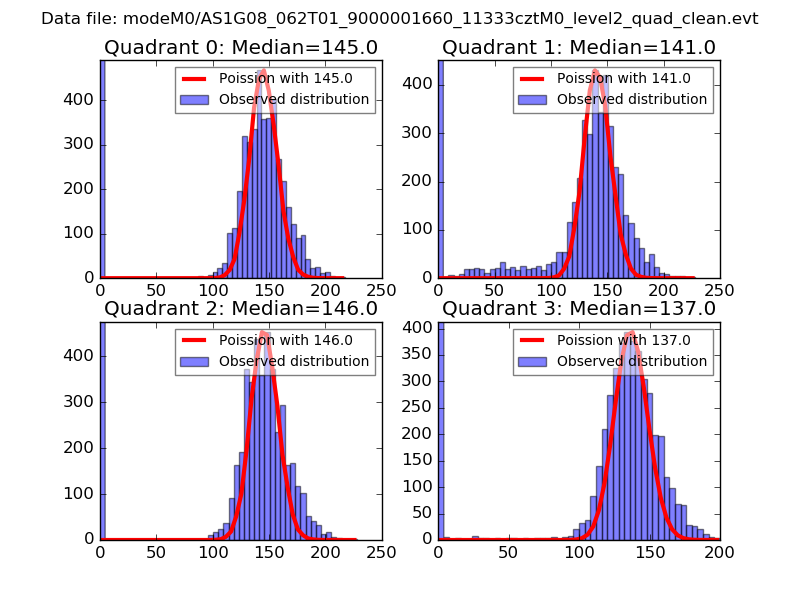 |
 |
| Quadrant-wise count rates Data is divided into 100 sec bins |
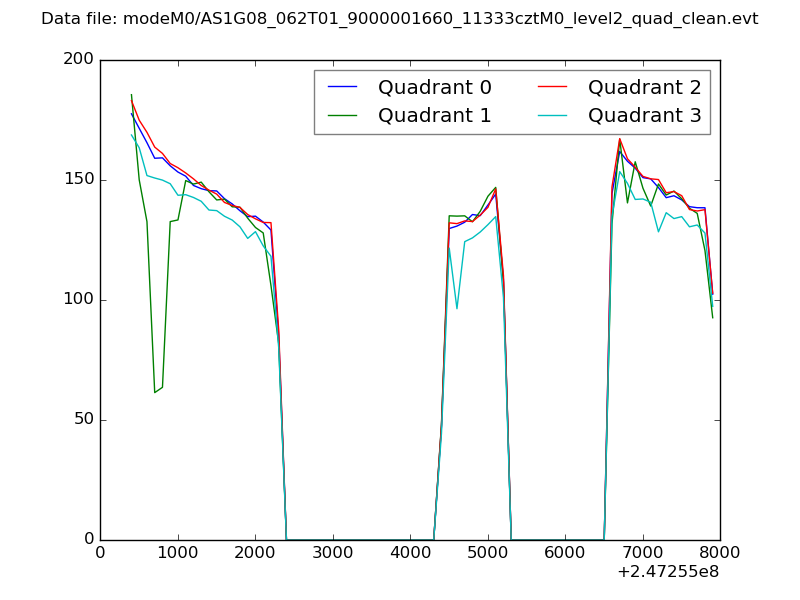 |
|
| Module-wise count rates for Quadrant A Data is divided into 100 sec bins |
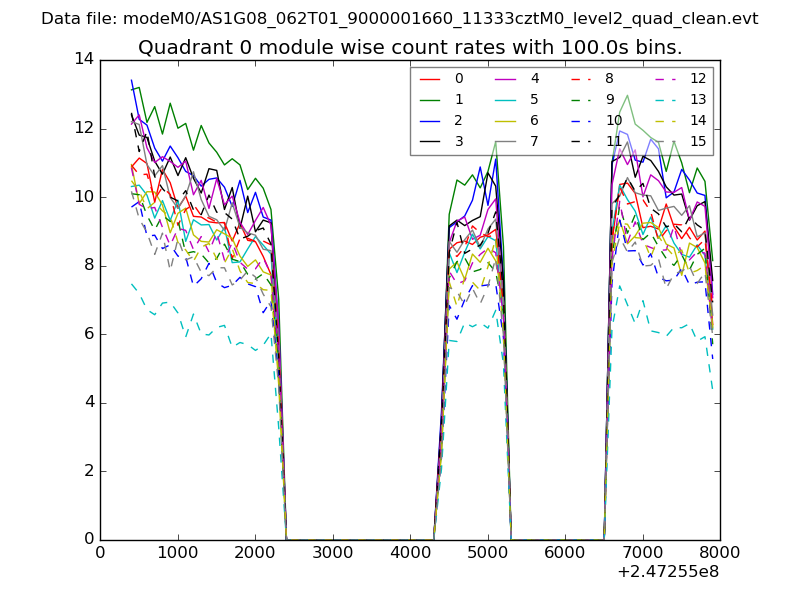 |
 |
| Module-wise count rates for Quadrant B Data is divided into 100 sec bins |
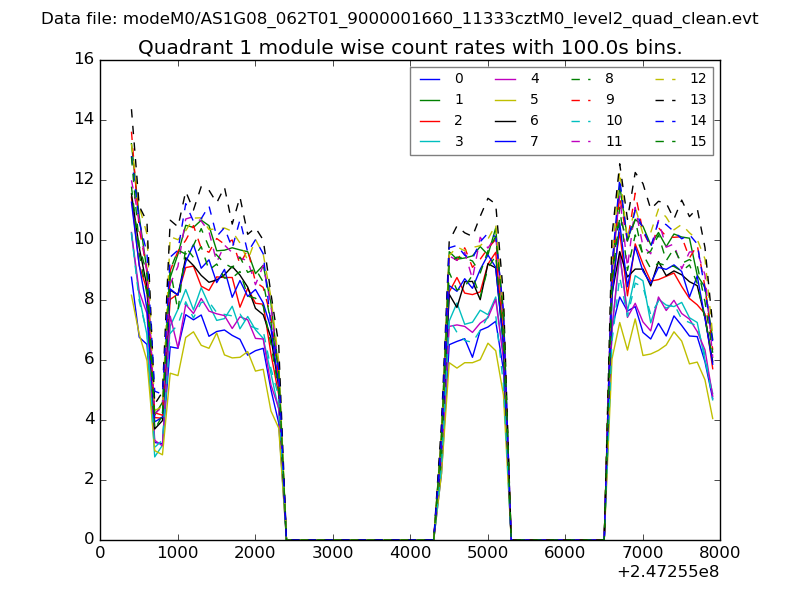 |
 |
| Module-wise count rates for Quadrant C Data is divided into 100 sec bins |
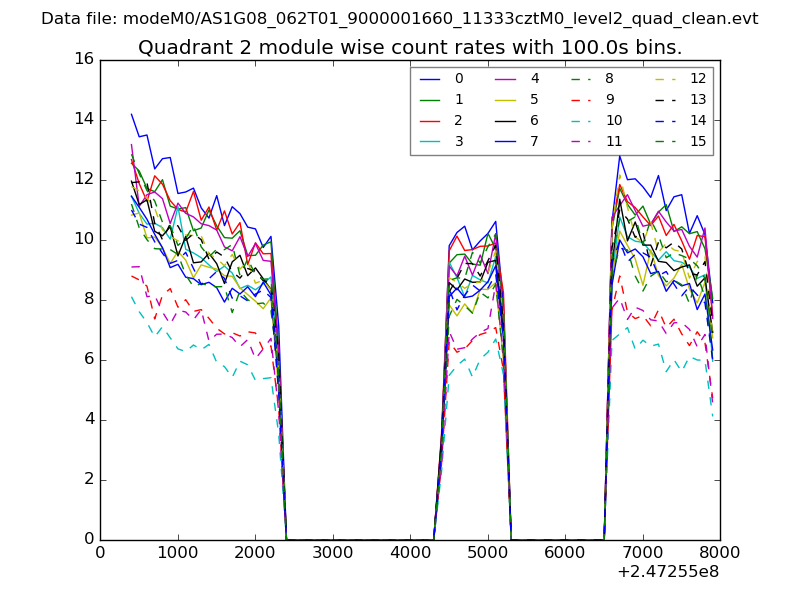 |
 |
| Module-wise count rates for Quadrant D Data is divided into 100 sec bins |
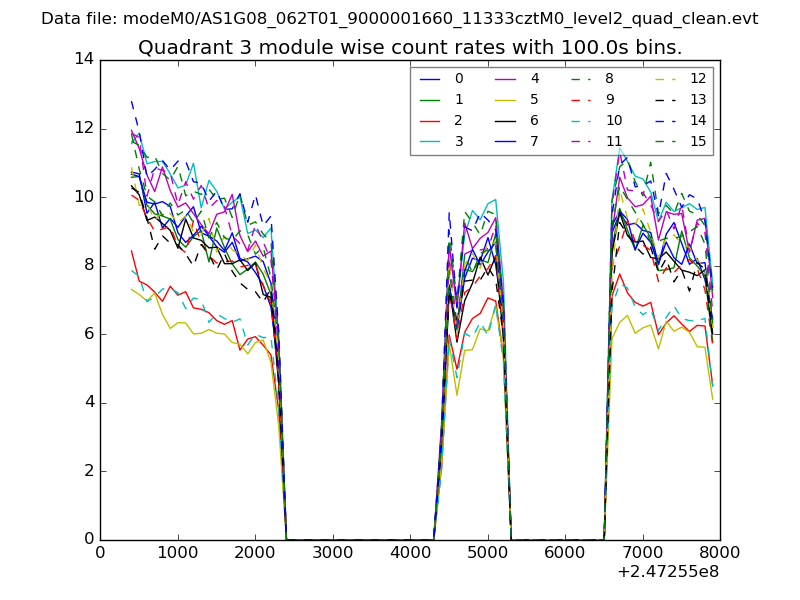 |
 |
| Parameter | Plot |
|---|---|
| CZT HV Monitor | 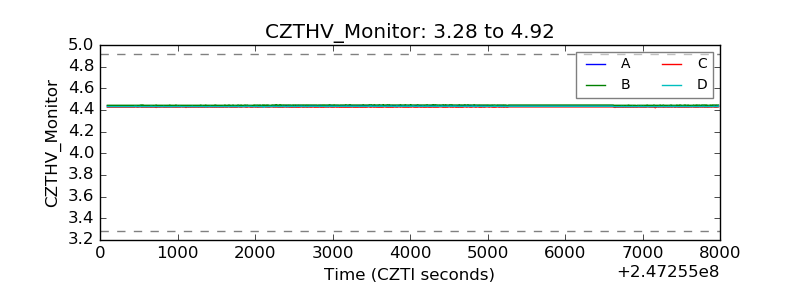 |
| D_VDD | 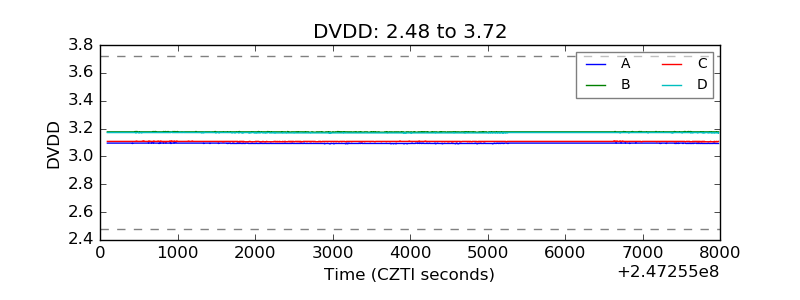 |
| Temperature 1 | 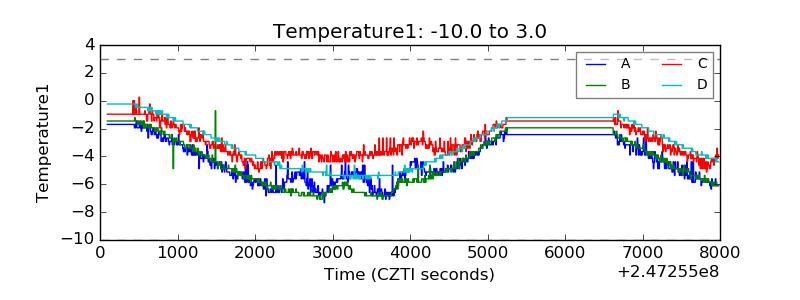 |
| Veto HV Monitor | 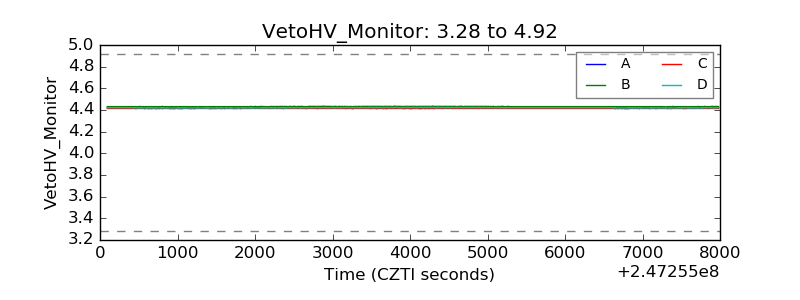 |
| Veto LLD | 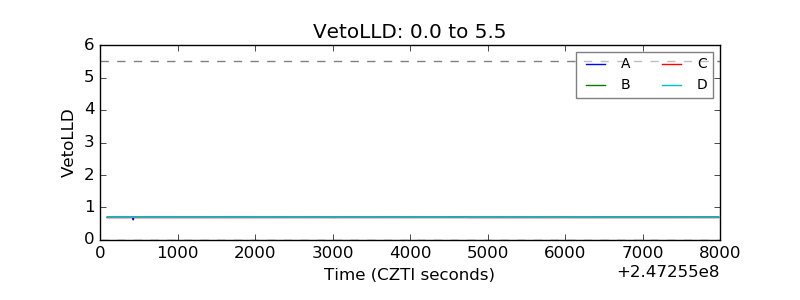 |
| Alpha Counter | 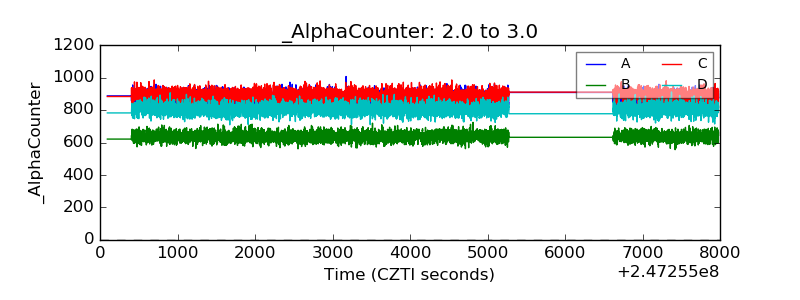 |
| _CPM_Rate | 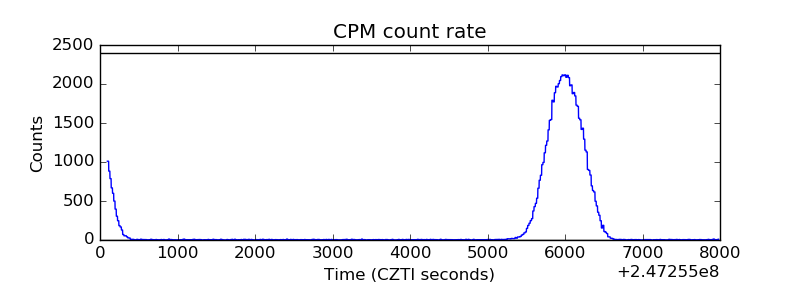 |
| CZT Counter | 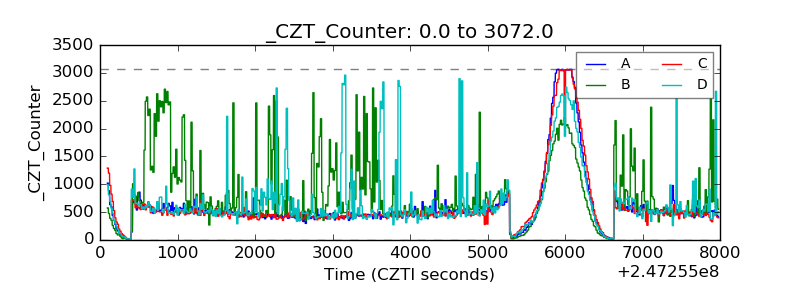 |
| +2.5 Volts monitor |  |
| +5 Volts monitor |  |
| _ROLL_ROT | 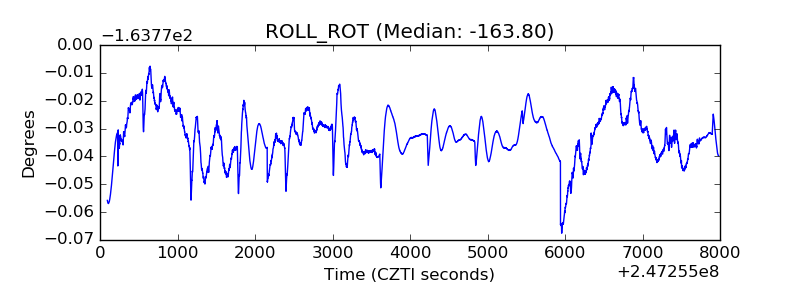 |
| _Roll_DEC | 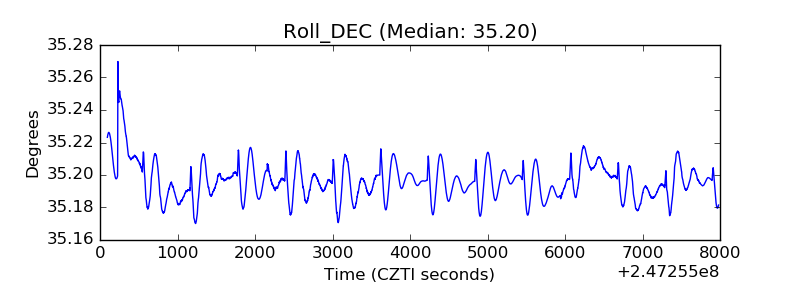 |
| _Roll_RA | 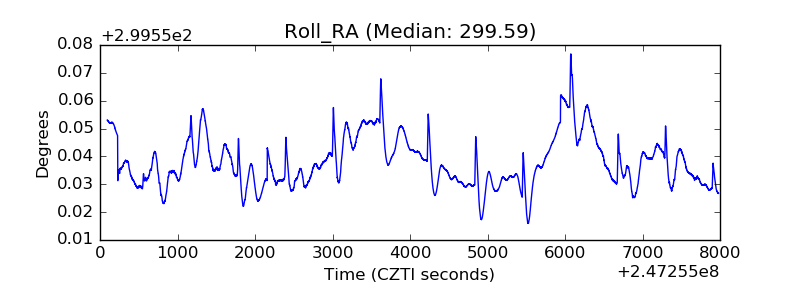 |
| Veto Counter | 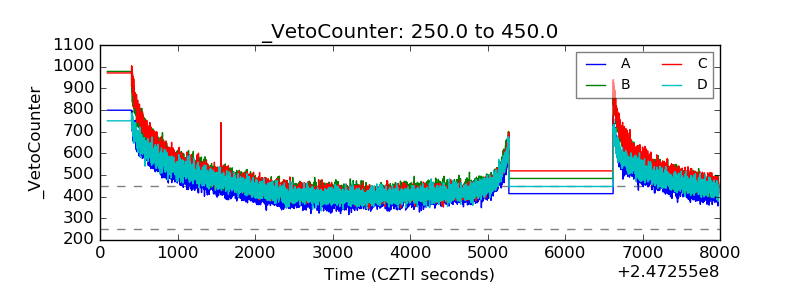 |