| Param | Original file | Final file |
|---|---|---|
| Filename | modeM0/AS1G08_062T01_9000001660_11334cztM0_level2.evt | modeM0/AS1G08_062T01_9000001660_11334cztM0_level2_quad_clean.evt |
| Size (bytes) | 506,759,040 | 87,635,520 |
| Size | 483.3 MB | 83.6 MB |
| Events in quadrant A | 3,243,194 | 567,407 |
| Events in quadrant B | 4,751,529 | 549,192 |
| Events in quadrant C | 2,977,697 | 573,099 |
| Events in quadrant D | 3,944,909 | 522,021 |
| Mode M0 | |||
|---|---|---|---|
| Quadrant | BADHDUFLAG | Total packets | Discarded packets |
| A | 0 | 13696 | 3 |
| B | 0 | 18296 | 2 |
| C | 0 | 12988 | 2 |
| D | 0 | 15934 | 2 |
| Mode SS | |||
|---|---|---|---|
| Quadrant | BADHDUFLAG | Total packets | Discarded packets |
| A | 0 | 130 | 0 |
| B | 0 | 130 | 0 |
| C | 0 | 130 | 0 |
| D | 0 | 130 | 0 |
| Mode M9 | |||
|---|---|---|---|
| Quadrant | BADHDUFLAG | Total packets | Discarded packets |
| A | 0 | 19 | 0 |
| B | 0 | 19 | 0 |
| C | 0 | 19 | 0 |
| D | 0 | 20 | 0 |
| Quadrant | Total seconds | Saturated seconds | Saturation percentage |
|---|---|---|---|
| A | 6328 | 49 | 0.774336% |
| B | 6328 | 515 | 8.138432% |
| C | 6328 | 17 | 0.268647% |
| D | 6328 | 244 | 3.855879% |
Noise dominated data is calculated using 1-second bins in cleaned event files. If a bin has >2000 counts, and if more than 50% of those come from <1% of pixels, then it is considered to be noise-dominated and hence unusable.
| Quadrant | # 1 sec bins | Bins with >0 counts | Bins with >2000 counts | High rate bins dominated by noise | Noise dominated (total time) | Noise dominated (detector-on time) | Marked lightcurve |
|---|---|---|---|---|---|---|---|
| A | 7593 | 6329 | 0 | 0 | 0.00% | 0.00% | 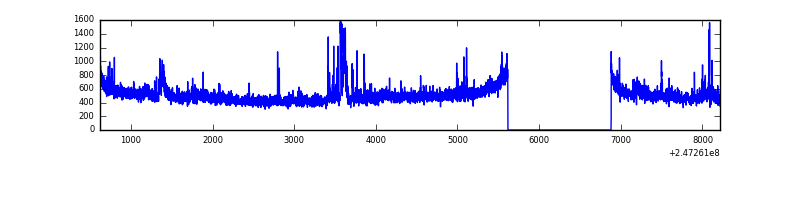 |
| B | 7593 | 6329 | 308 | 308 | 4.06% | 4.87% | 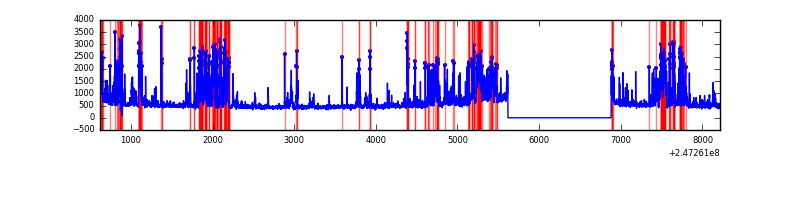 |
| C | 7593 | 6329 | 0 | 0 | 0.00% | 0.00% | 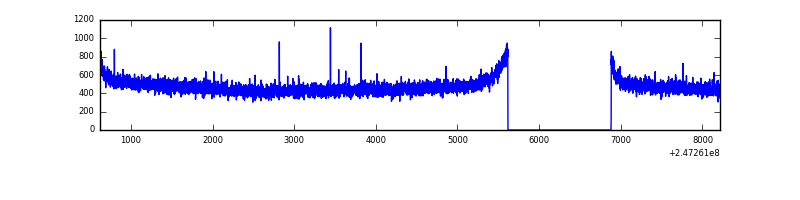 |
| D | 7593 | 6329 | 161 | 161 | 2.12% | 2.54% | 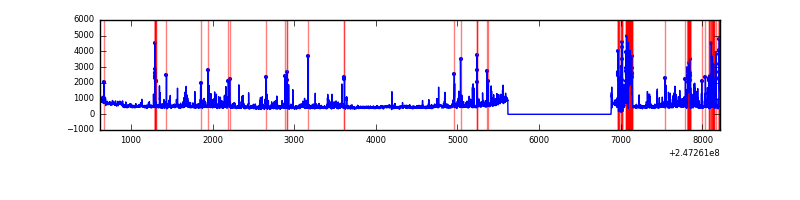 |
Top three noisy pixels from each quadrant. If the there are fewer than three noisy pixels in the level2.evt file, extra rows are filled as -1
| Pixel properties | Quadrant properties | ||||||
|---|---|---|---|---|---|---|---|
| Quadrant | DetID | PixID | Counts | Sigma | Mean | Median | Sigma |
| A | 8 | 15 | 77371 | 495.23 | 769 | 754 | 154.7 |
| A | 13 | 210 | 73937 | 473.04 | 769 | 754 | 154.7 |
| A | 13 | 251 | 55139 | 351.53 | 769 | 754 | 154.7 |
| B | 4 | 239 | 1199227 | 8446.01 | 757 | 737 | 141.9 |
| B | 3 | 64 | 495116 | 3483.99 | 757 | 737 | 141.9 |
| B | 3 | 189 | 37432 | 258.6 | 757 | 737 | 141.9 |
| C | 13 | 61 | 5529 | 26.94 | 762 | 767 | 176.8 |
| C | 12 | 4 | 3127 | 13.35 | 762 | 767 | 176.8 |
| C | 1 | 3 | 2249 | 8.38 | 762 | 767 | 176.8 |
| D | 1 | 52 | 554580 | 3119.67 | 736 | 716 | 177.5 |
| D | 2 | 120 | 194194 | 1089.77 | 736 | 716 | 177.5 |
| D | 10 | 253 | 162036 | 908.64 | 736 | 716 | 177.5 |
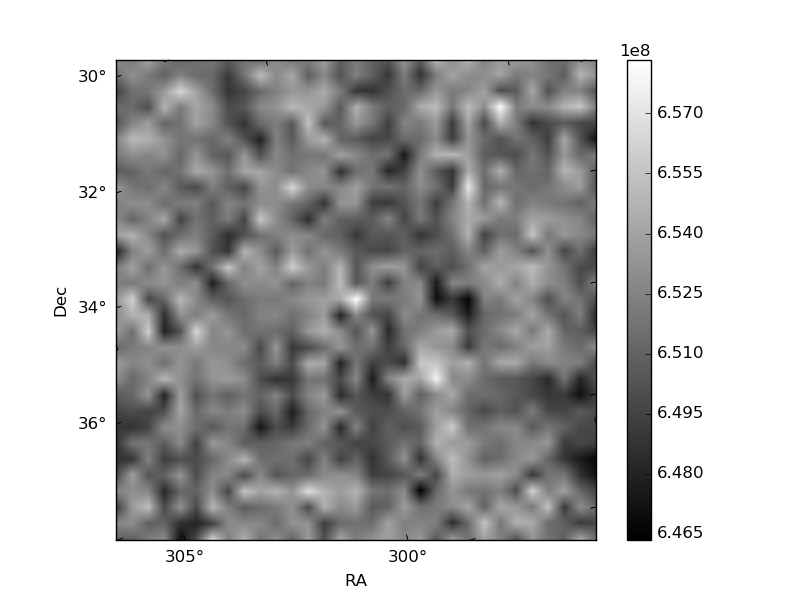
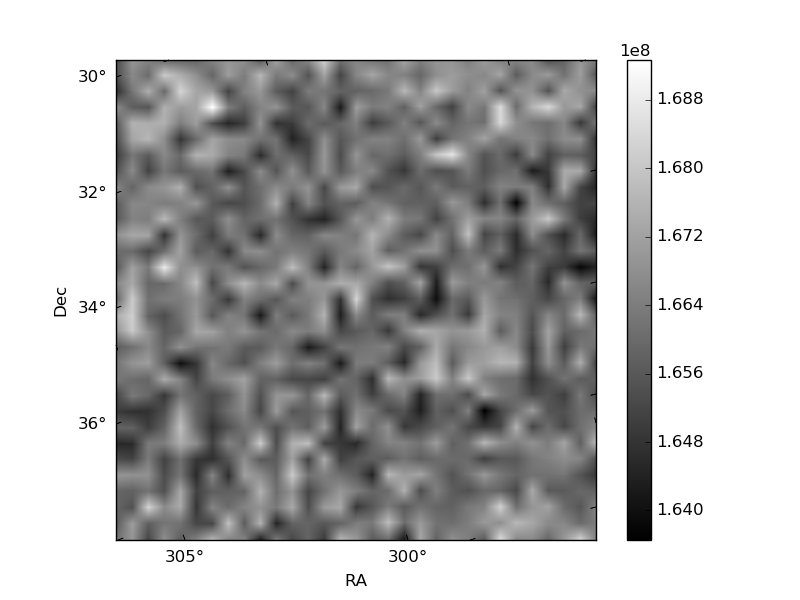
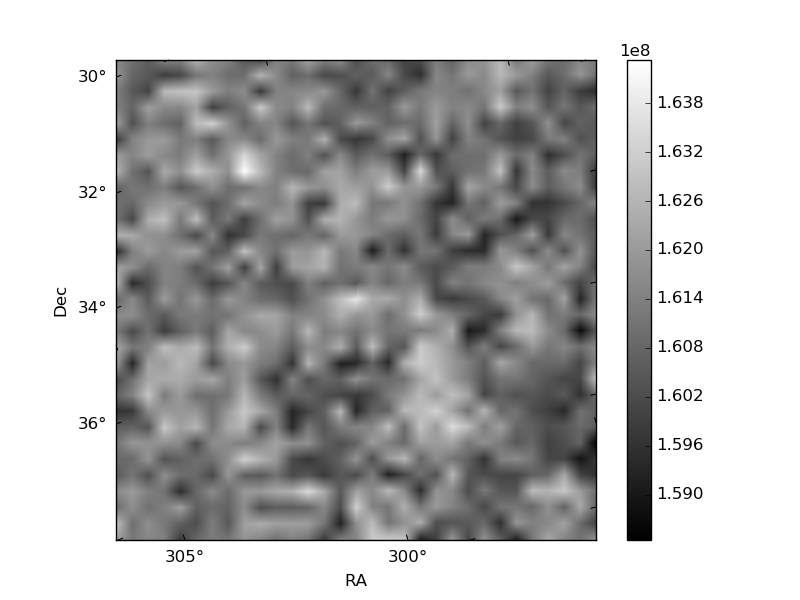
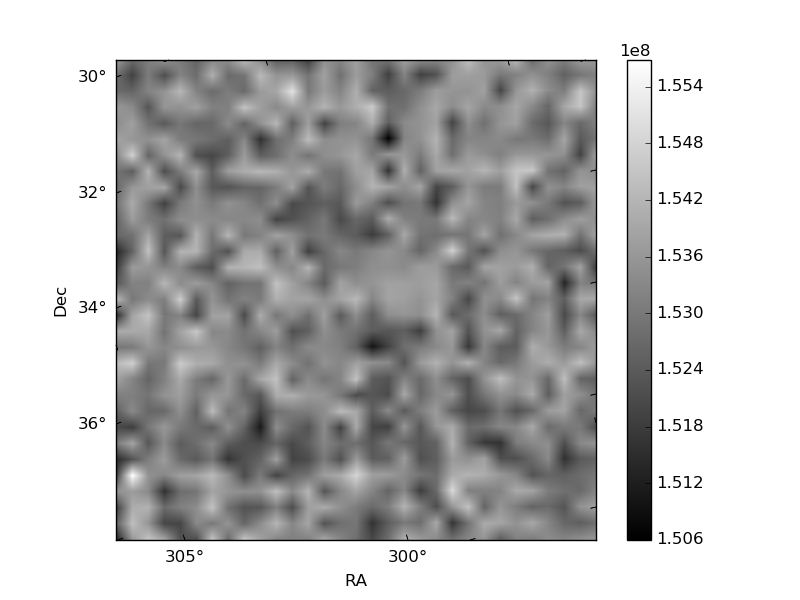
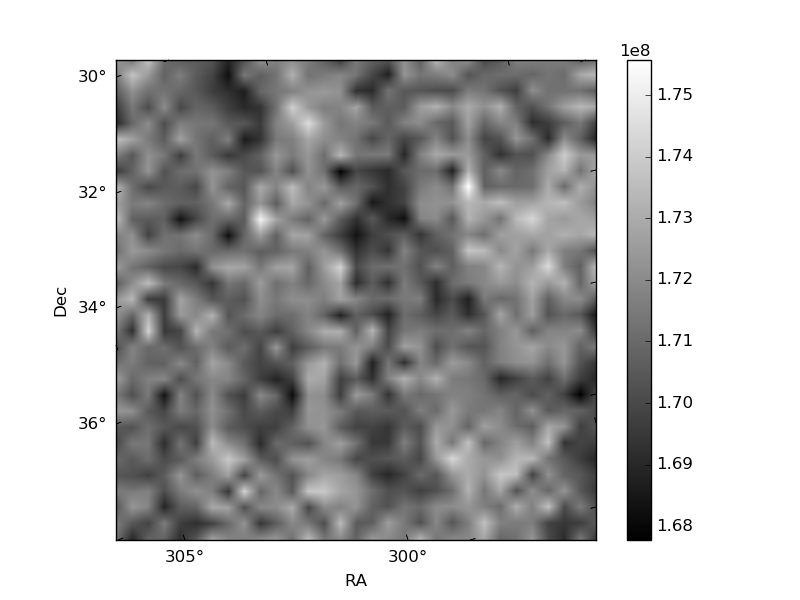
Histogram calculated using DETX and DETY for each event in the final _common_clean file
| Quadrant A | 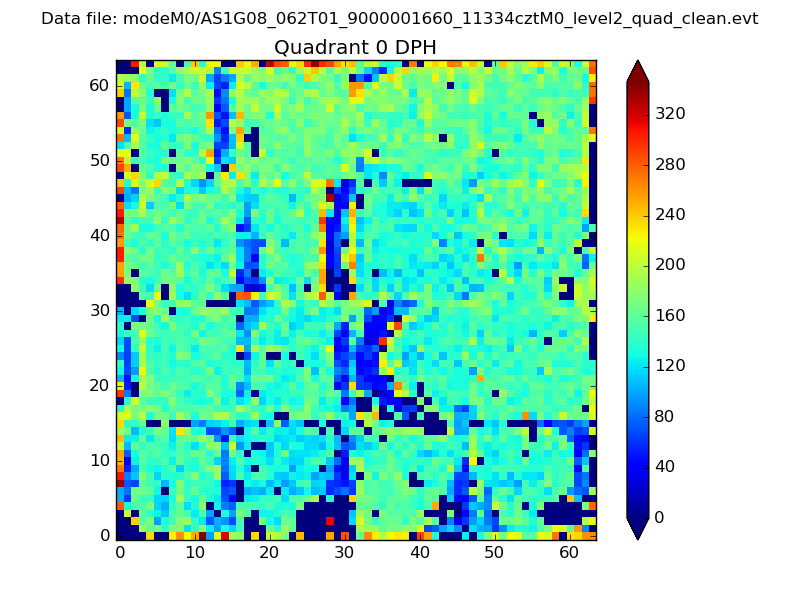 |
 |
Quadrant B |
|---|---|---|---|
| Quadrant D | 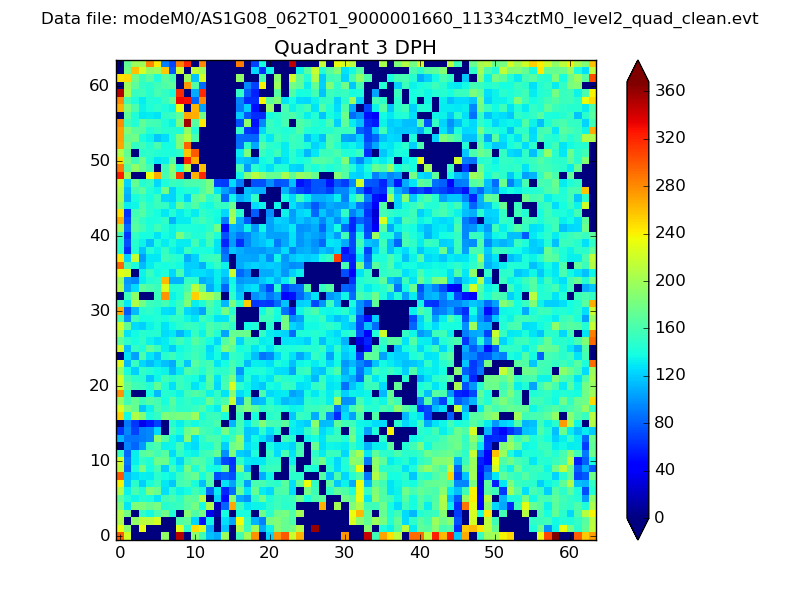 |
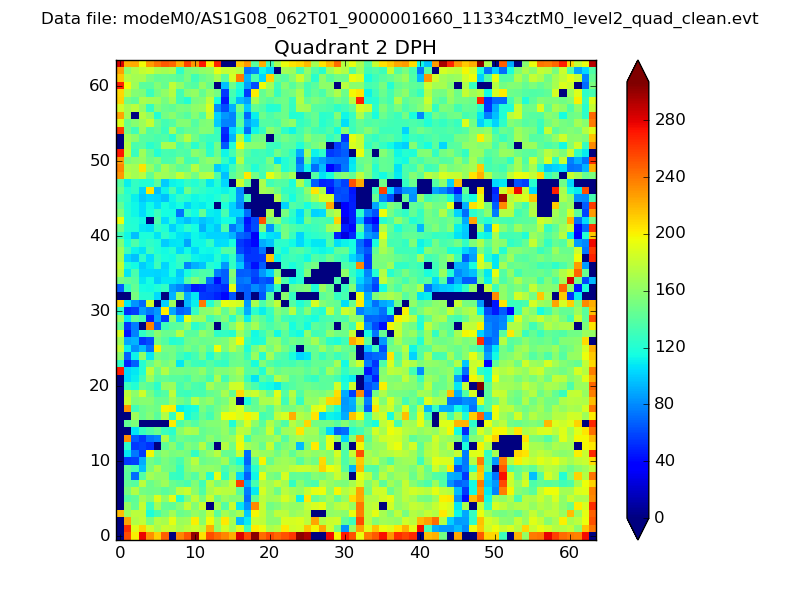 |
Quadrant C |
| Plot type | Count rate plots | Images |
|---|---|---|
| Comparison with Poisson distribution Blue bars denote a histogram of data divided into 1 sec bins. Red curve is a Poisson curve with rate = median count rate of data. |
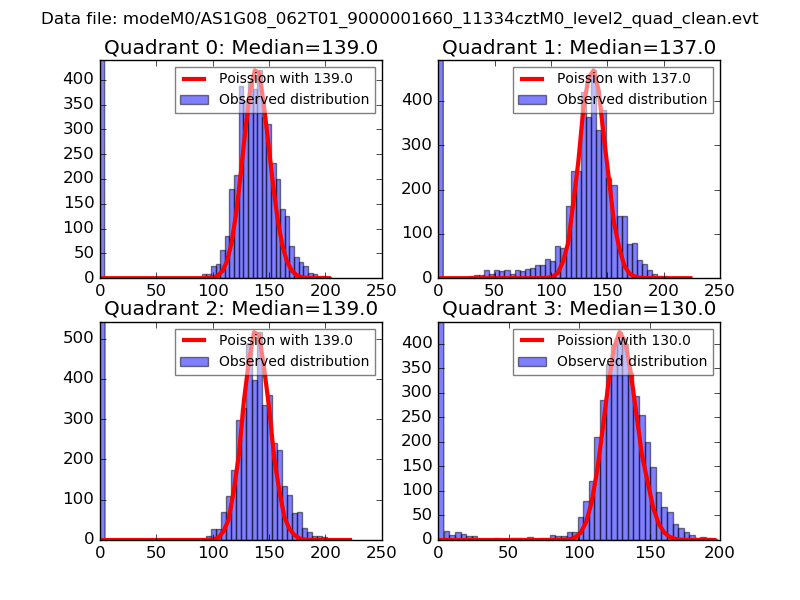 |
 |
| Quadrant-wise count rates Data is divided into 100 sec bins |
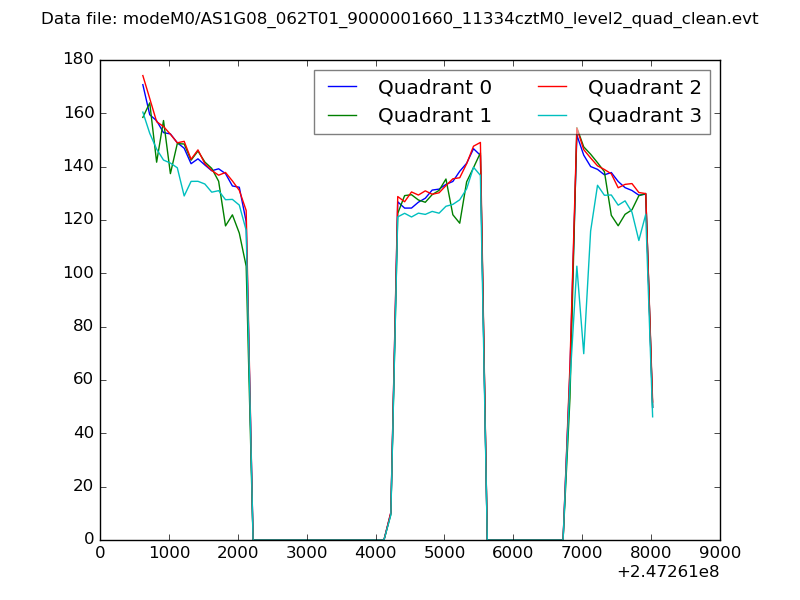 |
|
| Module-wise count rates for Quadrant A Data is divided into 100 sec bins |
 |
 |
| Module-wise count rates for Quadrant B Data is divided into 100 sec bins |
 |
 |
| Module-wise count rates for Quadrant C Data is divided into 100 sec bins |
 |
 |
| Module-wise count rates for Quadrant D Data is divided into 100 sec bins |
 |
 |
| Parameter | Plot |
|---|---|
| CZT HV Monitor | 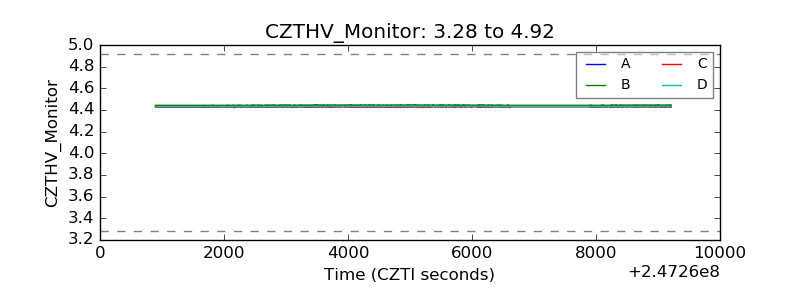 |
| D_VDD | 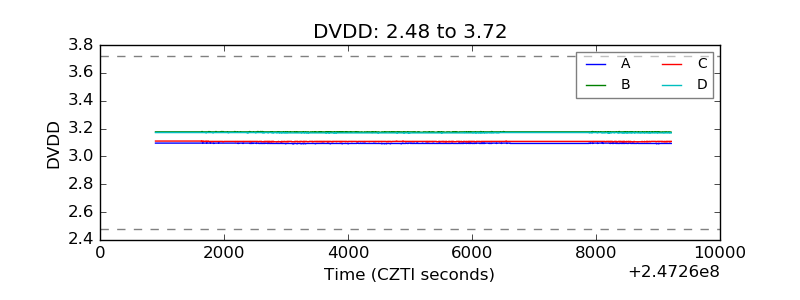 |
| Temperature 1 | 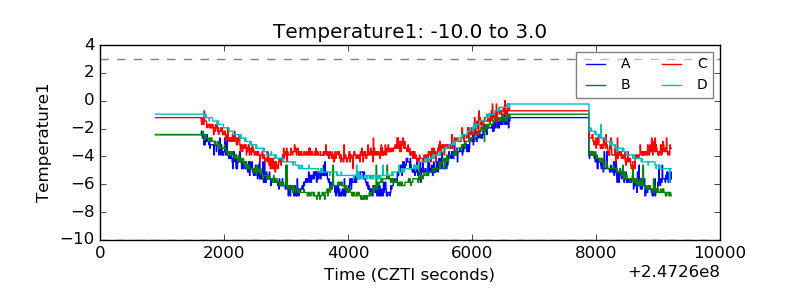 |
| Veto HV Monitor | 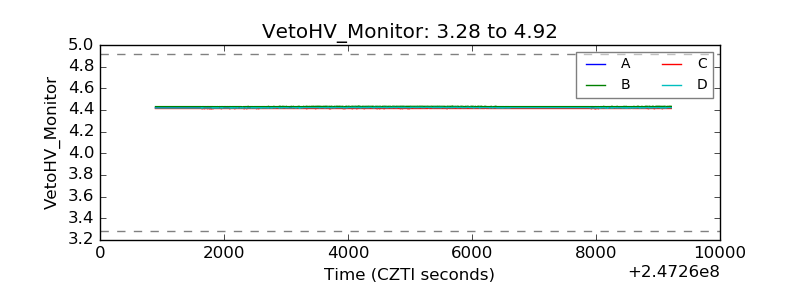 |
| Veto LLD | 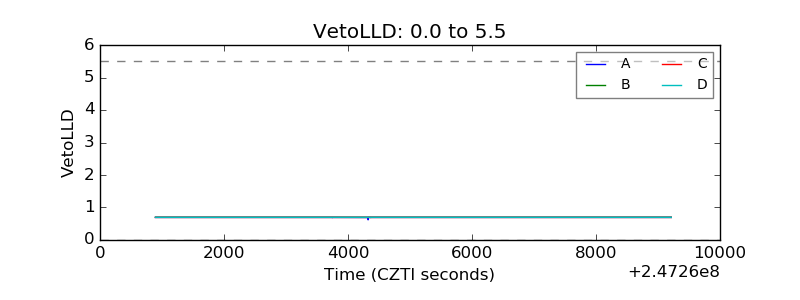 |
| Alpha Counter | 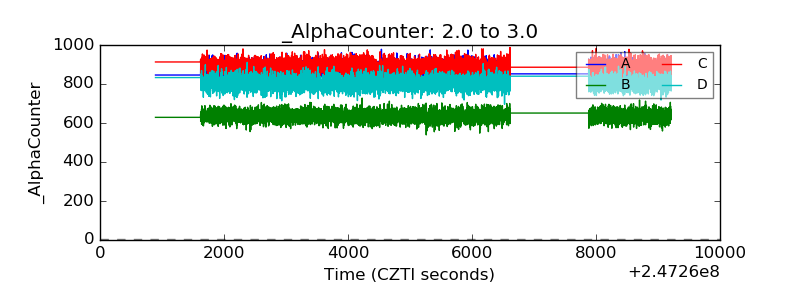 |
| _CPM_Rate | 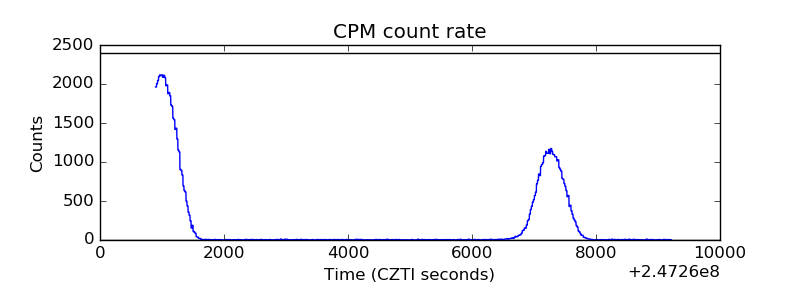 |
| CZT Counter | 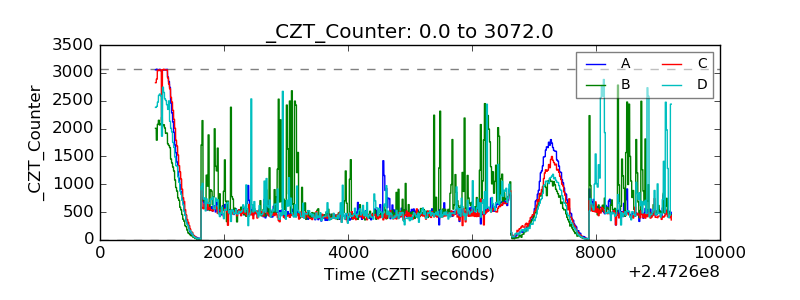 |
| +2.5 Volts monitor |  |
| +5 Volts monitor |  |
| _ROLL_ROT |  |
| _Roll_DEC |  |
| _Roll_RA | 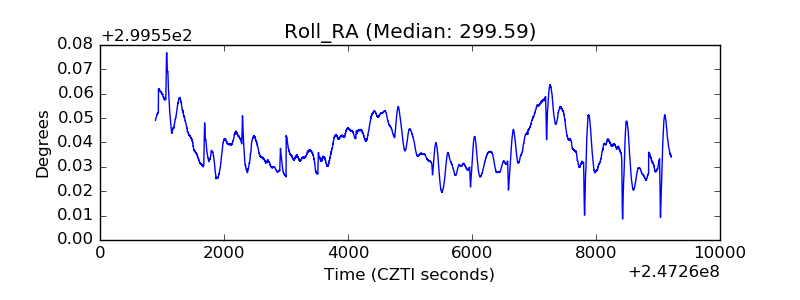 |
| Veto Counter | 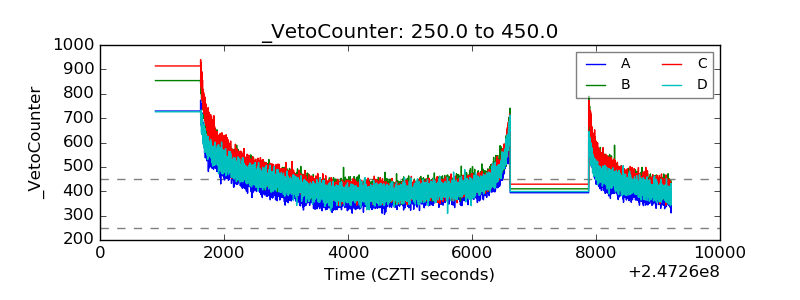 |